|
<< Click to Display Table of Contents >> Data Mart Data Set Task Information Statistics |
  
|
|
<< Click to Display Table of Contents >> Data Mart Data Set Task Information Statistics |
  
|
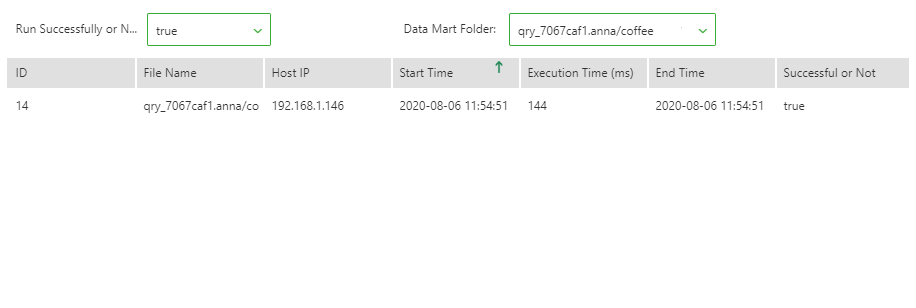
Record the statistics of the scheduling task of this node, which can be filtered by whether the task runs successfully or not and the data mart folder.
"Run successfully" includes several options, which are true and false respectively;
In data mart folder, you can select all the data mart folders in the system to view the related contents.

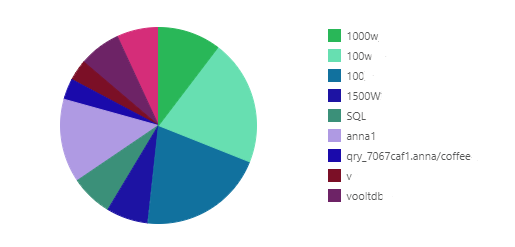
Folder execution times statistics:
The pie chart shows the proportion of the execution times of all the folders. Different colors represent different folders. The larger the block, the more times it is executed and the higher the usage frequency. Therefore, it can be focused on.

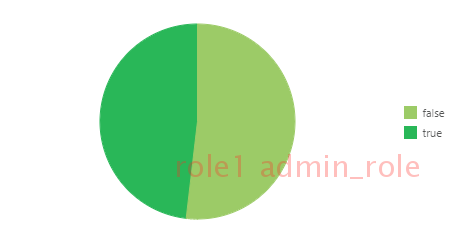
Task execution success rate:
This pie chart can be used to understand the success rate of all the execution processes. This chart can be used to identify the user's usage. If the failure is relatively high, administrators need to be vigilant.
