|
<< Click to Display Table of Contents >> Create dashboard application experiment |
  
|
|
<< Click to Display Table of Contents >> Create dashboard application experiment |
  
|
New in version 9.1, experiments created by plug-in operators can be used to create dashboard.
Explain the specific usage through the following cases:
❖Application of shopping basket analysis experiment in creating dashboard
This experiment is a typical shopping basket analysis model. Analysts can discover the association of different commodity items in the transaction data through the association rule model, so as to find out the customer's buying behavior pattern.
•Data preparation
Users and purchased products filtered by the shopping basket data set.
In the case, the preliminary processing has been carried out, and the processing process is not the focus of the case.
•Set up experiment
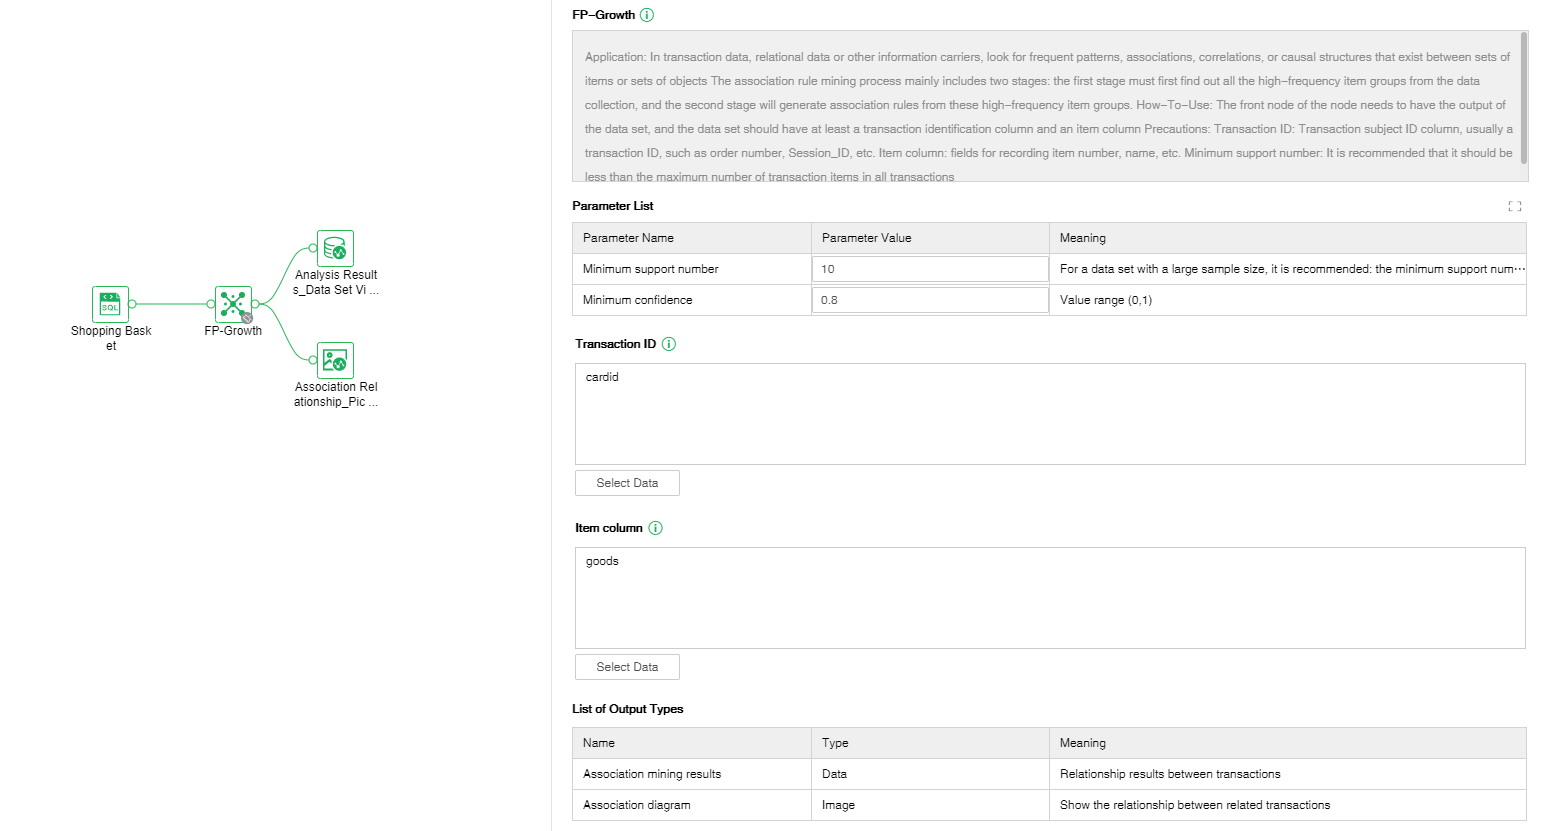
Through the FP-Growth algorithm under association rules, the shopping basket analysis experiment is completed.
FP-Growth:
Purpose: In transaction data, relational data or other information carriers, the process of finding frequent patterns, associations, correlations, or causal structures existing in item collections or object collections mainly includes two stages: the first stage must first Find all the high-frequency item groups from the data collection, and then generate association rules from these high-frequency item groups in the second stage.
Usage: The front node of the node needs to have the output of the data set, and the data set should have at least a transaction identification column and an item column.
Precautions:
1. Transaction ID: The transaction subject ID column, usually a certain transaction ID, such as order number, Session_ID, etc.
2. Item column: fields for recording item number, name and other information. Minimum support number: It is recommended that it should be less than the maximum number of transaction items in all transactions.

•Set node
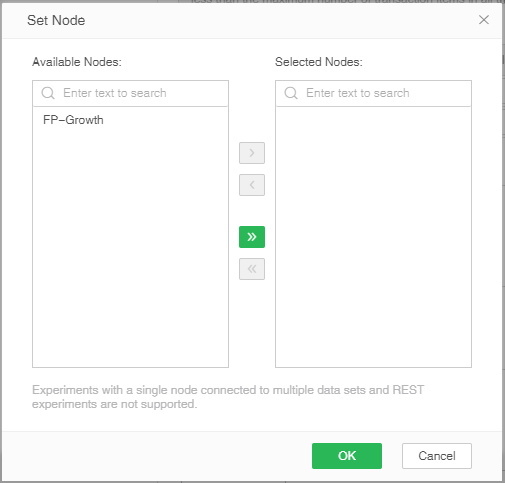
After the experiment is completed, the parameter settings are correct, and the data set view is connected to view the analysis results. Then click the set node button on the toolbar, and the set node pop-up window will pop up.

Setting the node function can filter out the nodes that can be used to make reports in the experiment, following the following rules:
1. It does not support experiments with a single node connecting multiple data sets and REST experiments.
2. It does not support experiments where the data set does not exist in the output list. (The output of the operator is shown in the configuration item on the right)
3. Only display nodes whose node status is successful. (Include nodes whose status is that the data has been cleared)
After setting up the nodes used to make the dashboard, save the experiment.
•Use experiment
Enter the production report module, create a new report, and select the data set with the same column name as the experiment above (it can contain other columns, but it must contain all the columns in the data set in the experiment).
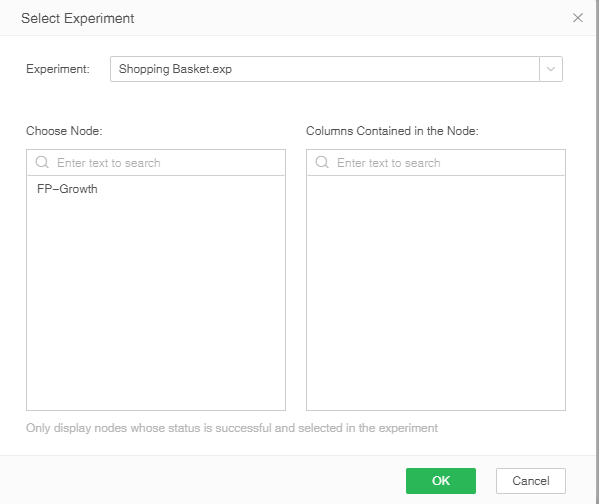
Select the application experiment under the more buttons on the right, and the select experiment pop-up window will pop up.

In this pop-up window, you can select a previously saved experiment. After selecting the experiment, the node list will automatically load the nodes that have been saved in the experiment. After selecting the node, the field name used will be displayed on the right, click OK, and the experiment will be executed.
The process of applying the experiment is equivalent to the process of replacing the data set in the saved experiment and running it. Errors during the running of the experiment will be prompted when the experiment is applied.
•Generate experimental results
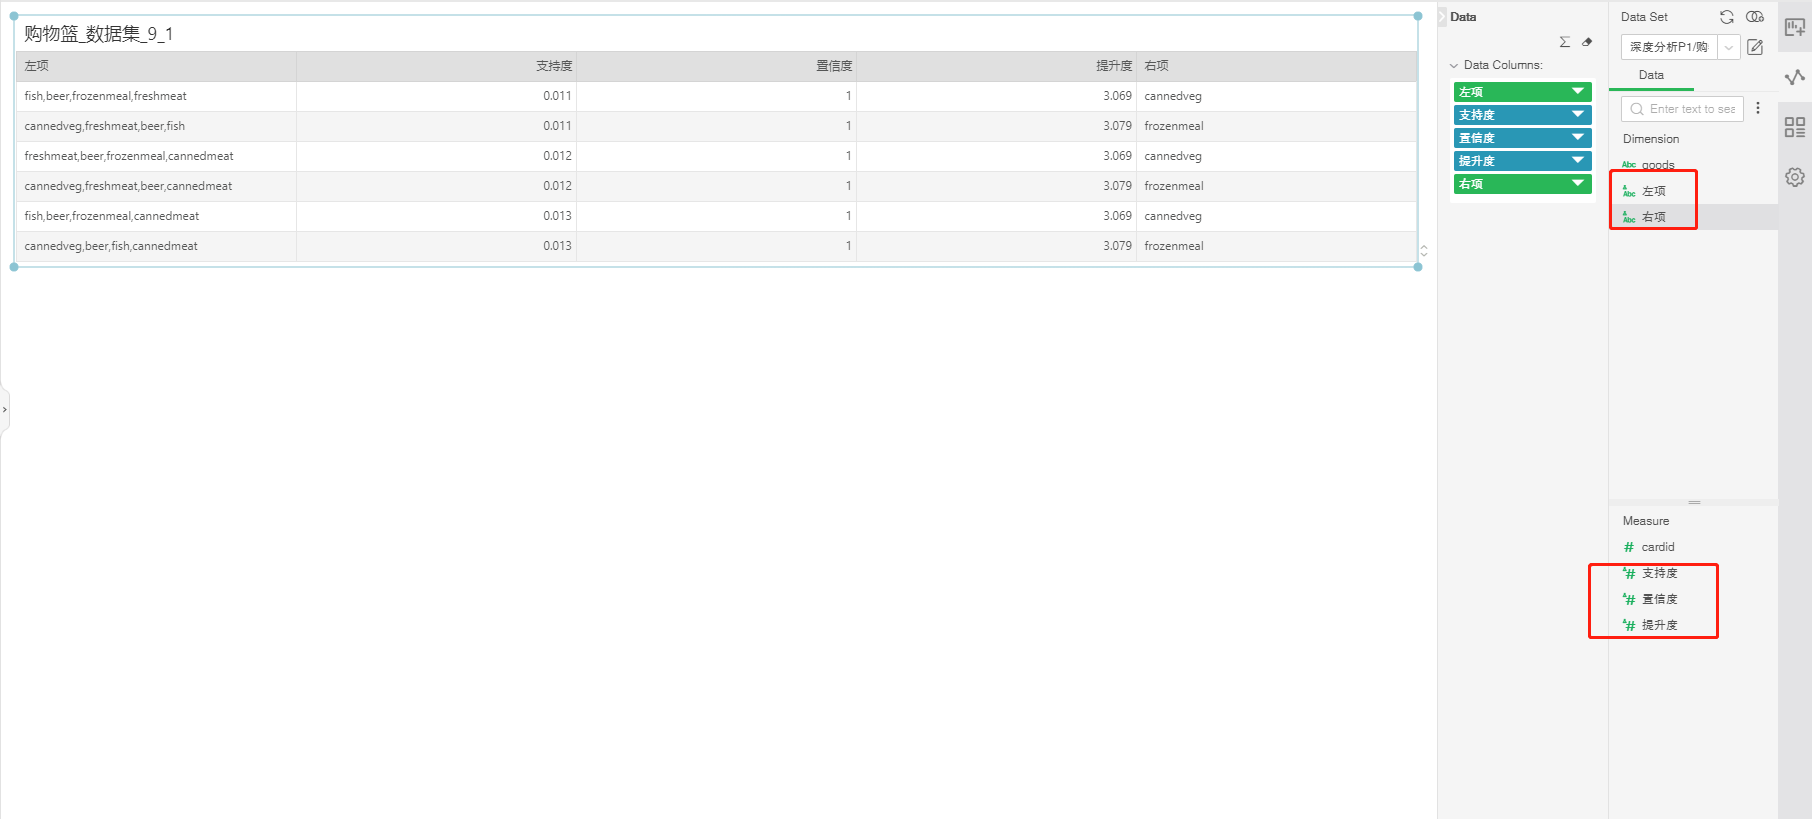
After the application experiment is completed, the column in the experiment result will be generated on the right. Used to create dashboard.

The whole process realizes the in-depth analysis experiment of the production report module application.