|
<< Click to Display Table of Contents >> Sales Analysis Sample |
  
|
|
<< Click to Display Table of Contents >> Sales Analysis Sample |
|
This section takes sales analysis of a large chain coffee shop as an example to guide you to build a visual report of profit analysis and discover the value hidden in the data and gradually increase the company's performance. By reading this section, you will learn how to connect to your data using Yonghong Z-Suite, build and present your dashboard, complete a profit analysis report, and how to share and view your report.
❖Scenario
Assuming you are an employee of a large chain coffee shop, you need to report the profitability of products to your superior. When analyzing profit data, you find that some products appear to have higher profits than others, while profits in some areas do not meet expectations. You want to be able to more clearly present the differences and changes in profits across all regions of the product, determine the factors that affect profitability, and then share your findings with managers and team members. In this way, the team can take appropriate actions based on your research results to improve the company's profitability in a targeted manner.
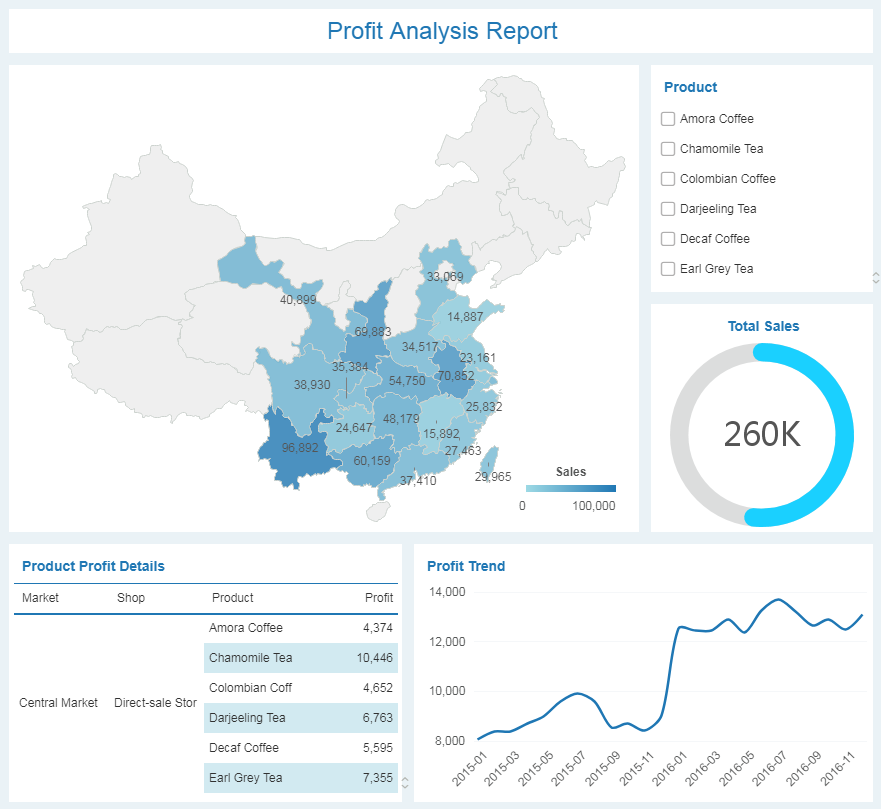
With Yonghong Z-Suite, you will build a product profit map, a trend of product profit trend, a profit schedule by markets, stores, and products, and finally get a profit analysis dashboard as shown below. You can save your analysis report to your local computer, or send it to the manager and other team members via email.
Decision makers can use Yonghong Z-Suite to view the profitability of any product in any market at any point in time, explore the hidden value behind the data, and make more targeted and effective decisions.