|
<< Click to Display Table of Contents >> Audit Overview |
  
|
|
<< Click to Display Table of Contents >> Audit Overview |
|
It is mainly used to grasp the global system information, mainly including System Metrics, Run Data Set During 24 hours, Data Set Type Distribution, Data Set Run Time Top10, Dashboard Visits Top 10, Schedule Task Type Distribution, Schedule Task Failure Top 10 LastWeek and Data Mart Node State. Users can click the hyperlink of each sub-module to skip to the target dashboard for detailed information. Enter the Audit interface to open the Audit Overview dashboard by default.
❖System Metrics
System Metrics are as shown in the figure:
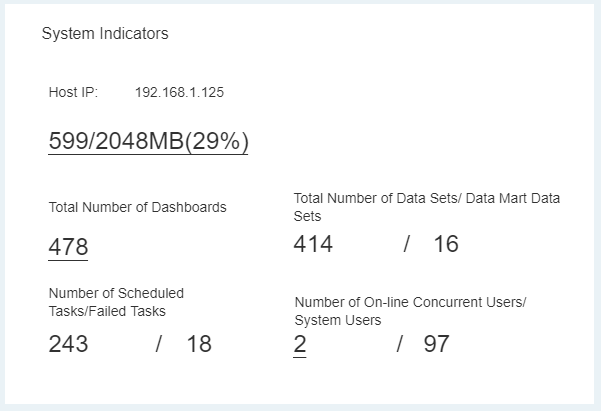
Memory Occupation: To check the memory usage and total memory of current node.Click specific data to skip to "Memory Information Statistics";
Dashboard Count: To count total number of dashboard in system. Click specific data to skip to "The Dashboard Depends on Data Set Information Statistics";
Data Set Count/Data Mart Data Set Count:To count total number of common data sets and data mart data sets in system;
Schedule Task Count/Failure Count: To count total number of schedule jobs and failure jobs;
Concurrency User Count/Users Total Count: To count the number of online concurrent users and the total number of users in the system. Click specific data to skip to "The User Login Information Statistics".
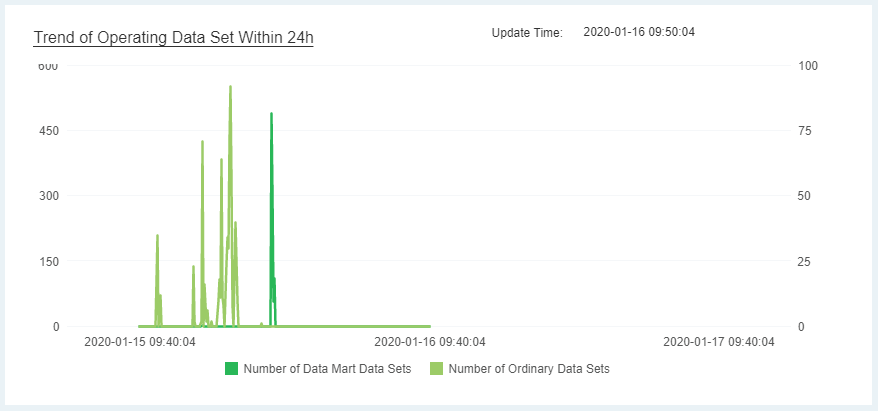
❖Run Data Set During 24 Hours
Make statistics of the trend of run data set within 24 hours.We can view the peak number of concurrent data set at certain time point thus to determine whether to avoid the concurrency peak and adjust the running time of other tasks. Click the title to skip to "Dashboard、Data Set、Data Mart Data Set".
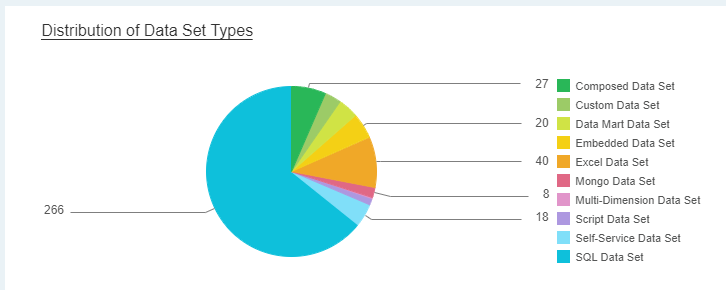
❖Data Set Type Distribution
Display the number of different types of data sets in the system in the form of pie charts. Click the title to skip to "The Dashboard Depends On Data Set Information Statistics".
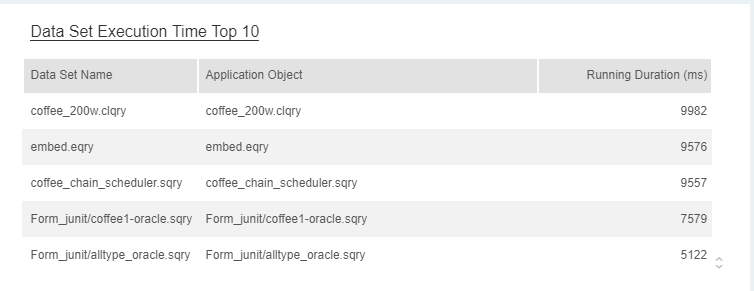
❖Data Set Run Time Top10
Make statistics of the 10 records with the longest execution time of the data set so that the user can understand which data sets are executed slowly in the system for further analysis. Click the title to skip to "Run Resource Information Monitoring Statistics".
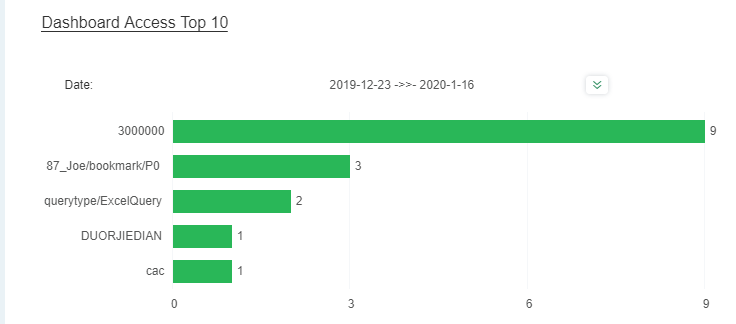
❖Dashboard Visits Top10
Count dashboards of top 10 access times in system. Click the title to skip to"The Dashboard Access Information Monitoring".
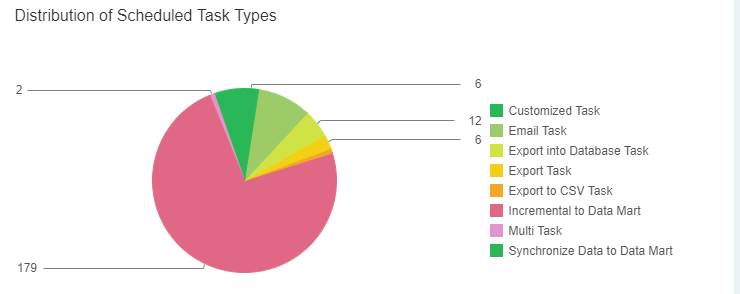
❖Schedule Task Type Distribution
Count the number of different types of jobs. Display in the form of pie chart more intuitively.
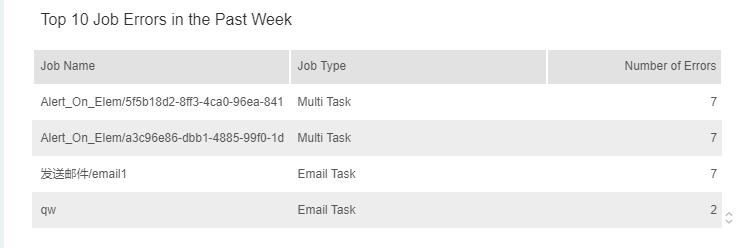
❖Schedule Task Failure Top10 Last Week
Make statistics of the job failure number in the recent week and display Top 10 records.
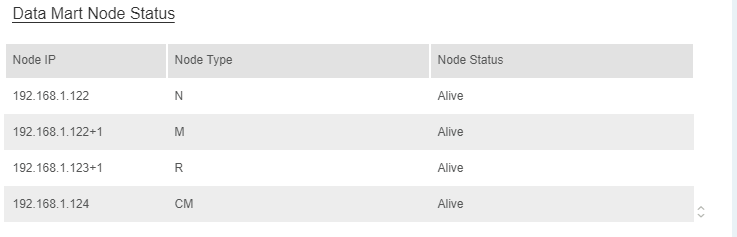
❖Data Mart Node State
Display the type and state of each node in the mart. For machines individually taking as node C, Data Mart Node State only shows the state of node C. Click the title to skip to "Data Mart Node Information Statistics".