|
<< Click to Display Table of Contents >> Product Running State Monitoring |
  
|
|
<< Click to Display Table of Contents >> Product Running State Monitoring |
  
|
Through the dashboard Product Running State Monitoring, users can monitor disk remaining space, data transfer information between nodes, slow query information, thread pool information, data set data cache and warning of system configuration information, to provide reference for improving system stability and system optimization. All the information collected is in memory.
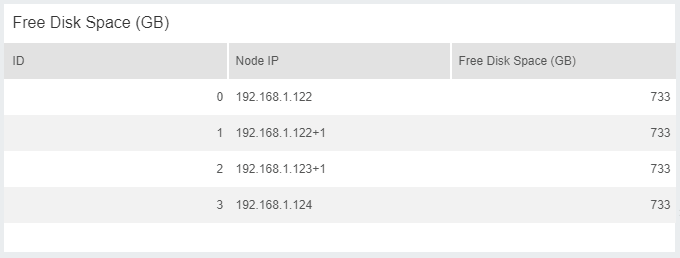
1) The table Disk Remaining Space mainly counts the remaining amount of disk(GB) for each node in the cluster.

2)The table IOHandler collects the average readRate and writeRate every 5 minutes. As shown in the following table:

3)The following table is used to monitor the information of slow query in the system, and collect the records about slow query whose running time is greater than 10s.

4)The table ThreadPool Information is used to collect execution information, including: number of idle threads,number of pending threads, number of total threads and number of running threads. As shown in the following table:

5)The table GRLink is used to monitor the information of cache and make statistics of memory consumption for each node in the cluster, the number of cached objects, the number of objects exchanged, the rate of exchange, the total bytes of exchange, and the rate of bytes exchanged. As shown in the following table:

6)The following table is mainly used to monitor the reasonableness of the configuration parameters. Warning information will be given when the CPU and license do not match.
