|
<< Click to Display Table of Contents >> Correlation Analysis |
  
|
|
<< Click to Display Table of Contents >> Correlation Analysis |
  
|
Correlation Analysis is a statistical method which studies whether there is any dependency between phenomena, discusses the relevant direction and correlation degree of concrete and dependent phenomena, and studies the correlation among random variables.
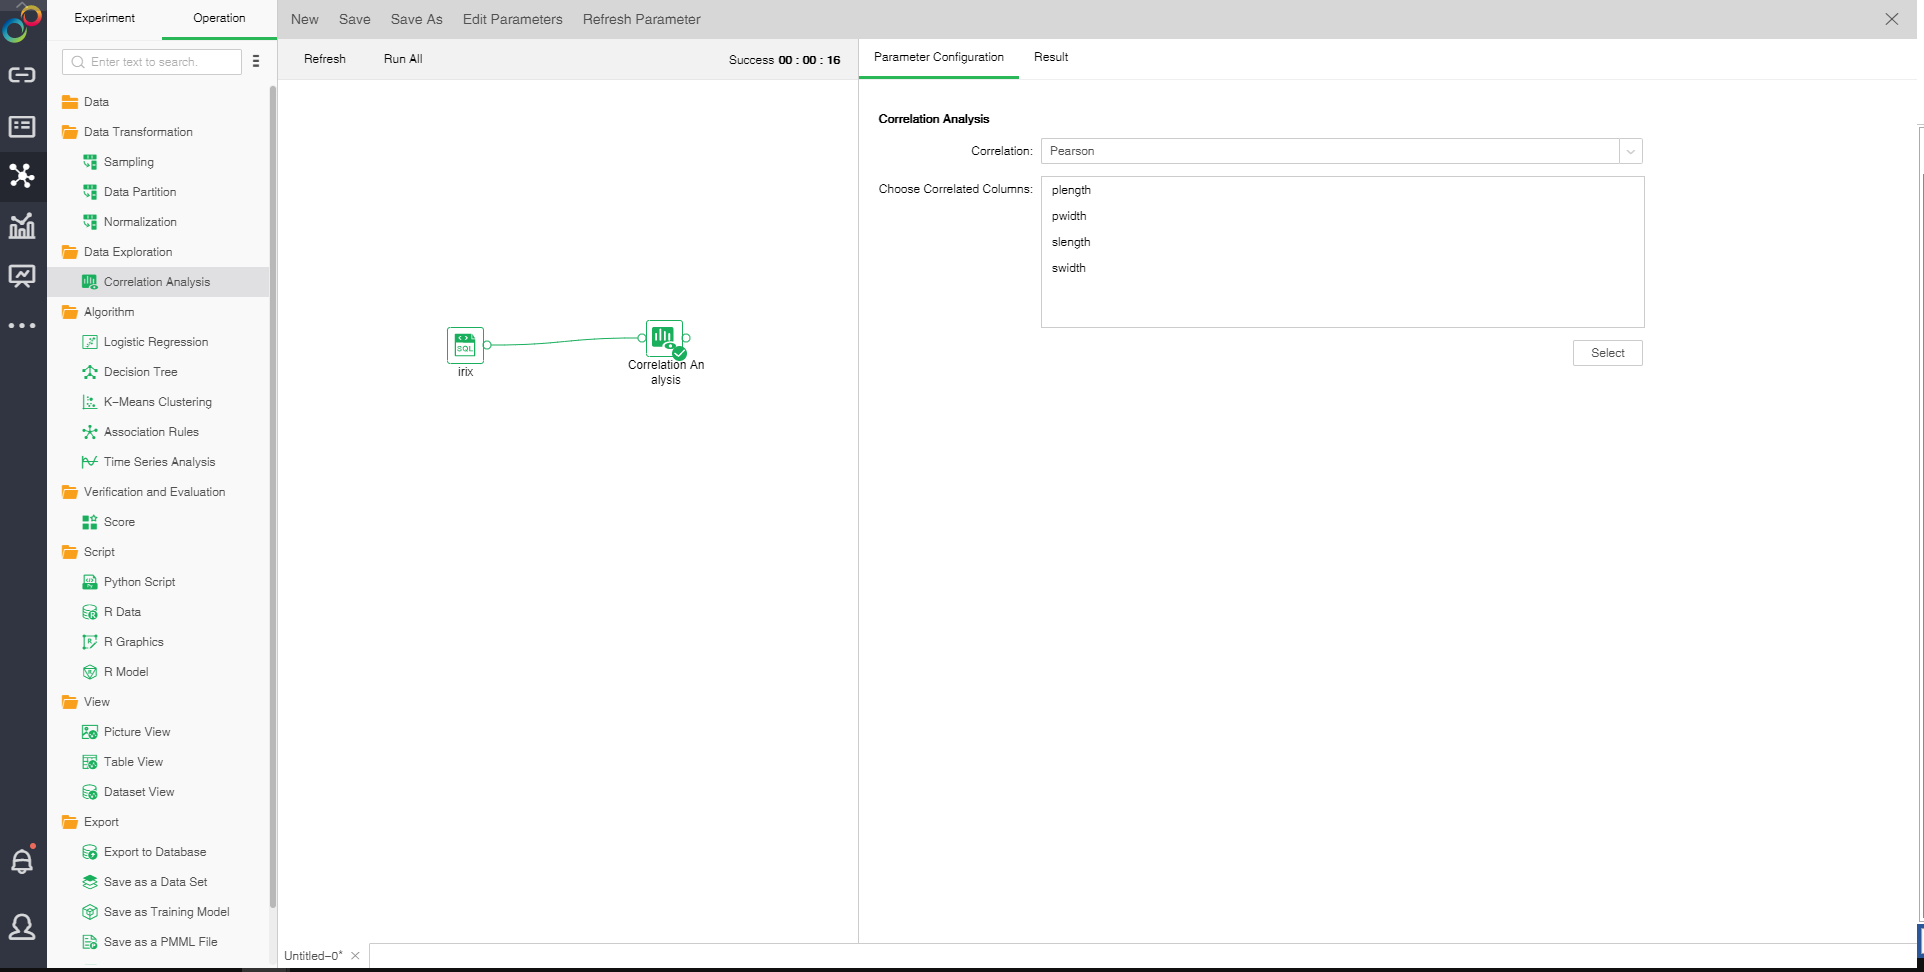
Drag a data set and a Correlation Analysis node to the edit area. Connect the data set and Correlation Analysis node.

❖Correlation Analysis configuration method
Selected Correlation Analysis node setting and display area contain two pages: Parameter Configuration and Result.
[Correlation] There are three types of correlation coefficients: Pearson, Kendall and Spearman.
•Pearson correlation coefficient is to measure whether two data sets are on the same line. It is to measure the linear relationship between controlled interval variables.
•Kendall coefficient is to sort n statistical objects of the same type by specific attributes. Other attributes are usually in disorder. Ratio of the difference between concordant pairs and discordant pairs to total pairs (n*(n-1)/2).
•Spearman correlation coefficient is the statistics measuring the correlation degree between grading variables.
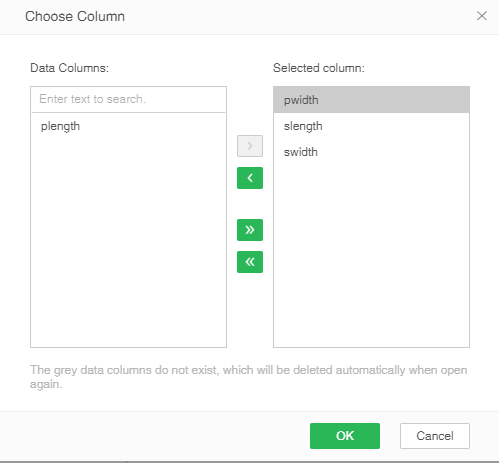
[Choose Correlated Column] Click the selection button to open the selected column dialog box. Drag the column from the left to the right to add association column.

❖Result display
The correlation between two variables is expressed by the correlation coefficient r. The value of correlation coefficient r can be any value in the range of -1 to 1. For positive correlation, r is between 0 and 1 For negative correlation, r is between -1 and 0. The closer the absolute value of r is to 1, the two variables are more associated with each other. The closer the absolute value of r is to 0, the two variables are less associated with each other.
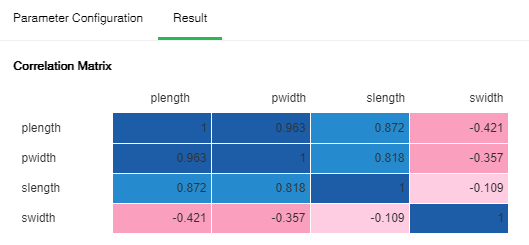
The results of Correlation Analysis are presented in matrix form. As shown in the figure below, blue indicates positive correlation and pink indicates negative correlation. The darker the color, the stronger correlation will be.

➢Note: The size of correlation coefficient indicates that: |r|>0.95 significantly correlated; |r|??.8 highly correlated; 0.5≤|r|<0.8 moderately correlated; 0.3≤|r|<0.5 lowly correlated; |r|<0.3 extremely low correlation which is deemed as non-correlated
❖Correlation Analysis node rename
In the right-click menu of Correlation Analysis, select "Rename" to rename the node.
❖Delete the related analysis node
In the right key menu of the related analysis node, select "Delete" or click the keyboard delete key to delete. It can delete the node and the input and output connection of the node.
❖Refresh the related analysis node
In the right-click menu of Correlation Analysis, select "Refresh" to update synchronous data or parameter information.