|
<< Click to Display Table of Contents >> Stacked Bar Chart&3D Stacked Bar Chart |
  
|
|
<< Click to Display Table of Contents >> Stacked Bar Chart&3D Stacked Bar Chart |
  
|
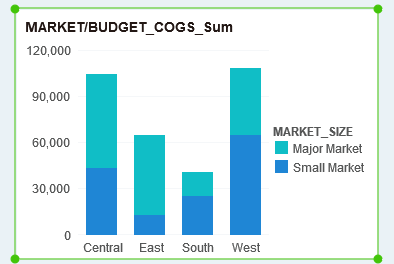
The stacked bar chart shows the relationship of the individual items to the population and compares the percentages of each value to the population across categories. The stacked bar chart uses two-dimensional vertical stacked rectangles to display the values. Stacked histograms can be used when there are multiple data series and you want to emphasize the total value.

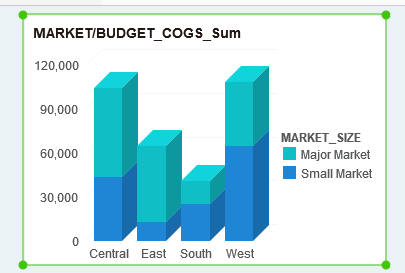
The 3D Bar chart uses 3D perspective effects to display data.
