|
<< Click to Display Table of Contents >> Yonghong Z-Suite V7.5 |
  
|
|
<< Click to Display Table of Contents >> Yonghong Z-Suite V7.5 |
|
❖New Key Features
1. Self-Service Data Preparation
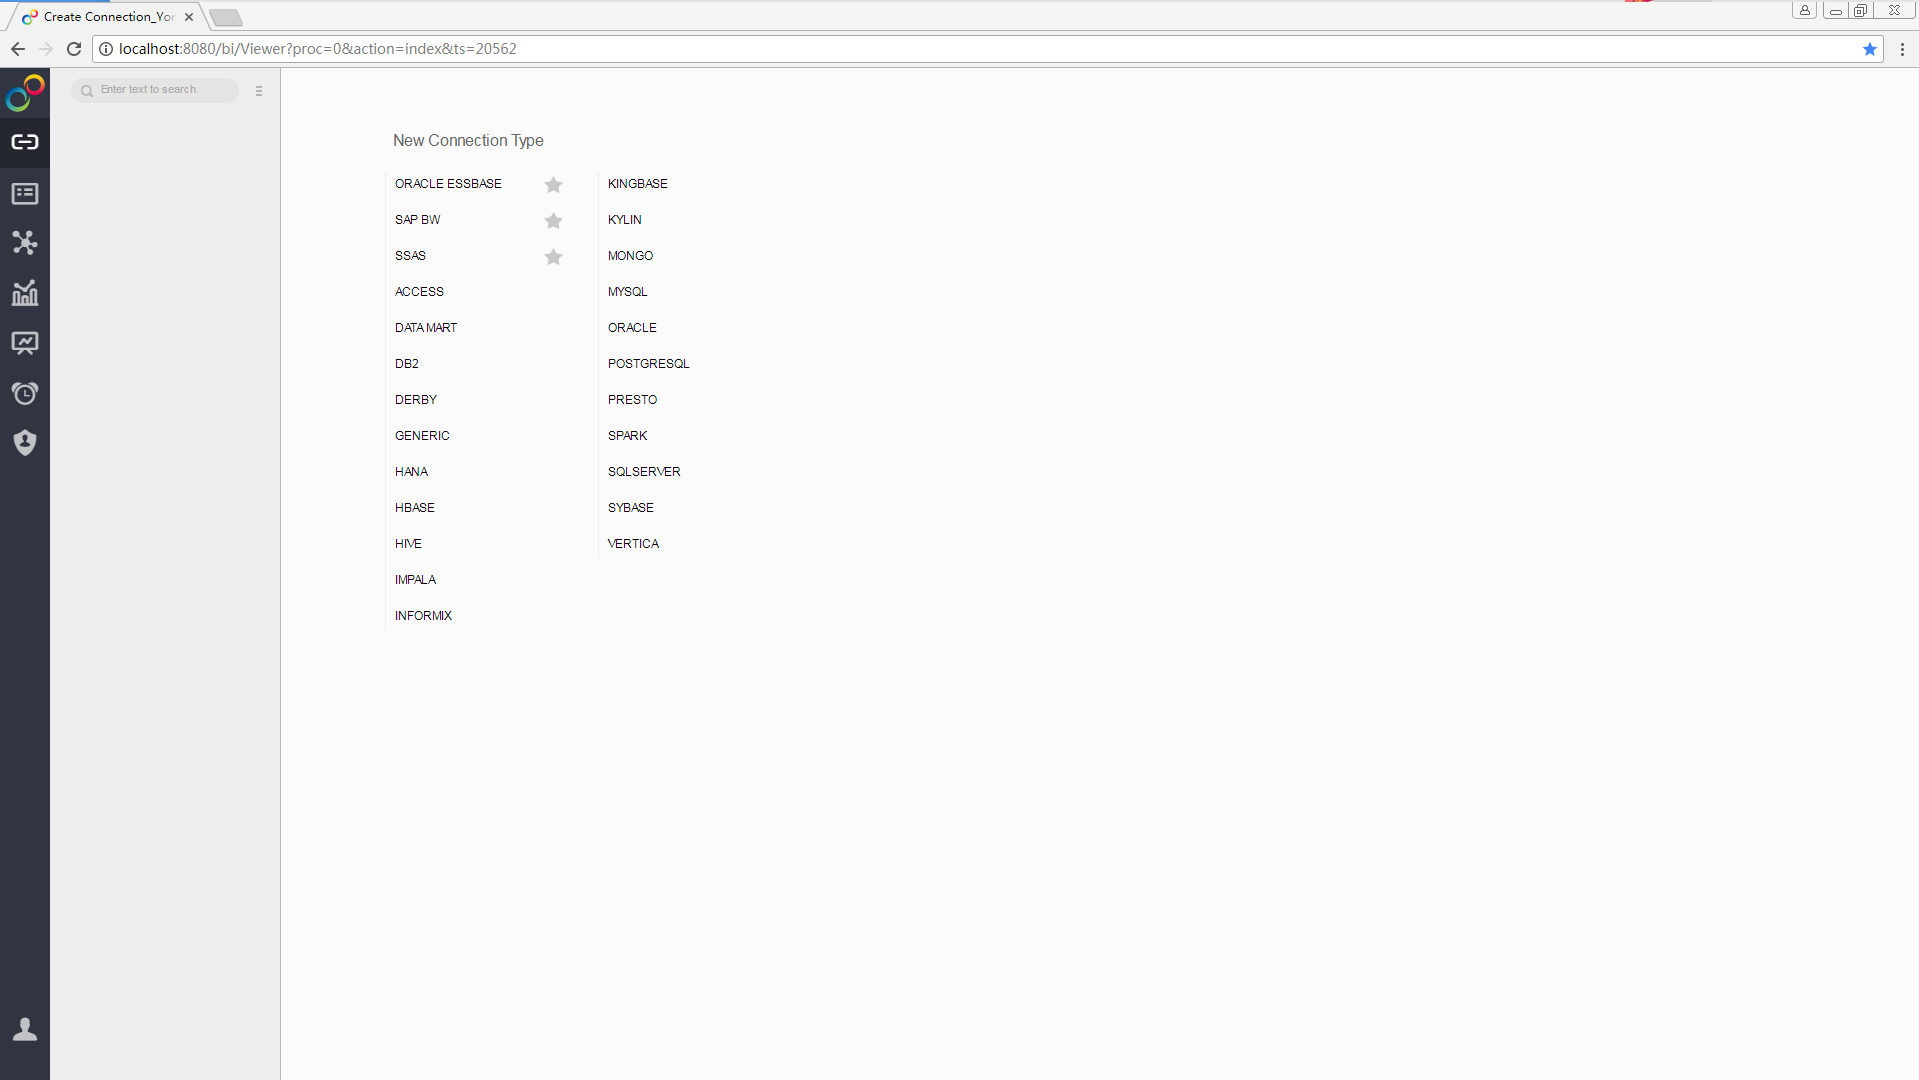
Addition of Multi-Dimensional Data Source (SAP BW、Oracle Essbase、SSAS) and Kylin Data Source
Yonghong's data sources has been further expanded with the addition of multi-dimensional data source, including Oracle Essbase, SAP BW, and SSAS, and the addition of Kylin data source, which expands the database docking capability and further meets the user's need for connecting different data sources.
▪The new Oracle Essbase, SAP BW, and SSAS multidimensional data sources support users to directly use the data in the multidimensional data source or MDX data set to make dashboards.
▪The new Kylin data source allows users to connect directly to their own Kylin database and use the data in the Kylin database to create data sets and make dashboards.
Note: The data source, data access mechanism, right-click operation menu, and usage mode of the multidimensional data source are not the same as the relational database. For details, please refer to the product manual.
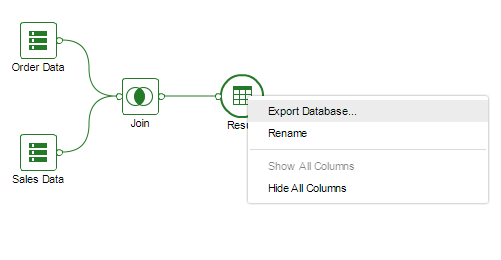
Convenient Addition of Schedule Task to Import Data into Database
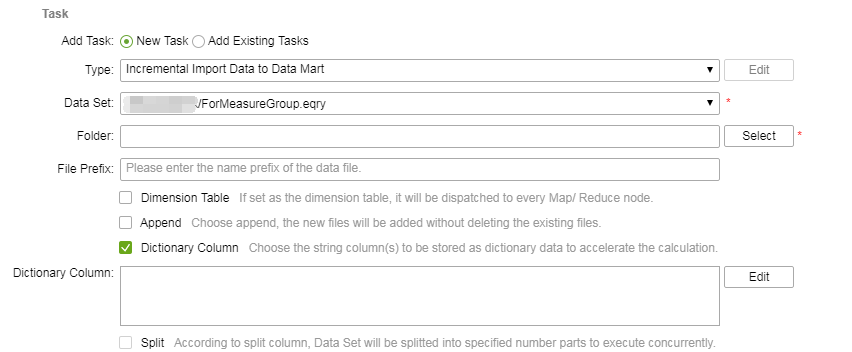
The data filling process is closer to the user's reality, making the import of data to database more quickly and easily. Yonghong self-service data set allows the user to import the incremental/total data to the database on a single or scheduled basis by data import scheduled task. All the operations for data import can be completed on the self-service data set interface. It is no longer necessary to jump to the schedule task module to add new tasks.
The management of the scheduled task can be performed through the schedule task module, where the administrator can check and edit the newly created data import task in the self-service data set interface.
Strict Permission Control to Ensure Data Security
More granular data access control and stronger control measures strictly limit the user to read and write data within their own authority, so as to ensure data security.
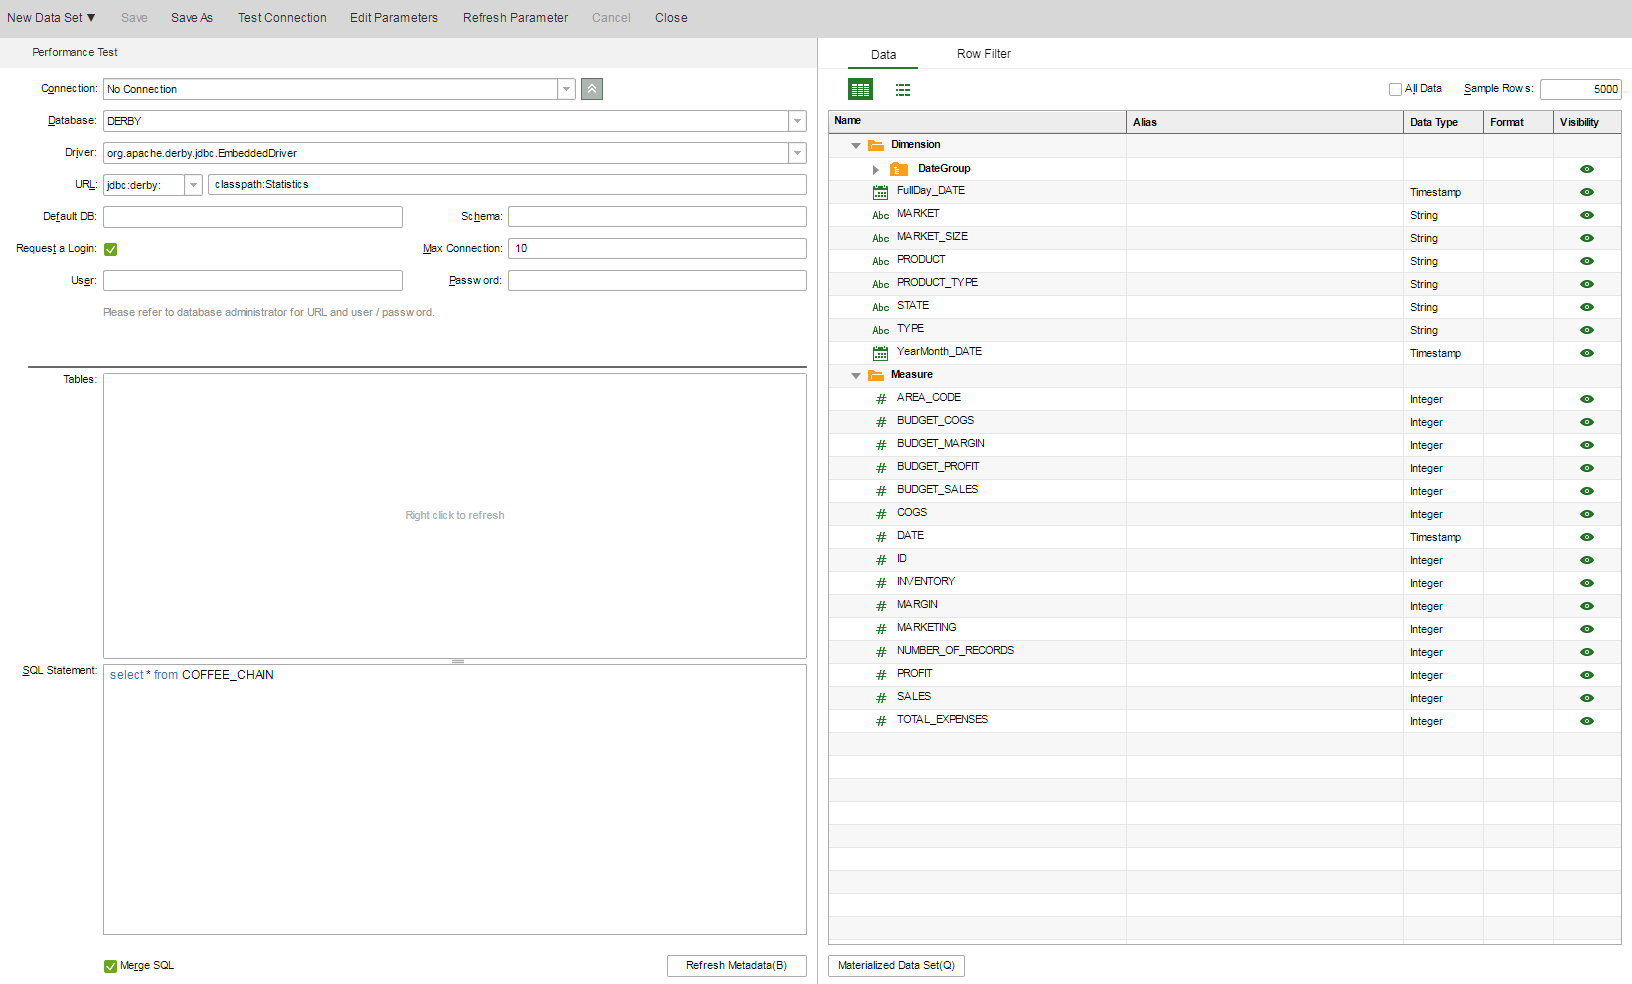
Stronger control of read permission for data set: When a user has read permission on a data set, the user can neither edit statements, scripts, excel worksheets nor use Filters, materialize data sets, refresh metadata, save the data set.
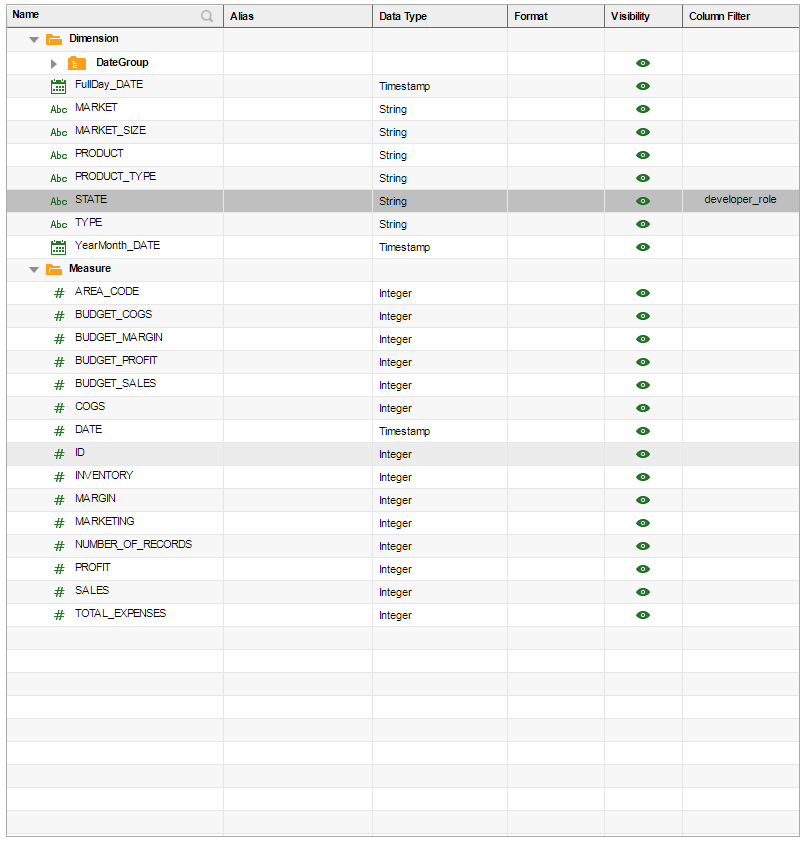
More stringent control of column permission: When the administrator through column filter sets a column hidden from a user, then the user can not see the column in the metadata, but also can not use the column to make a dashboard. In the composed data set, if the user has no read permission on the join column, the system reports an error and the user has no right to view the join table; if the user has read permission on the join column and does not have read permission on a non-join column, he can view the join table, but can't see data without read permission.
2. Dashboard
Column Filtering and Position Swapping Facilitating Flexible Analysis
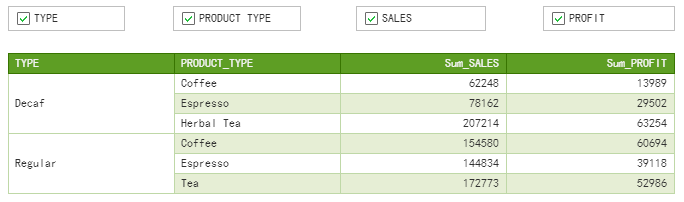
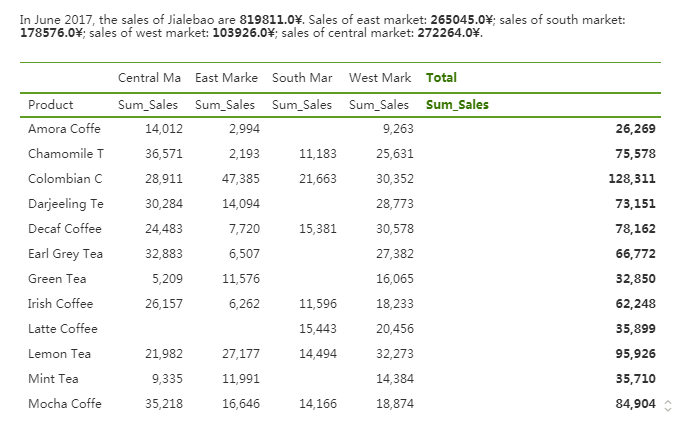
The column filtering and column position swapping functions enable the dynamic display of tabular data and increase the flexibility of viewing dashboards.
The column filtering feature of the table facilitates switching between different dimensions and makes viewing dashboards more flexible. Usually the viewer can only view the data in the dimensions bounded by the dashboard editor. For example, when a profit data is shown in the market and product dimensions, users can only see aggregated data for a product in a certain market. However, with column filtering, users can view any dimension data. The column filtering function not only allows the same user to freely select the display dimension of the data, but also enables different users to see data of different dimensions when viewing the same table, which greatly increases the flexibility of viewing the dashboard.
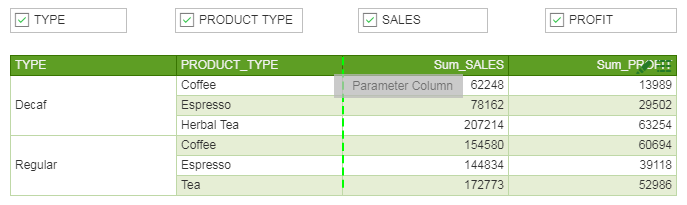
The column position swapping function of the table supports the user to freely change the position of columns and compose different table forms to perform data analysis. Often, the order in which the columns are bound determines how the viewer views the tabular data. For example, when the profit data are displayed in the market and product dimensions, then users can only look at the profitability of each product in a certain market. If you want to check the profitability of a product in each market, it is very inconvenient. Nowadays, configure “Bind Data” to “View Actions” for the table and drag and drop the mouse to change the column position, then you can view the data in different forms.
Browsing Table Data in Pages
When the table carries more than 10,000 lines of data, the paging function allows the user to browse the data easily and accurately. The paging function divides all the table data into multiple pages for display, and clicks the previous page and the next page at the bottom of the table component to realize page switching and browse the data of different pages. The paging function solves the problem of inaccurate positioning of data through the scroll bar when the amount of data is too large. After the table is paged, you can either output only the first page or output the table completely.
In order to meet the different data needs of different users, Yonghong supports the custom configuration of the table paging function. By default, the system does not enable table paging. The user can decide whether to use the table paging function and how many rows of data are displayed per page. The default state of the paging function and the default number of rows can be configured separately.

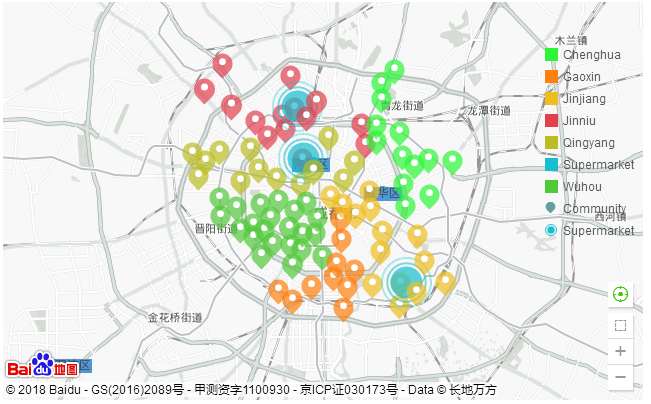
Introducing GIS Map to Achieving Location-Related Analysis
The new version introduces the third-party GIS map to display relevant data on geographic map in a clear and intuitive manner, enabling analysis, processing, decision-making and other functions related to GIS map. GIS map shows more detailed street-level geographic information, not only satisfying map operations for example zooming in and out, but also supporting binding data, switching rendering effects, changing marks, and interacting with data from the same data set to achieve geographic location-related analysis.
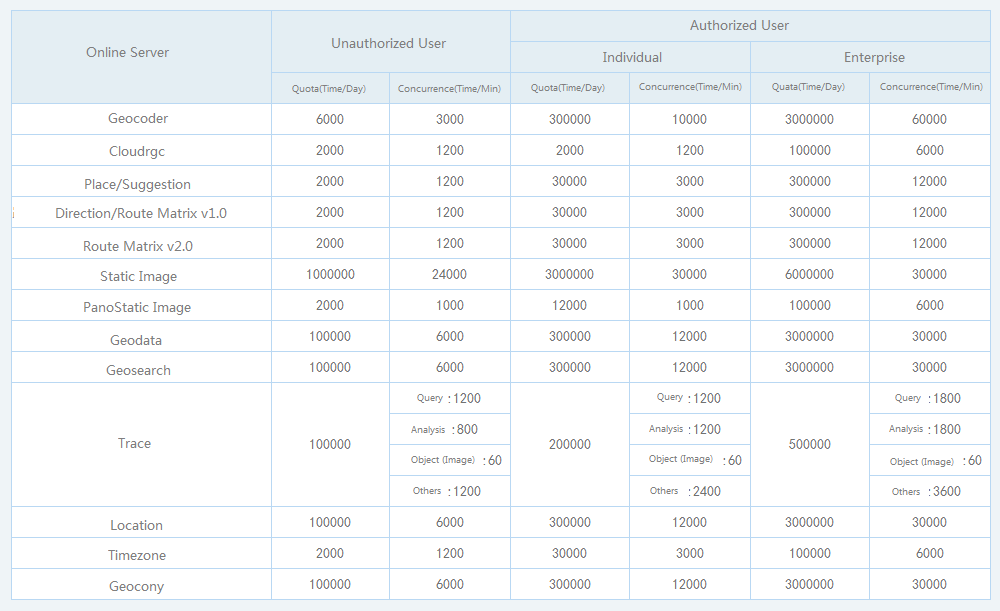
The product is temporarily available for trial of GIS map. In order to ensure the normal and legal use of GIS function, please go to the "Baidu Maps Development Platform" -> "I want to authenticate" (http://lbsyun.baidu.com/apiconsole/auth), and follow the operating instructions on the page to apply for certification, and then configure the parameter chart.baidu.ak as the authentication key in bi.properties in the product installation directory.
For the third-party GIS map, the differences between the available functions of authenticated users and non-authenticated users, please refer to the comparison materials provided by Baidu Maps Developer Platform.
! Note: If the user does not apply for a valid key, any legal issues arising during the use of the GIS map will be borne by the user.
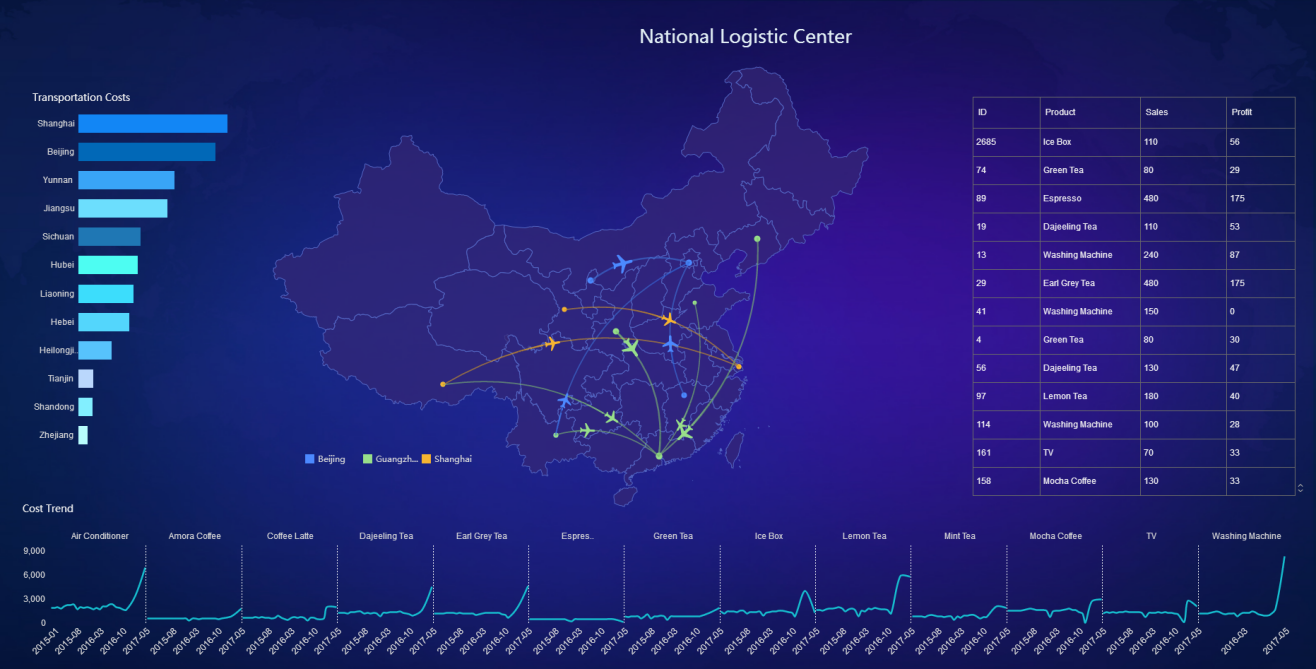
Migration Map Dynamically Showing Trajectory of Object
The migration map dynamically shows the changing trajectory of the object, which not only brings a more stylish map display effect, but also makes the dashboard viewers aware of the motion of the object at a glance. The migration map dynamically and intuitively displays the migratory trajectory and reflects the different types and quantities of migrating objects. According to the actual business scenario, users can choose the appropriate styles, including ray, airplane, train, car, and truck, so as to achieve various migration animation effects. When a migration map is added to the dashboard, drilling, scaling, filtering, or brushing the data on other components will cause the migration map’s data interaction.
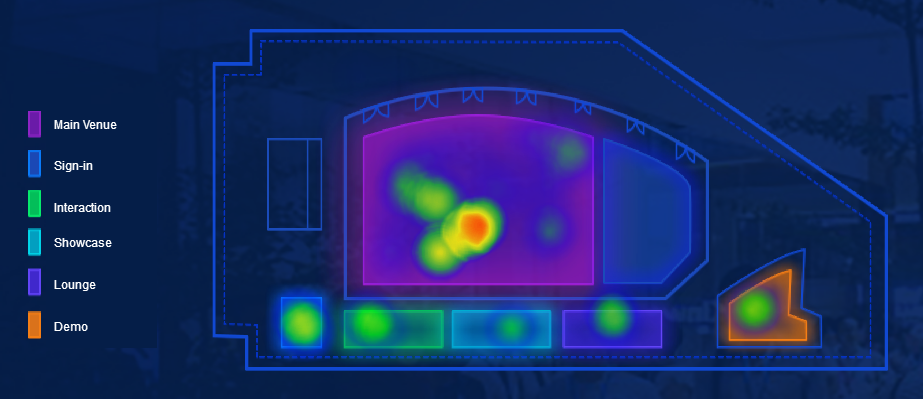
Powerful Heat Map Enabling Distribution and Density Analysis
Heat map simply aggregates large amounts of data and achieves elegant visualizations with progressive color zone, intuitively revealing the density of spatial data, or the frequency of some events. The introduction of heat map has enabled flow analysis, distribution analysis and density analysis. Users can use the normal map or GIS map to display the thermal effects. They can also use the custom base maps to achieve thermal effects at any location, such as traffic flow heat map, tourist flow heat map in a scenic spot, or customer flow heat map in a shopping mall.
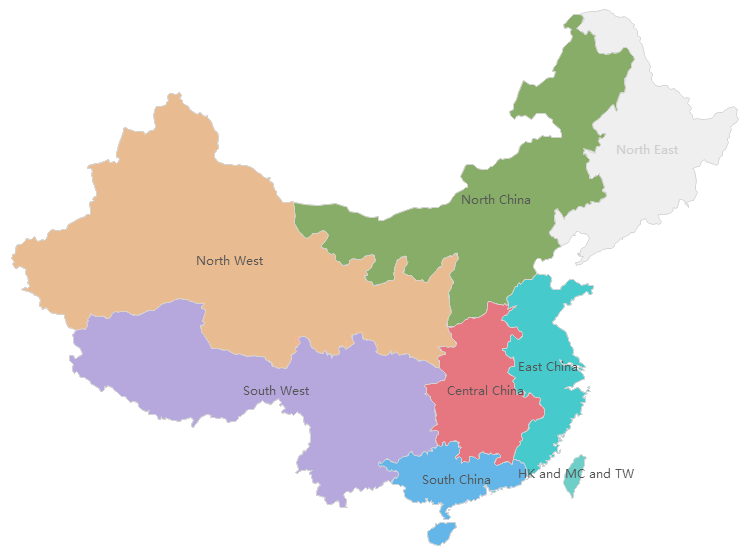
Freely Build Your Own Region to Display Data in Custom Way
The normal map adds a “region” hierarchy that allows users to freely merge areas into custom regions and analyzes data by custom regions. Users can merge geographical areas of the same level, modify and edit their own geographic regions, meet the actual needs of the business, and realize personalized display of geographic data.
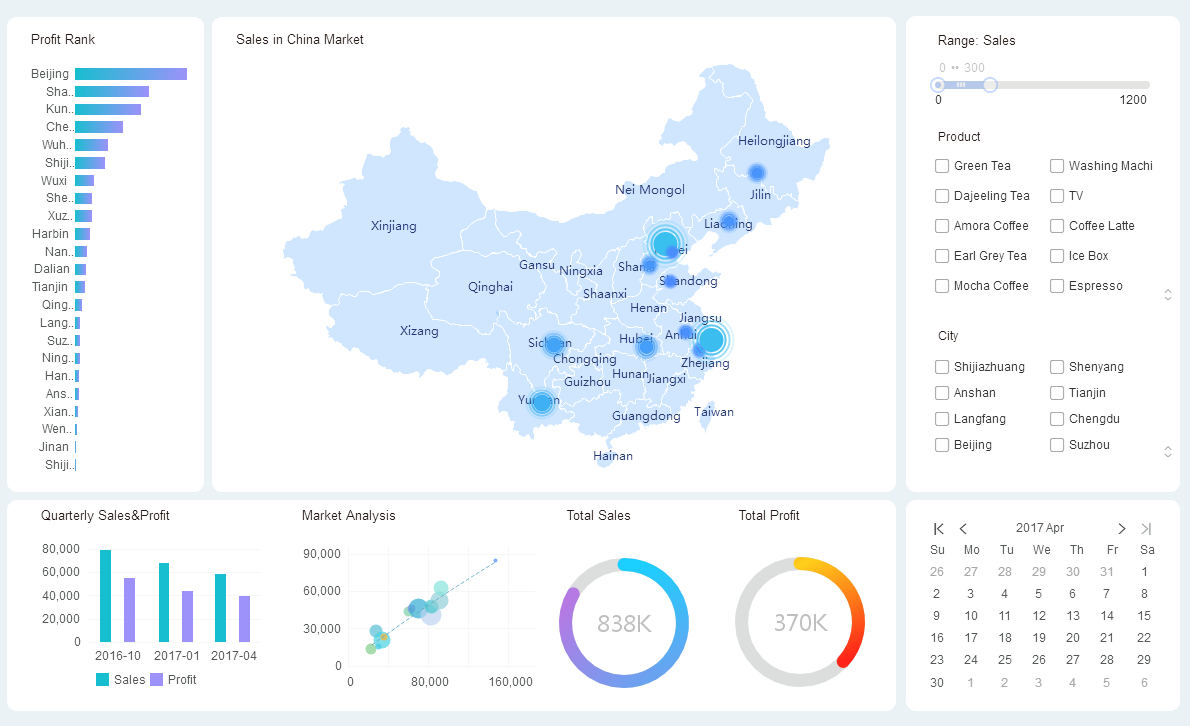
Dynamic Spot Making Vivid Map
The dynamic point effect of the map is dynamic and beautiful, breaking the rigid experience of the dashboard reading. Location markers on the map, processed through dynamic points, become more vivid and enhance the dashboard's visual experience.
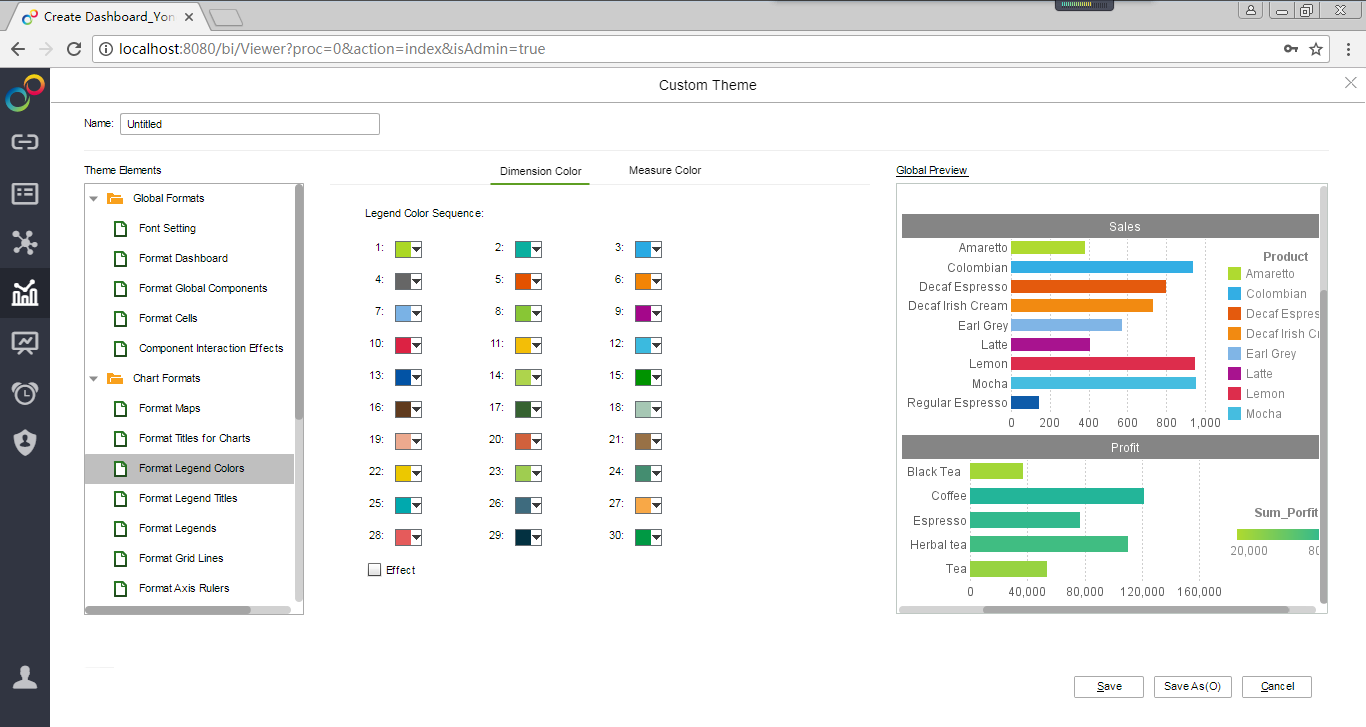
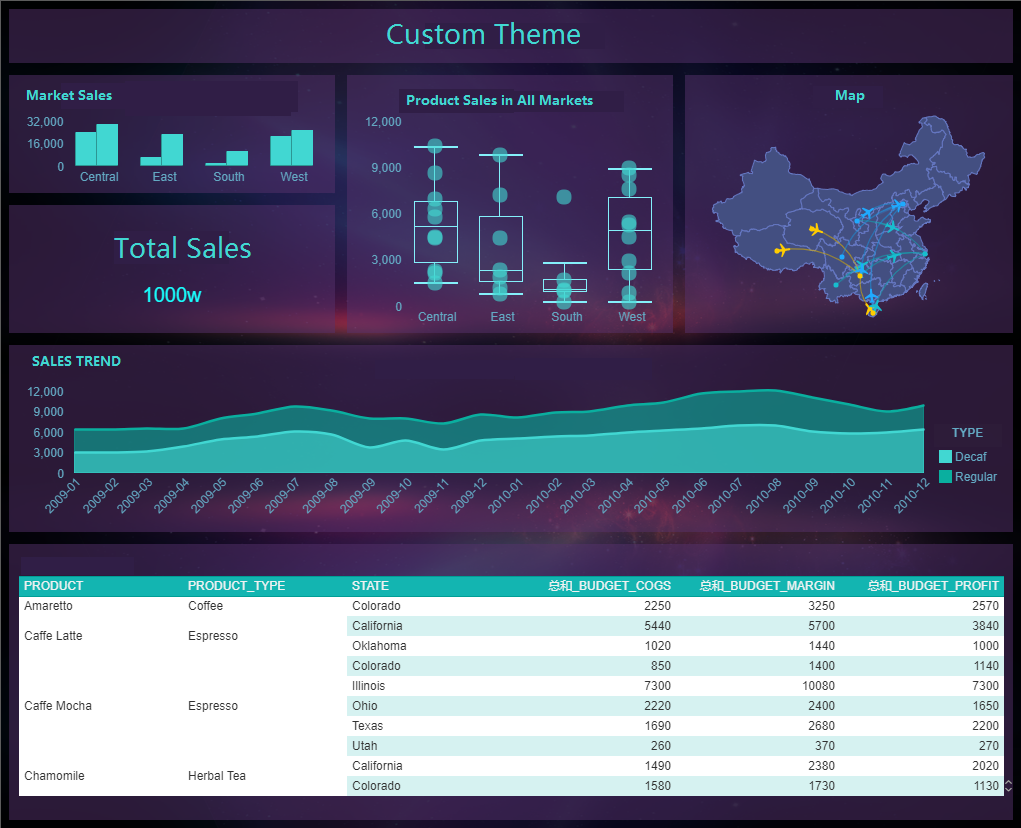
Custom Theme Displaying Dashboard in Personalized Style
Custom theme enables users to customize their own theme styles, making the dashboard style more personalized.
The user can either create a new theme or modify the system theme. Custom theme settings include: font format, dashboard format, component format, grid format, component interaction format, topic format (chart, table, pivot, freestyle, filters), legend default colors, grid line format, map format, table style.
Commonly used theme can be set as the default theme, so that making a dashboard does not need to repeat the selection of theme, to achieve more convenient dashboard style settings.
Different hosts can share custom themes and table styles. Through the import and export of resources, you can deploy and use the same custom theme on different hosts, eliminating the trouble of repeating the setting of the theme style, and also facilitating the unification of the dashboard style.
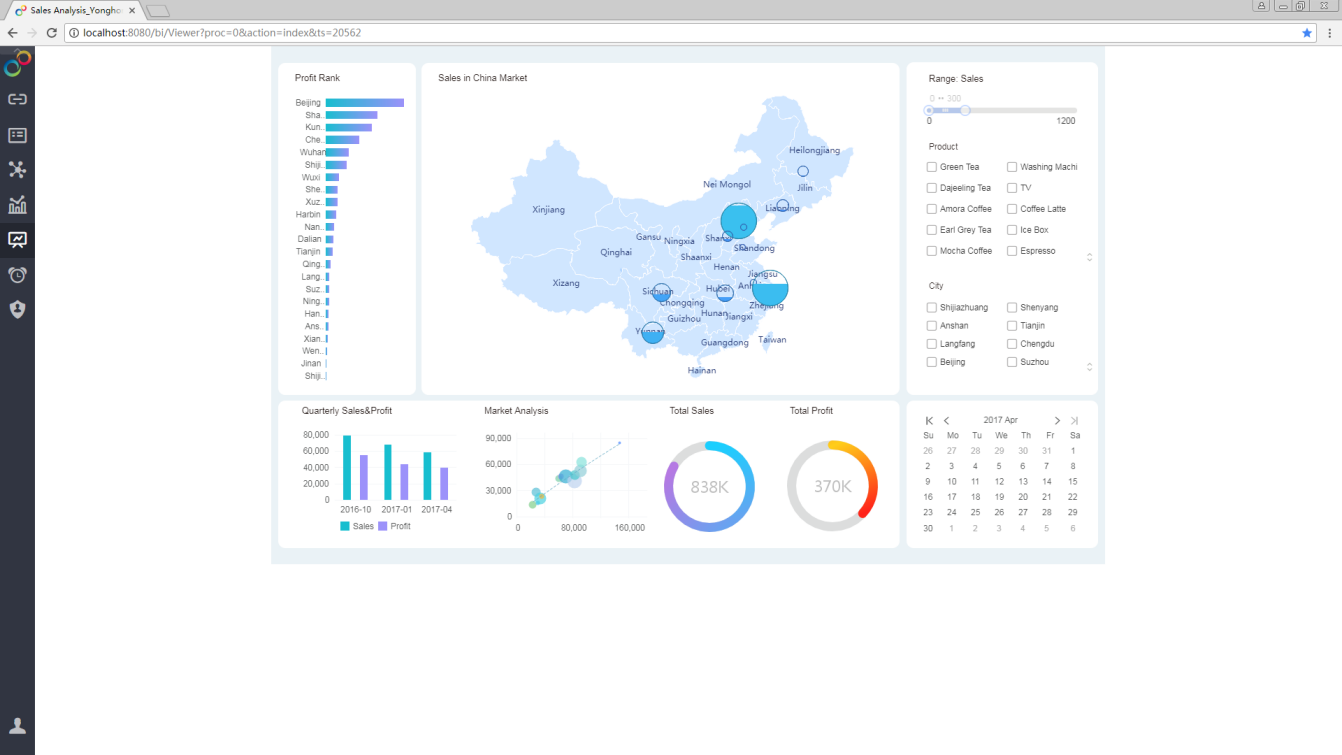
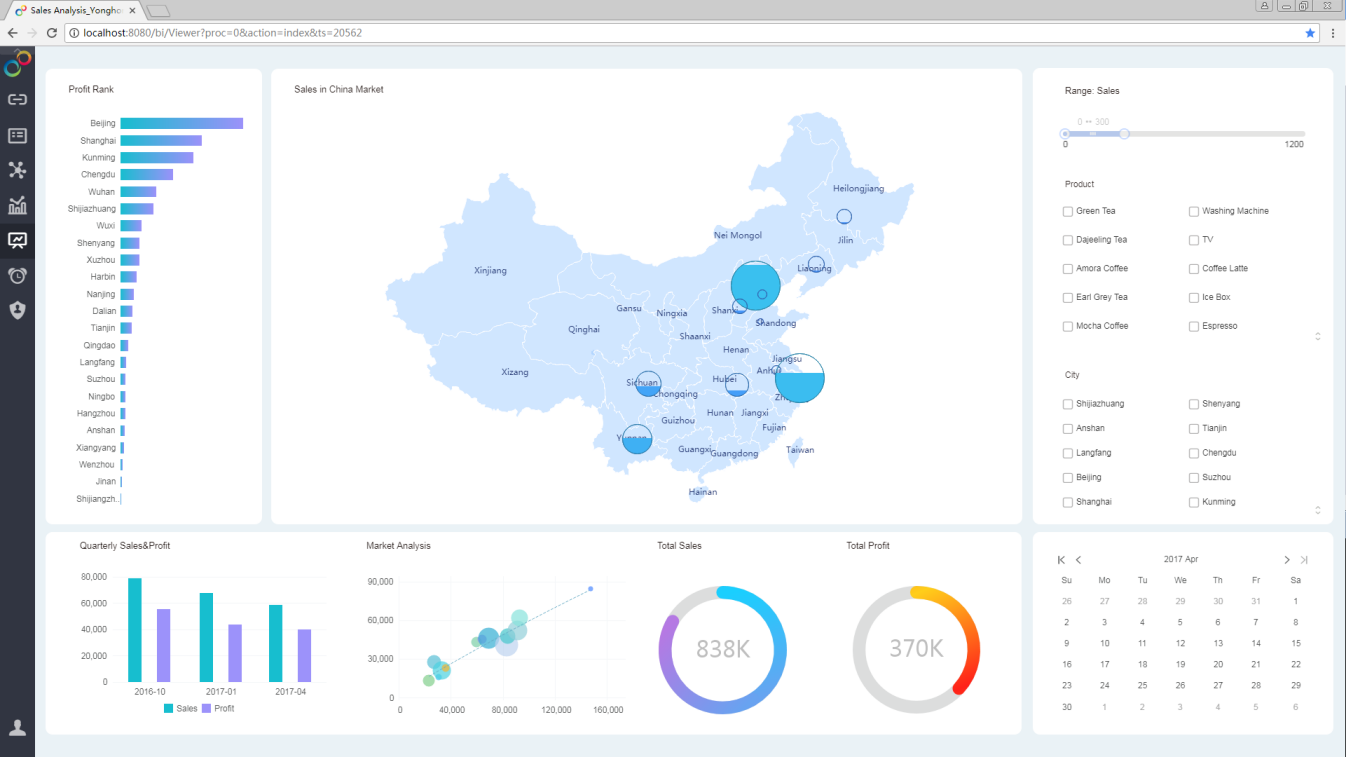
Stronger Self-Adaption Capability to Display Dashboard on Full Screen
To enable the dashboard to achieve the best display effect on different display screens, Yonghong provides full-screen self-adaption, making the dashboard's width and height adapt to the size of the screen browser. Users can set the adaptive type of dashboard according to their needs.
Box-And-Whisker Plot Helping Users to Learn Data Distribution
The box-and-whisker plots show the distribution of data, and are often used in statistical analysis such as quality management, personnel evaluation, and exploratory data analysis. This helps the analysis process to be simple and quick. Box-and-whisker plots rank a group of data from the largest to the smallest, and the maximum, the top quartile, the median, the lower quartile, and the minimum are calculated. Users can roughly see whether the data distribution is symmetrical, how the data are distributed and other informationm, especially useful for comparative analysis of several samples.
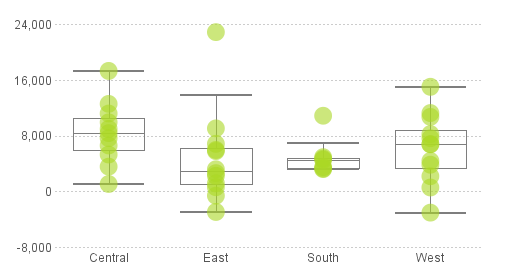
For example, it can be seen from the figure that the median profit of the products in the central market is the highest, the profit of one product in the eastern market is unusually high, and the profits of products in the southern market is closer.
Easy-to Use Rich Text Editing Realizing Format Settings and Data Update
The new version implements rich text editing of text boxes, supports more text editing needs for users, and optimizes the display of text content after export. Rich text editing not only implements basic format editing, including fonts, font size, bold, italics, underlining, color, alignment (left, right, etc.), but also allows the input of characters and parameters at the same time, achieving the dynamic change of data.
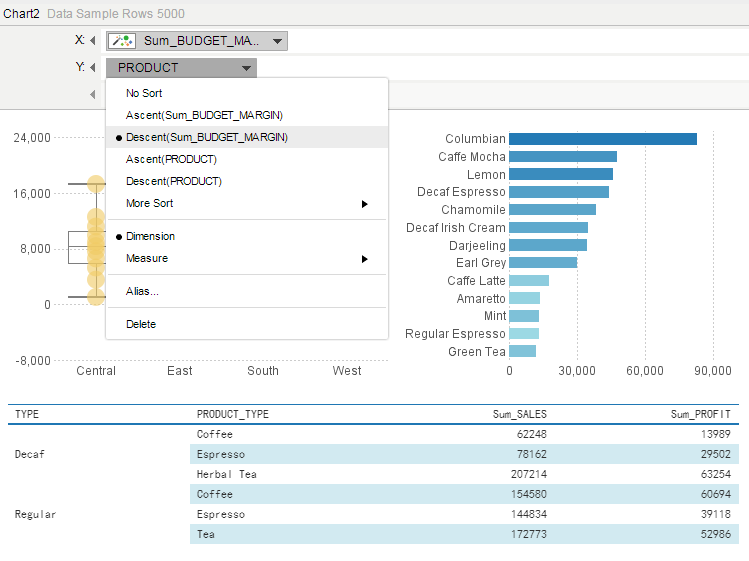
Optimized Sorting Method for Chart to Improve User Experience
The sorting method in the chart is optimized to improve the user experience in the sorting process.
•Dimension column supports more sorting methods. Users can sort not only by the alphabetical order of the dimensional data, but also by the data value of the first aggregated column.
•The sequential logic of TOP N ranking is optimized to cater to mainstream sorting methods, making it easy for users to make TOP N and BOTTOM N rankings.
•In combination with most user needs, the default value of advanced sorting is optimized to further enhance the user experience. After optimization, the default order of advanced sorting is ascending order, the sorting mode is aggregation column, the default column is the first column bound to the chart, and the aggregation mode is sum.
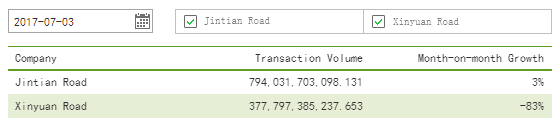
Custom Industry Calendar Serving Month-on-month Growth Calculation
The business days and days of rest of different institutions in different industries are not the same. When calculating the month-on-month or year-on-year growth, a unified calendar can not meet different requirements. By customizing the industry calendar, users can specify which days are business days and which days are days off. As long as the industry calendar is configured, the month-on-month growth calculation can be performed according to the data of the effective trading day, so that the calculation result is more in line with the actual business.
At the same time, Yonghong allows users to calculate the month-on-month or year-on-year growth based on the last day of the month or the last day of the year.
3. Enterprise Management
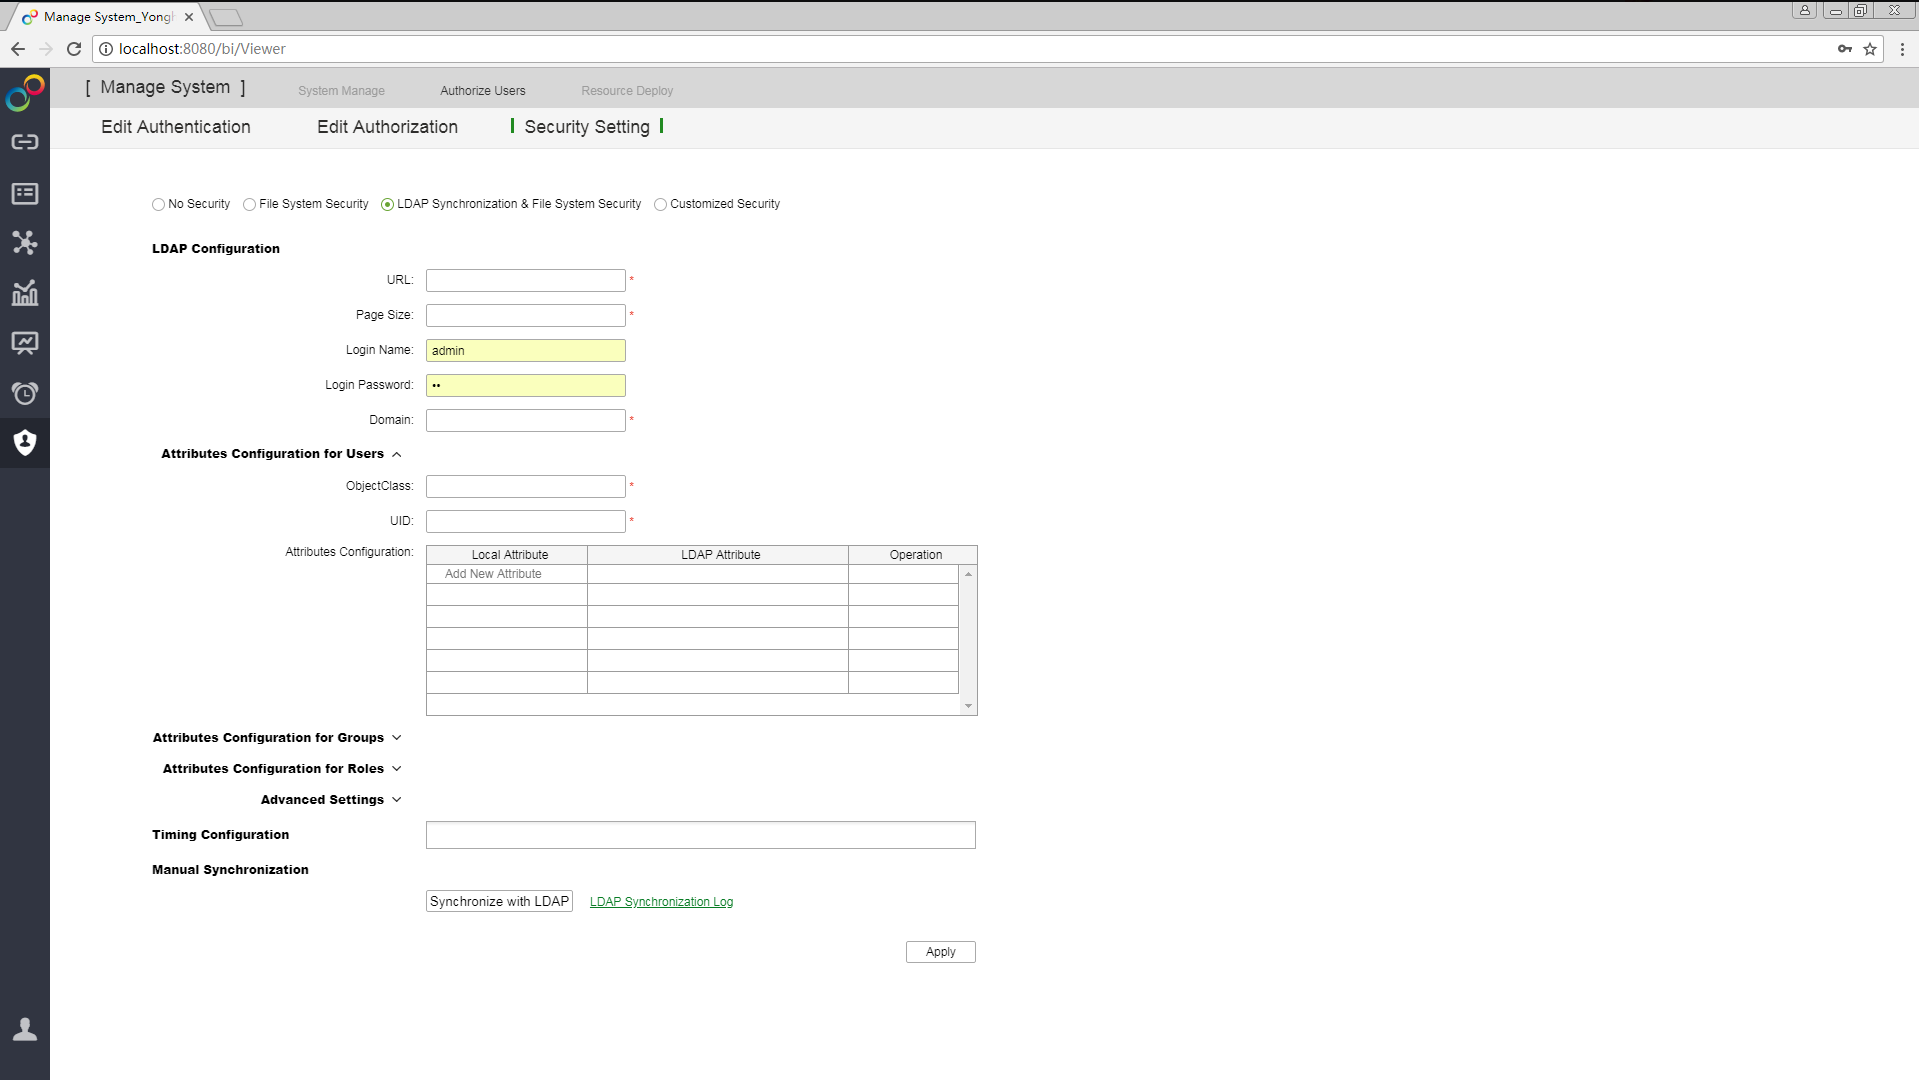
Integrating LDAP to Seamlessly Access Enterprise Identity Management System
Yonghong integrates the LDAP system to seamlessly access enterprise identity management systems and bring a more powerful authority management system. The new LDAP synchronization & file rights management system connects to the enterprise's LDAP system, periodically synchronizes user, group, and role data, and converts enterprise users into system users through the configured mapping relationships, facilitating the unified authentication.
Scheduled synchronization of user information eliminates the trouble of manually operation and facilitates efficient user rights management. At the same time, in order to avoid inconsistent data, administrators can manually synchronize user information to get the latest user rights information.
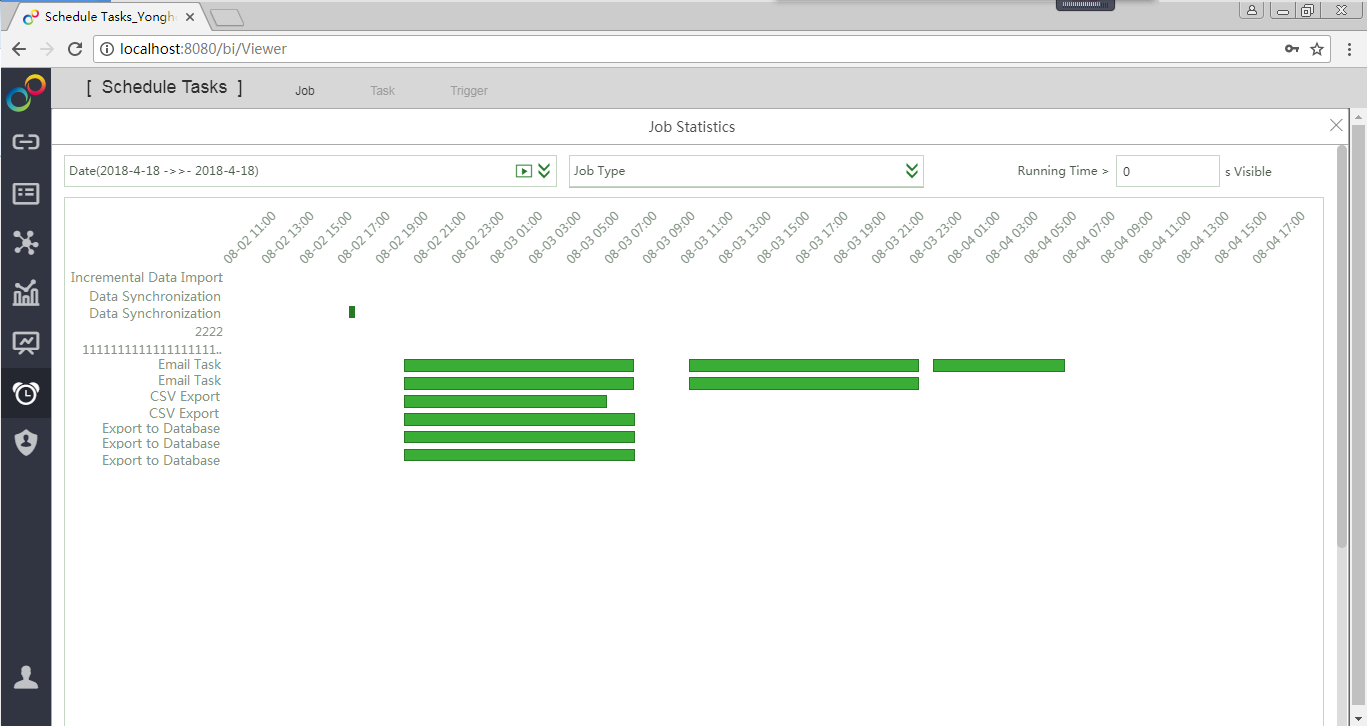
History Jobs Statistics Guiding Users to Arrange Schedule Tasks Properly
History jobs statistics guides users to arrange tasks more rationally, and avoids IO operations too heavy. History jobs statistics intuitively displays the waiting time, triggering time, and running time of each task, enabling the user to check the running status of the scheduled tasks and the distribution of system resources, thereby avoiding running scheduled tasks during the congestion period and decreasing IO pressure.
Note: Yonghong X-Suite and Y-Reporting do not support operation statistics diagram.
Improved Resource Import Speed and Database Storage Performance
Yonghong has improved resource import speed and database storage performance when processing bulk resources. For the database system, the batch operation interface does not need to frequently request data from the database, thereby avoiding the waste of communication resources and database resources. For the file system, batch operations effectively reduce the triggering of synchronization events after acquiring resources. For bulk import and database storage, processing performance is improved.
More Properties Taking Effect Immediately
The property setting of the system is more convenient and friendly. After modifying the property, the modification item takes effect immediately, avoiding the inconvenience caused by restarting the system to the user.
New Properities with Immediate Effect |
|
|---|---|
session.debug |
db.timeout=3600000 |
thread.debug |
secure.session.timeout=1800000 |
serial.mem.debug |
conn.sqlserver.reuse=false |
performance.debug |
conn.mysql.reuse=false |
qry.jdbc.driver.debug |
conn.oracle.rac.reuse=false |
excel.upload.size=1000 |
conn.hive.reuse=false |
qry.remark.as.view=false |
conn.db2.reuse=false |
default.layout.type=1 |
conn.impala.reuse=false |
phone.browser.phoneLayout=true |
mail.debug=false |
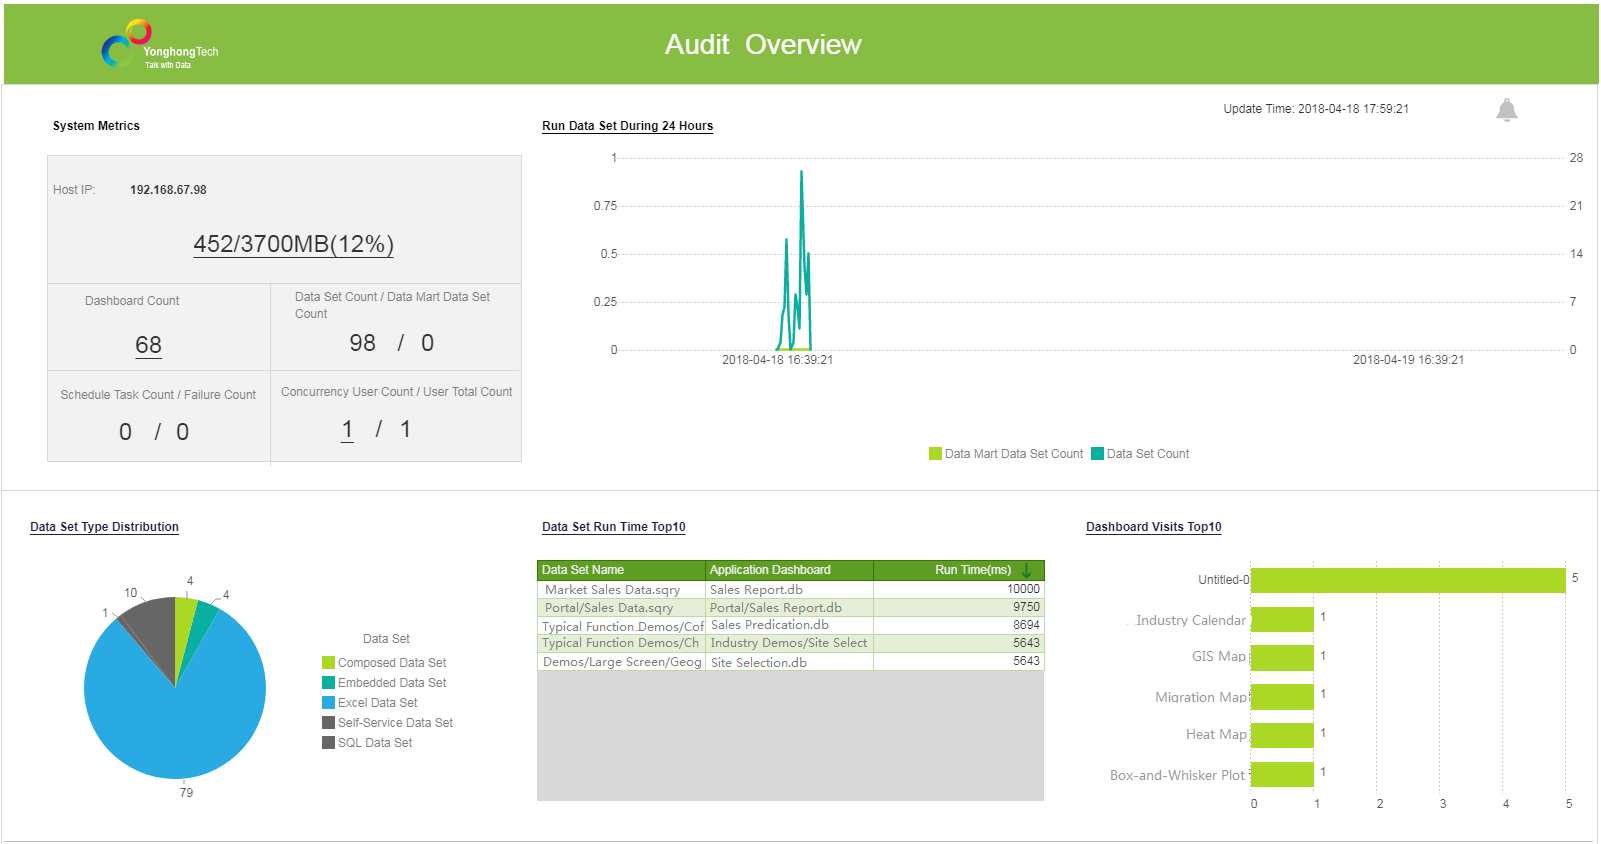
Pre-Warning in Audit System Promptly Pushing Errors
Yonghong has more powerful enterprise management and powerful early warning function, promptly pushing system problems to users and helping users to solve problems faster.
▪Data set execution timeout warning
When the dashboard, data set, and scheduled tasks take a long time to execute, the system will issue an warning and prompt relevant information. When viewing the warning information, the user can directly jump to the “Run Resource Information Monitor Statistics” dashboard through the hyperlink to view the operating status information of the highlighted alert entry.
By default, the system does not enable data set execution timeout warning. The user can turn on/off the timeout warning as needed, and set the threshold for triggering the warning.
▪Warning of inconsistent node version
When the node version is inconsistent, the system will issue an warning and inform the user of the node with a lower version in the warning information. When users view the warning information, they can directly go to the "Data mart node information statistics" dashboard through the hyperlink to view the information of the lower version node.
▪Warning of database offline or node communication exception
When the database is down or the node communication is abnormal, a warning is triggered and an error message is displayed.
4. Advanced Analysis
Advanced Analysis Serving Enterprise in One Stop
Yonghong V7.5 provides a new advanced analysis. The independent advanced analysis not only has a brand-new operation interface, but also has the ability of visual flow processing. It also provides comprehensive statistical algorithms including logistic regression, decision tree, association rule, K-means clustering, etc., enabling more professional machine learning.
▪New interface and independent function module
Advanced analysis becomes a functional module independently, with a brand new interface and more professional machine learning capability. Data set of exploratory analysis is used as input for advanced analysis, whose result can be displayed directly in dashboard. Advanced analysis together with exploratory analysis forms a closed-loop system and provides one-stop data analysis service.
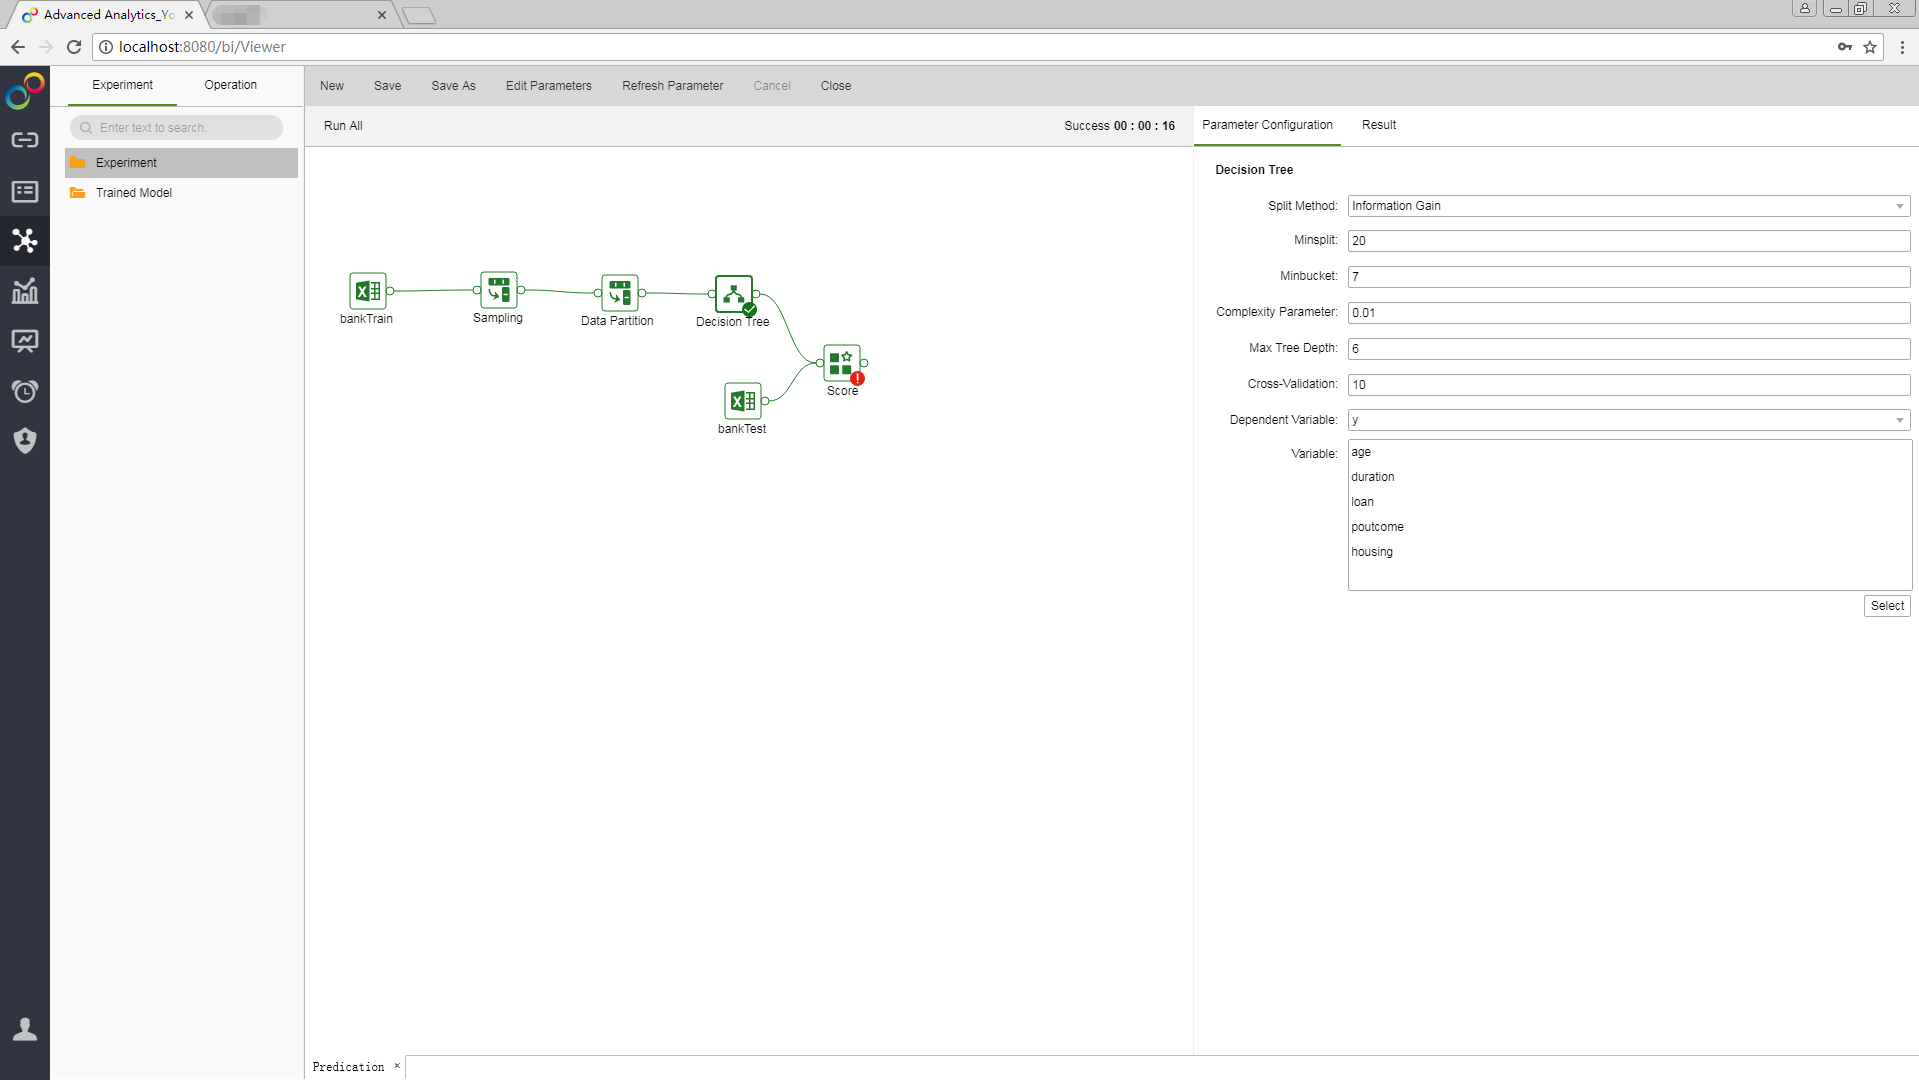
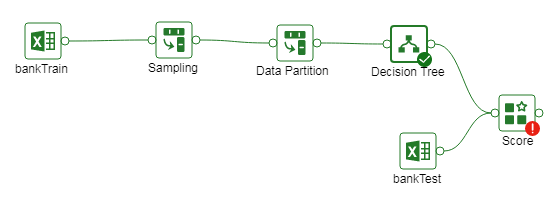
▪Visual workflow faciliates self-service modeling
Visual workflow helps users achieve self-service modeling. The whole process including data transformation, data exploration, model building, model training, model scoring, import to database, and visualization can be completed by easily dragging and dropping operations to form a complete workflow.
▪Distributed computing supports machine learning
Yonghong MPP market, through distributed computing, supports machine learning algorithms, including K-Means clustering.
Yonghong's big data platform integrates patented node communication technology, distributed computing, localization of calculation, distributed cache, parallel iterations of up to several hundred nodes, and improves performance by several orders of magnitude.
▪Full upgrade of machine learning algorithms
The newly upgraded advanced analysis includes four commonly used machine learning algorithms, including K-Means clustering, logistic regression, association rule, and decision tree. The user can apply these four algorithms to modeling.
◎K-Means Clustering: The most popular clustering algorithm. The algorithm accepts an unlabeled data set and then clusters the data set into different groups.
◎Logistic regression: A machine learning method used to do dichotomy and polytomy to estimate the likelihood of something. For example, the likelihood of a user purchasing a product, the likelihood of a patient suffering from a certain disease, and the likelihood of an advertisement being clicked on by a user.
◎Association Analysis: Also known as association mining. It is to find frequent patterns, associations, correlations, or causal structures existing in item collections or object collections in transaction data, relational data, or other information carriers.
◎Decision Tree: Based on the known probability of occurrence of various conditions, the decision tree, as a graphical method based on probability, is used to determine the probability that the expected value of the net present value is greater than or equal to zero, to evaluate the project risk, and to judge the project feasibility.
Advanced analysis can apply R scripts to achieve customization of algorithms.
◎R script: R is an open source and free statistical language, providing a variety of statistics, such as linear and nonlinear modeling, classical statistical tests, time series analysis, classification, clustering... When users write R scripts, You can call functions in the built-in R package, or you can call functions in a third-party R package. At the same time, users can use R script to draw graphs.
In Create Data Set and Make Dashboard modules, users can also use simple analysis algorithms, including one-dimensional linear regression, HoltWinters analysis, LDA linear classification, and K-Means clustering. The role of K-Means clustering is the same as that of the advanced analysis module, which will not be repeated below.
◎One-dimensional linear regression: Regression analysis is a widely used statistical tool and is mainly used to establish a relationship between two variables. One of the variables is called an independent variable, and its value is collected through experiments. The other variable is called the dependent variable and its value is calculated based on the independent variable. These two variables in linear regression satisfy an equation where the two variables are exponential (power) related.
◎HoltWinters analysis: By considering the horizontal trend and seasonal trend, the sampling data of a time interval and other time intervals are analyzed to predict the data of a future period of time. That is, predicting future data based on known historical data.
◎LDA Linear Classification: Projects high-dimensional model samples to the optimal discriminant vector space to achieve the effect of extracting the classification information and compressing the feature's spatial dimensions. After projection, the model samples have the largest inter-class distance and the smallest intra-class distance in the new subspace, ie, the pattern has the best separability in the space. LDA linear classification calls LDA function to obtain the LDA model based on the classification tag column and the training set, and the new sample is predicted and classified according to the model.
5. Big Data
Global Dictionary Technology Reducing Memory Usage and Improving Data Processing Speed
Yonghong Big Data adopts a global dictionary technology, which reduces memory usage and improves data processing speed. In the analysis model, dimension data is generally a string type. When computing in the data mart, too many strings take up too much memory, and they are less effective at grouping and comparison, which results in unsatisfactory overall processing. Yonghong's global dictionary technology uses numeric data to map strings, greatly reducing the need for memory usage and improving processing efficiency.
Continuous Performance Improvement
▪Instant Update: Yonghong V7.5 uses intermediate result set caching technology to permanently buffer the final GQuery execution result, which not only saves the memory space occupied by the cached result set, but also greatly improves the dashboard opening speed and realizes the second-level response of massive data.
▪Extreme Compression: In the map node, the MPP data mart can perform local Reduce calculation in advance, effectively compressing the size of the transmitted data, reducing the storage and memory space usage by 87.5%, and improving the calculation speed.
▪Distributed Metadata Storage: Storage of meta information is optimized. naming.meta on the Name node is stored separately, so that the cloud file can be partially backed up and migrated, and system reliability is also greatly improved.
6. App
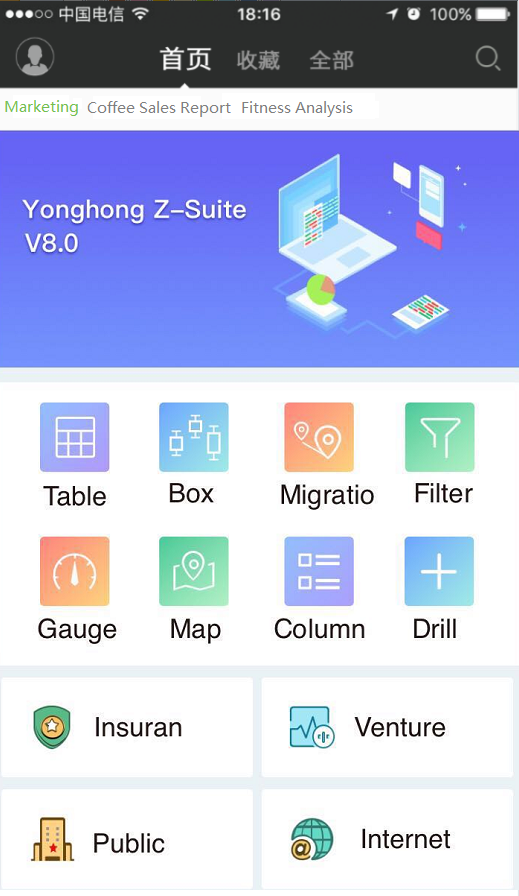
Custom Enterprise Portal
The portal function realizes the display of the enterprise portal on the mobile homepage. The user can specify a dashboard as an enterprise portal on the mobile configuration interface. If the user does not set the portal on the mobile terminal, the system will use the portal set on the PC as the mobile homepage by default.
Stability and Performance Improvement
Through the cache mechanism, dashboard loading efficiency, data co-movement response speed, and mobile performance are improved.
Better Visual Effect and Operation
The mobile terminal has better visual display capability and operating experience. The new version optimizes the display style of component/dashboard, optimizes the interaction process, and enables a more beautiful product interface and a more user-friendly experience.
❖New Features List
1. Self-Service Data Preparation
No. |
New Feature |
Version |
|---|---|---|
1 |
Addition of Multi-Dimensional Data Source (SAP BW、Oracle Essbase、SSAS) and Kylin Data Souce |
V7.5 |
2 |
Transcoding for Oracle |
V7.5 |
3 |
Double Protection of Data Table to Avoid Mistaken Deletion |
V7.5 |
4 |
Strict Permission Control to Ensure Data Security |
V7.5 |
5 |
Flexible Configuration in SQL Data Set |
V7.5 |
6 |
Convenient Addition of Schedule Task to Import Data into Database |
V7.5 |
7 |
Optimized Automatic Detection |
V7.5 |
8 |
Optimized Annotation to Teradata Database |
V7.5 |
9 |
Optimized Kerberos Loggin Method of Hive Database |
V7,5 |
10 |
Views Supported in SAP HANA Database |
V7.5.1 |
2. Dashboard
No. |
New Feature |
Version |
|---|---|---|
1 |
Box-And-Whisker Plot Helping Users to Learn Data Distribution |
V7.5 |
2 |
URL Component Loading Information on Internet to Dashboard |
V7.5 |
3 |
Introducing GIS Map to Achieving Location-Related Analysis |
V7.5 |
4 |
Migration Map Dynamically Showing Trajectory of Object |
V7.5 |
5 |
Powerful Heat Map Enabling Distribution and Density Analysis |
V7.5 |
6 |
Freely Build Your Own Region to Display Data in Custom Way |
V7.5 |
7 |
Dynamic Spot Making Vivid Map |
V7.5 |
8 |
Drilling Down Data on Map and Realizing Data Co-Movement |
V7.5 |
9 |
Automatic Mapping of Geographic Data |
V7.5 |
10 |
Optimized Radar Chart |
V7.5 |
11 |
Optimized Image Display |
V7.5 |
12 |
Highlighted and non-highlighted Brush Effects Meeting Different Requirements |
V7.5 |
13 |
Optimized Component Title |
V7.5 |
14 |
Easy-to Use Rich Text Editing Realizing Format Settings and Data Update |
V7.5 |
15 |
Custom Theme Displaying Dashboard in Personalized Style |
V7.5 |
16 |
Stronger Self-Adaption Capability to Display Dashboard on Full Screen |
V7.5 |
17 |
Configurable Loading Animation |
V7.5 |
18 |
Optimized Sorting Method for Chart to Improve User Experience |
V7.5 |
19 |
Optimized Sorting Method for Table to Leave Total Value out of Sorting |
V7.5 |
20 |
Custom Industry Calendar Serving Month-on-month Growth Calculation |
V7.5 |
21 |
Optimized Operation to Drill Data Down in Chart |
V7.5 |
22 |
Optimized Non-Selection Strategy |
V7.5 |
23 |
Autosave Dashboard Preventing the Losing of Dashboard Being Editing |
V7.5 |
24 |
Column Filtering and Position Swapping Facilitating Flexible Analysis |
V7.5 |
25 |
Pre-Warning of Data Export |
V7.5 |
26 |
Browsing Table Data in Pages |
V7.5 |
27 |
Parameters Controlling the Exported Content |
V7.5 |
28 |
Optimized Excel Export for Tab Component |
V7.5 |
29 |
Optimized Data View and Export in Create Dashboard Module |
V7.5 |
30 |
Multi Lines Supported in Text Box |
V7.5 |
31 |
Optimized Column Permission Control |
V7.5 |
32 |
Permission Control over Images |
V7.5 |
33 |
Binding Data to Component in H5 Mode |
V7.5 |
34 |
Help Center |
V7.5.1 |
3. Enterprise Management
4. Advanced Analysis
No. |
New Feature |
Version |
|---|---|---|
1 |
Advanced Analysis Serving Enterprise in One Stop |
V7.5 |
2 |
Visual Workflow Facilitating Self-Service Modeling |
V7.5 |
3 |
Lightweight Model Management |
V7.5 |
4 |
Distributed Computing Supporting Machine Learning |
V7.5 |
5 |
Full Upgrade of Machine Learning Algorithms |
V7.5 |
5. Big Data
No. |
New Feature |
Version |
|---|---|---|
1 |
Global Dictionary Technology Reducing Memory Usage and Improving Data Processing Speed |
V7.5 |
2 |
Easier Use of Data Mart Files |
V7.5 |
3 |
Distributed Metadata Storage: Partially Backing up and Migrating Cloud File |
V7.5 |
4 |
Orderly Restart |
V7.5 |
5 |
Optimized PRC Repeat Request Scheme |
V7.5 |
6 |
Perfect Data Mart Audit |
V7.5 |
7 |
Instant Update: Intermediate Result Set Caching Technology to Improve Dashboard Opening Speed |
V7.5 |
8 |
Extreme Compression: Reducing Storage and Memory Space Usage and Improving Calculation Speed |
V7.5 |
6. App
No. |
New Feature |
Version |
|---|---|---|
1 |
Custom Enterprise Portal |
V7.5 |
2 |
Better Visual Effect and Operation |
V7.5 |
3 |
Stability and Performance Improvement |
V7.5 |