|
<< Click to Display Table of Contents >> Yonghong Z-Suite V8.0 |
  
|
|
<< Click to Display Table of Contents >> Yonghong Z-Suite V8.0 |
  
|
❖New Key Features
1. Self-Service Data Preparation
Intelligent Node Identification and Data Association
Intelligent identification facilitates node connection, and data union or join, so that business staffers are able to do self-service data modeling easily.
Intelligent node identification helps users to connect available nodes. When building the data processing flow in self-service, the system will take the initiative to identify other nodes that can be connected in the node range, and prompt the user with the graphic to guide the user to connect the correct node and enhance the self-help data model ability.
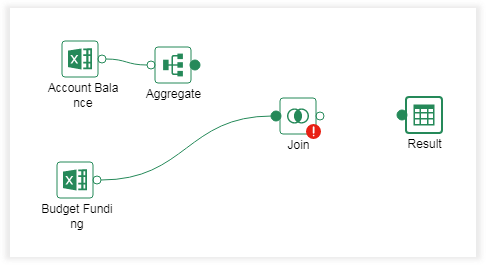
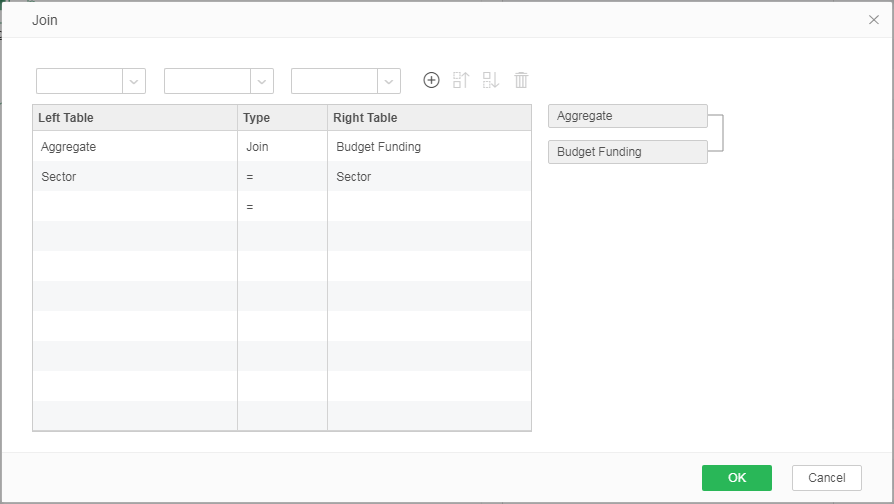
Automatic matching of related fields to quickly join multiple data sets. In self-service data sets, when you associate multiple data sets, the system automatically identifies the associated fields between each pair of data sets and, by default, associates the data sets by means of an internal association. Automatic identification and association functions allow users to use self-service data sets more efficiently and conveniently.
More Fluent Jump Between Data Source, Data Set and Dashboard
The jump between data sources, data sets, dashboards is smoother. Users can save the database connection information, and then use the database data to create a data set, and do metadata cleaning and governance. Then go straight to the dashboard interface and use clean data for visual research. In this process, users can easily complete the operation of multiple function modules without manually switching the function modules.
Improvement in Terms of Functions and Visual Effects in Data Source and Data Set
In data source and data set modules, the functions, usabilities, and visual effects, compared with the previous version, have made no small improvement.
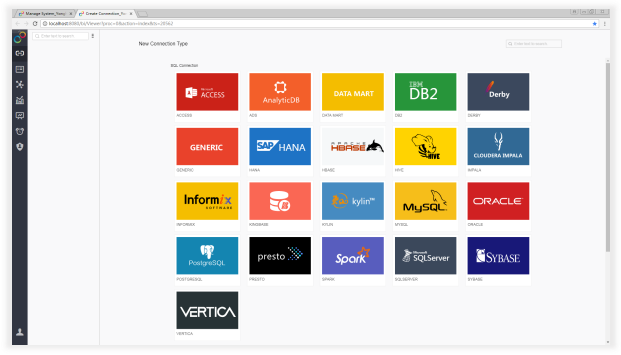
In the data source page, the data source is classified and displayed by type, and the data source search function is provided to facilitate the user to quickly locate the target database. In addition, the new version optimizes the data source configuration page, and enhances the user experience from the details.
As for data set module, data set homepage and specific configuration pages have made functional and ease-of-use upgrades, including:
•The homepage of data set is more orderly. It not only brings a fresh visual experience, but also helps users to quickly find the target data set.
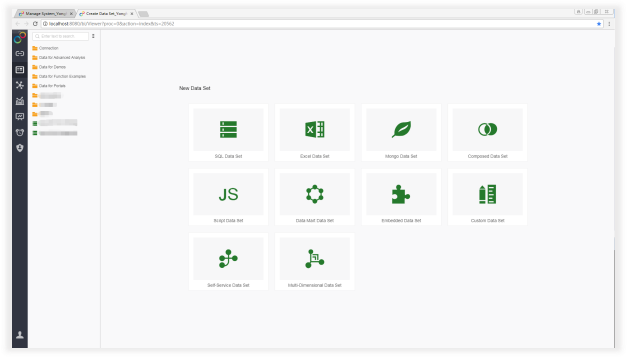
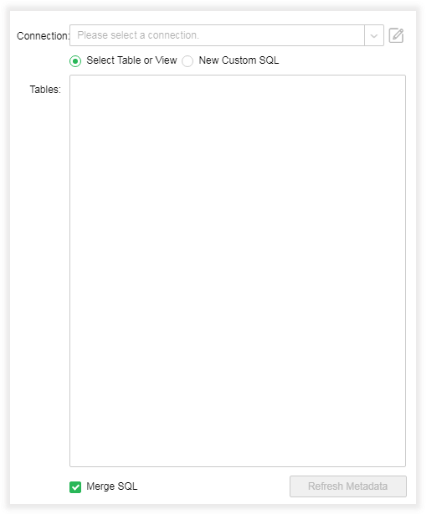
•SQL data set features are optimized to allow users to directly create a data set using a table, view, and stored procedure in the database. For more advanced data use requirements, a data set can be created by custom SQL statements.
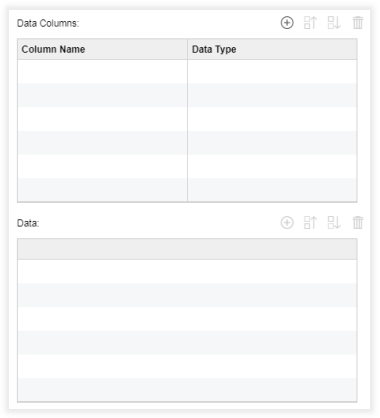
▪Optimized embedded data set makes the data addition, deletion, movement more convenient.
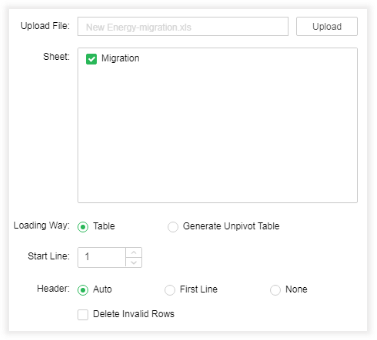
▪Optimization of Excel data set function: When uploading Excel and CSV files, the new start line function increases the flexibility in the use of data.
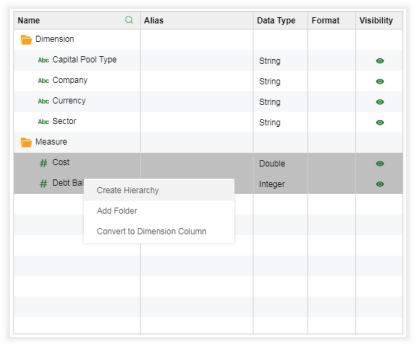
▪Optimized data management function not only supports batch operation of multiple data, but also improves the operation of new date expressions, data packets and missing value padding in terms of ease of use.
2. Dashboard
All-Round Optimization of Dashboard
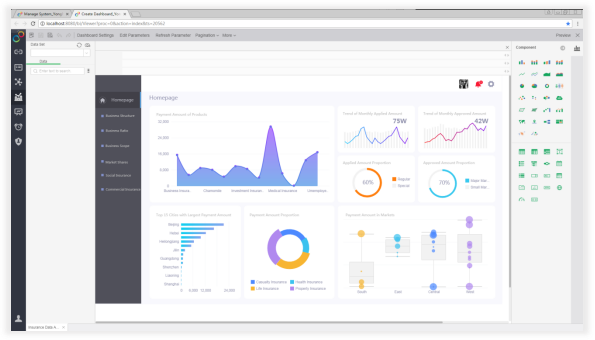
The dashboard module provides an all-round and innovative optimization and improvement of the operation flow and methods, aiming to simplify the operation process and provide users with the greatest convenience in making enterprise data reports.
The optimization of the page and operation mainly includes the following aspects:
▪A brand-new layout of the dashboard module comprehensively revises the menu bar, component library, attribute settings, format settings, and calculation settings, so that users can directly click components and make the required settings on the right side of the page when making data reports. What you see is what you get.
▪Optimize the export layout page and mobile layout page to facilitate the smoother layout adjustment of the dashboard export and mobile viewing.
▪Optimize the viewer settings of the dashboard, more in line with the user's usage habits.
▪Optimize the custom theme page to improve the user's operating experience from the layout.
▪Optimize preference settings page to better help users complete personalized settings.
Watermark Function Providing Copyright Protection
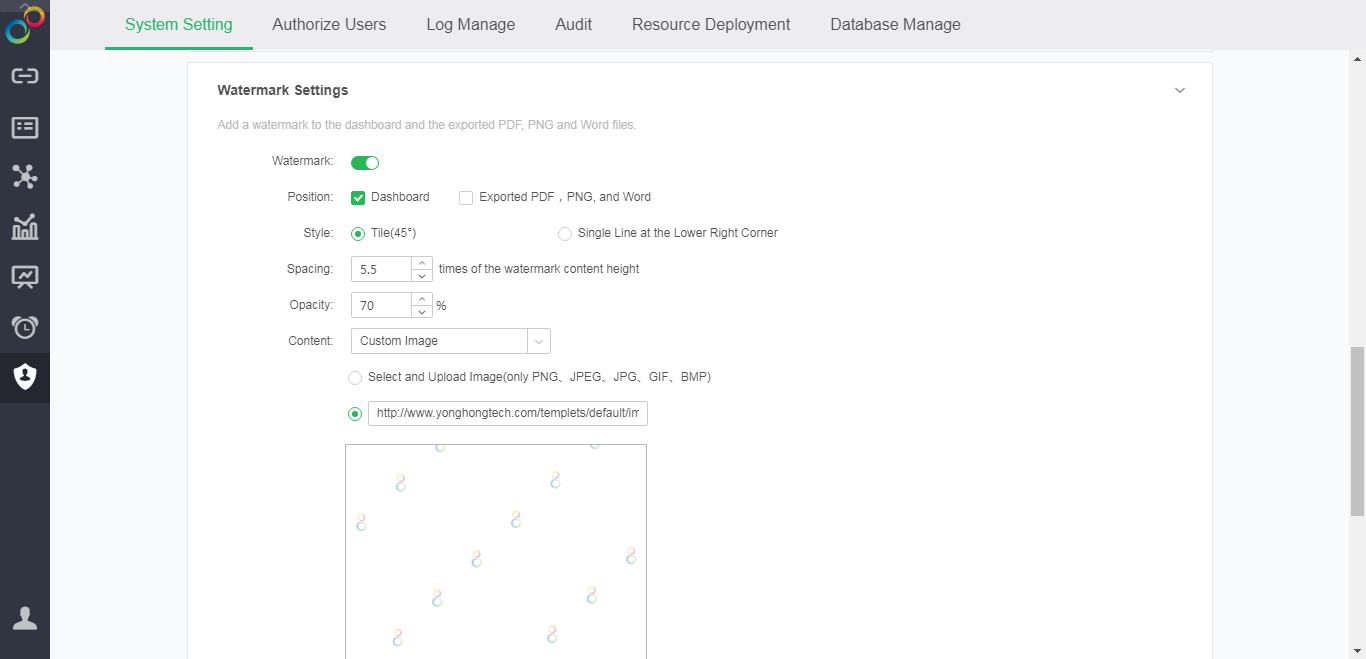
The watermarking function adds copyright protection information to the dashboard by adding a login name, custom text content, and custom picture to the dashboard, aiming to prevent corporate reports from being stolen by others.
The user can set the style, spacing, and transparency of the watermark and add the company's personalized watermark to the dashboard or its output files (PDF, PNG, Word). After adding the watermark, the watermark effect of the dashboard can be seen by either the PC or the mobile terminal.
By default, the user's dashboard does not apply the watermark. When the user needs to add a watermark, the watermark function needs to be turned on in the system settings, and the watermark is set.
Optimized Mobile Layout Faciliating the Dashboard View on Mobile
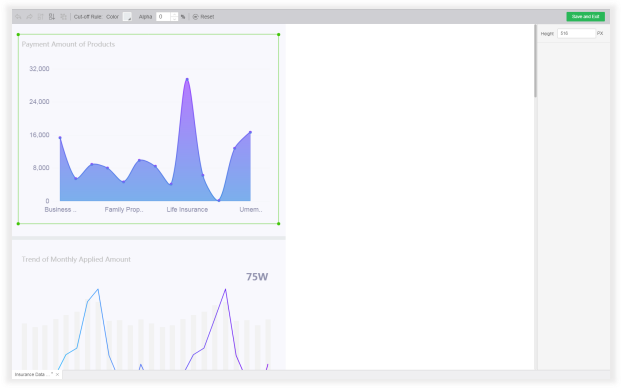
The mobile layout function is optimized to facilitate the user to adjust the dashboard layout on the mobile terminal.
New undo and redo functions allow users to undo or redo operations to avoid trouble caused by misuse.
Font size setting allows users to set the font size for the text in the dashboard. When the dashboard is displayed on the mobile terminal, fonts and components are simultaneously adapted to the screen size.
Component height setting allows users to set heights for individual components, making dashboard layout more flexible.
Cell size setting of the table component allows users to adjust the cell size so that the table data is more compatible with the mobile terminal.
The movement of components is more flexible. When moving components, auxiliary lines (including parallel lines, vertical lines, and neutral lines) are displayed to help users align components. In a group, when one or more components are selected, the position of the component can be moved through the mouse or the keyboard.
Optimized Operation Procedure Creating the Component in One Step
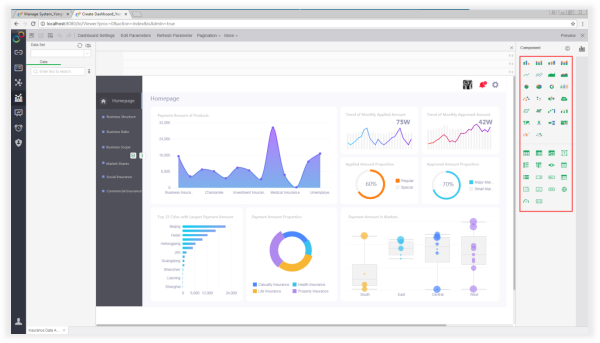
The addition of visual components is simplified to achieve data visualization in one step. In the new version, the dashboard page is re-arranged and all visual components are displayed on the right side of the page. The user can select the appropriate component among all the components and drag and drop it into the editing area to generate the visual component. Besides, chart type switching is also more convenient. The user can see the chart effect while switching, and it is more convenient for the user to find a chart suitable for the data.
Easier Settings of Components
All the attributes, functions, and formatting of components are integrated into the right pane (including component, general, setting, calculation, mark & label, legend, and axis). This not only simplifies the operation steps, but also displays the setting effect in real time. When the user selects a component in the editing area, the properties and styles of the component can be set directly in the right pane. When you select different areas of the component, you can set the corresponding part format. The component responds to the modification of attributes and formats in real time. What you see is what you get.
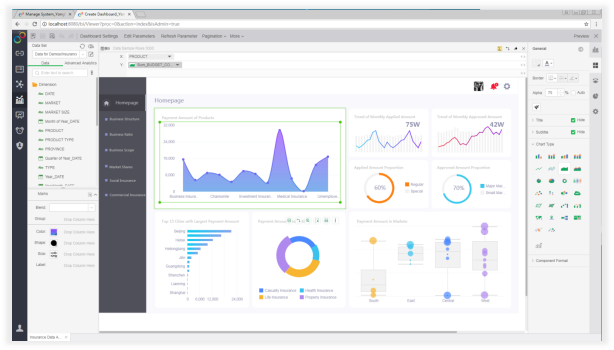
Expand/ Fold the Pane for Easier Dashboard Edition
Dashboard module has greater flexibility. Users can expand/retract data the binding area and functional area as needed during the editing of dashboard, making the page more tidy and simple. When you collapse the left pane or right pane, the editing area is more spacious, making it easier for users to adjust the dashboard layout in the editing area. If you need to add new components, bind data to the components, switch chart types, or set the properties or format of the components, you can expand the data area and the function area again.
3. Enterprise Management
Automatic Backup of Important Assets
The new version of Yonghong supports automatic backup of critical resources in the system, including data sources, data sets, dashboards, and experimental models. When backing up, resources are stored by default to the backup folder in the yonghong directory. The backup file takes the backup task's running time as the file name, which is easy to find and use.
Refined Authorization and Authentication to Manage Users, Roles, Groups, and Their Rights
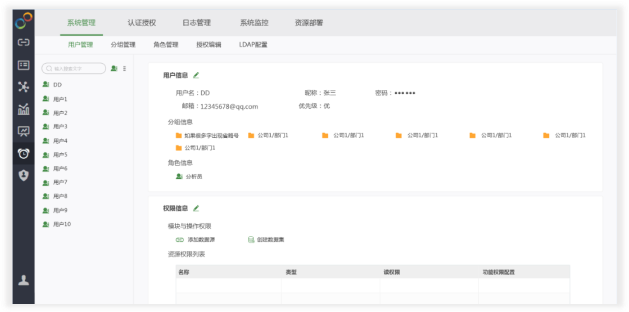
The authentication and authorization system has been optimized and subdivided, and user management, role management, group management and authorization management have been separately divided, which simplifies the operation steps of rights management and makes the management of users and users’ rights more convenient.
The management of users, groups, and roles is more scientific and organized. The administrator can not only view all users, groups, roles, understand the organizational structure, but also more convenient to view or edit the user information and permission, the group information and permission, and the role information and permission. Batch modification and deletion operations are also simpler and easier to use.
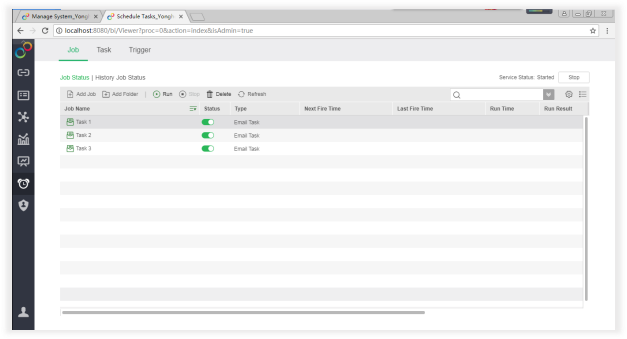
Batch Management of Jobs to Run, Stop, Move, or Delete Multiple Jobs
The batch management function of jobs facilitates the user to run, stop, move, and delete multiple jobs with one click, making the management of large-volume jobs more simple and orderly.
Batch Import of Data to Data Mart
Schedule tasks support batch synchronization of data set jobs, allowing users to import multiple data sets at a time into the data mart, eliminating the need for repeated operations.
4. Advanced Analysis
Distributed Association Rules Improving Computing Performance
Yonghong's big data platform integrates patented node communication technology, distributed computing, localization of calculations, distributed cache, and parallel iterations of up to several hundred nodes. This improves performance by several orders of magnitude, and greatly increases computational efficiency.
5. Big Data
Execution Cost Assessment Allocating System Resouces Reasonably
The new version estimates the CPU resources consumed by each data query, and isolates the system resources in the thread pool. According to the different volumes of resources consumed by the data query, a reasonable allocation of resources prevents the accumulation of lightweight queries and heavyweight queries, avoiding slow execution.
The evaluation of the execution cost is subdivided into filter execution cost evaluation, aggregate operation execution cost evaluation, expression execution cost evaluation, and network transmission cost evaluation. The system will perform a cost assessment based on historical information and table & column statistics.
In order to ensure the accuracy of the execution evaluation of the data mart data set, when the data is imported into the data mart, the column data distribution information is generated according to the size of the execution cost, and stored to the hard disk, so as to ensure accurate estimation of intermediate calculation results.
Reasonable Thread Scheduling Providing a Highly Available Environment
By thread grouping and task cost evaluation , the number of parallel executions is limited for threads with heavier tasks, so that threads with lighter tasks can obtain priority of execution resources, thereby improving the stability of the system.
Optimized Memory Control Improving the System Stability
Through memory control, the problem of tight memory and heavy IO pressure in case of large data volume is dealt with, and the stability of the system is enhanced. To ensure system stability, the following technical measures are mainly applied:
•Using Link to manage objects that have a large memory footprint and a long life cycle, and temporarily release memory for calculation.
•Add groups in GRLink and control the Link memory occupied by each group so that queries with small data volumes are not affected by queries with large data volumes.
•Multiple GRLink objects are written to one file, reducing the number of IOs and ensuring system stability.
Optimized Self-Service Analysis Improving the Computing Performance
The self-service analysis function is optimized to better support business needs and reduce the reliance of business people on the IT department. In the new version, the optimization of the product's self-service analysis function mainly focuses on the expressions added in the data mart data set. The new mechanism saves the computation result and improves the processing performance by avoiding the repetitive computation.
6. APP
View and Operate on the Component in Full Screen
View dashboard on mobile terminal has been fully upgraded and optimized. Not only does it support full-screen viewing of individual components, the data analysis approach is also completely new.
In the dashboard, except for text components, picture components, gauges, web pages, and submission components that do not support full-screen display, all other components support full-screen display, making it easier to view and analyze data.
After the table component and the chart component are in full screen, both the vertical screen view and the horizontal screen view are supported. In the full screen, the user can drill through multiple levels of data, select single or multiple columns of data, and highlight the data. After performing a drill or brush highlight and exiting the full screen, the dashboard is under effect of data association. For chart components, users can also add comments in full screen.
After the filter component and the parameter component are displayed in full screen, it is convenient for the user to check the option and set the parameter. After exiting full screen, the dashboard will display the required data content according to the filter conditions.
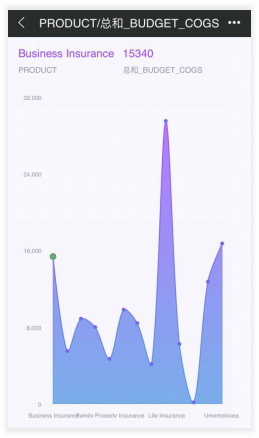
New Note Tool Enabling Users to Add Circles and Comments to the Dashboard
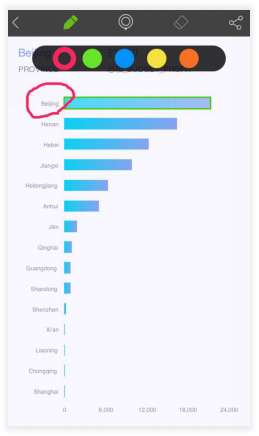
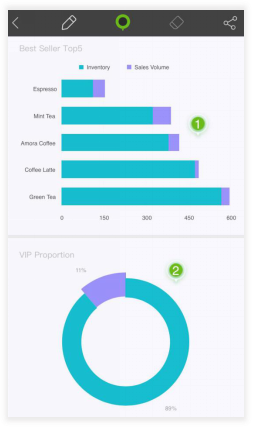
The pen and annotation tools are added on the mobile terminal to make it easier for business users to add data insights to the dashboard. When the user views the dashboard on the mobile terminal, the key data may be circled with a pen at any time, or text such as descriptions, comments, opinions, etc. may be added anywhere in the dashboard.
Users simply use the pen tool and swipe on the screen to add a circle to the dashboard. With the color of the circle, you can easily set different levels of importance for the circled content.
When you need to add annotations, just use the comments tool at the appropriate location and enter the text to add your own insights, explanations, and opinions to the dashboard.
Sharing the Dashboard or Note to Your Colleagues Any Where and Any Time
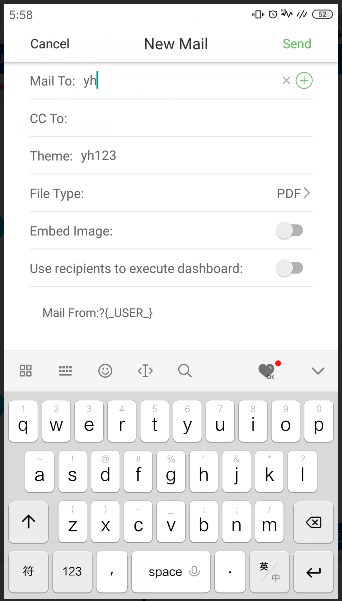
The mobile terminal adds a sharing function that allows users to save the dashboard locally or share it to colleagues through WeChat, QQ, and email. When the dashboard is shared, the comments and notes in the dashboard will be sent to the corresponding personnel together with the dashboard to achieve dashboard approval and mobile sharing anywhere, anytime.
❖New Features List
1. Self-Service Data Preparation
No. |
New Features |
Version |
|---|---|---|
1 |
Intelligent Node Identification and Data Association |
V8.0 |
2 |
Database Transcoding to Avoid Gibberish |
V8.0 |
3 |
User-Friendly Operation to Add New Connection |
V8.0 |
4 |
More Fluent Between Data Source, Data Set and Dashboard |
V8.0 |
5 |
Improvement in Terms of Functions and Visual Effects in Data Souce and Data Set |
V8.0 |
6 |
New ADS Connection Enabling the Real-time Online Analysis of Big Data in a High-Concurrency Environment |
V8.0 |
7 |
Self-Defined Separator to Separate the Columns in a Custom Way |
V8.0 |
2. Dashboard
No. |
New Features |
Version |
|---|---|---|
1 |
All-Round Optimization of Dashboard |
V8.0 |
2 |
Custom Label Width of Bar |
V8.0 |
3 |
Watermark Function Providing Copyright Protection |
V8.0 |
4 |
Expand/ Fold the Pane for Easier Dashboard Edition |
V8.0 |
5 |
Optimized Pareto Chart to Find the Key Factor |
V8.0 |
6 |
Optimized Operation Procedure Creating the Component in One Step |
V8.0 |
7 |
Easier Settings of Components |
V8.0 |
8 |
Optimized Right-Click Menu When Selecting Multiple Components |
V8.0 |
9 |
Optimized Mobile Layout Faciliating the Dashboard View on Mobile |
V8.0 |
10 |
Add Title to the Range Filter |
V8.0 |
11 |
Hide the Underline of Hyperlink |
V8.0 |
12 |
Richer Table Styles |
V8.0 |
13 |
Custom System Skin |
V8.0 |
14 |
More Languages Supported |
V8.0 |
15 |
Best Font to Improve Visual Effect |
V8.0 |
16 |
More User-Friendly Operation |
V8.0 |
3. Enterprise Management
No. |
New Features |
Version |
|---|---|---|
1 |
Automatic Backup of Important Assets |
V8.0 |
2 |
Powerful Logs Management Providing Logs Download of All Nodes in the Cluster |
V8.0 |
3 |
Refined Authorization and Authentication to Manage Users, Roles, Groups, and Their Rights |
V8.0 |
4 |
Batch Management of Jobs to Run, Stop, Move, or Delete Multiple Jobs |
V8.0 |
5 |
Batch Import of Data to Data Mart |
V8.0 |
7 |
More Convenient Authorization |
V8.0 |
8 |
Improvement of System Settings |
V8.0 |
9 |
More User-Friendly Enterprise Management |
V8.0 |
4. Advanced Analysis
No. |
New Features |
Version |
|---|---|---|
1 |
Distributed Association Rules Improving Computing Performance |
V8.0 |
5. Big Data
No. |
New Features |
Version |
|---|---|---|
1 |
Execution Cost Assessment Allocating System Resources Reasonably |
V8.0 |
2 |
Reasonable Thread Scheduling Providing a Highly Available Environment |
V8.0 |
3 |
Optimized Memory Control Improving the System Stability |
V8.0 |
4 |
Optimized Self-Service Analysis Improving the Computing Performance |
V8.0 |
5 |
Optimized System Audit |
V8.0 |
6. App
No. |
New Features |
Version |
|---|---|---|
1 |
View and Operate on the Component in Full Screen |
V8.0 |
2 |
New Note Tool Enabling Users to Add Circles and Comments to the Dashboard |
V8.0 |
3 |
Sharing the Dashboard or Note to Your Colleagues Any Where and Any Time |
V8.0 |
4 |
Optimized Search Function to Locate the Dashboard Precisely |
V8.0 |
5 |
Optimized Portal Function and Preference Settings |
V8.0 |