|
<< Click to Display Table of Contents >> Yonghong Z-Suite V8.0.1 |
  
|
|
<< Click to Display Table of Contents >> Yonghong Z-Suite V8.0.1 |
  
|
❖New Key Features
1. Self-Service Data Preparation
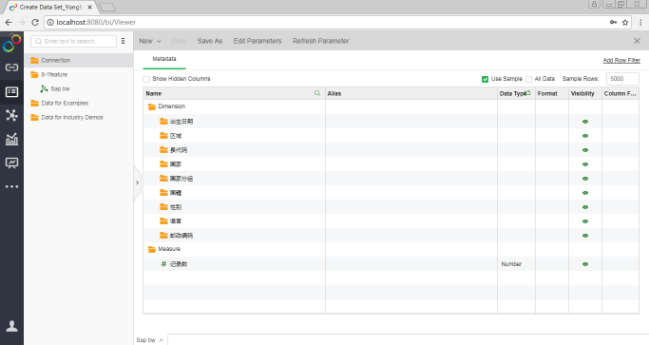
Optimize the Use of SAP BW Multi-dimensional Database to Improve User Experience and Performance
The 8.0.1 version is mainly optimized for SAP BW multidimensional database in three aspects to improve user efficiency.
▪Two data processing modes to improve the multi-dimensional database computing performance, satisfying the needs of different data volume.
When the enterprise's data columns are too many, you can use the bind-and-process mode: When the data column is bound to the dashboard, only the data of this column is acquired and processed. When the data columns are not too many, the all-column-process mode is used: when one data column is bound to the dashboard, the first n rows of all the data columns of the data table are acquired, so that the calculation result can be obtained quickly afterwards.
▪Optimize the parameter usage of SAP BW.
Optimize the parameter usage of SAP BW and improve the performance of the parameter value list.
It supports multiple forms of SAP BW variables, including single selection, multiple selections, alternative, and range. You can see all these variables in Edit Parameter window of Yonghong Z-Suite, and assign a value to the variable by choosing from the parameter value list or directly enter the value.
▪Support key and text of SAP BW database.
The 8.0.1 version supports users to switch the display form of dimension data. When the user binds the dimension column to the dashboard, the dimension data can be switched from the default text form to the key form, or the key form can be switched back to the text form to meet the different needs of the enterprise users.
▪Optimize the dimension filtering performance of ESSBASE, SSAS, and SAP BW.
A filter function is added to the dimension column of multi-dimensional database, allowing you to filter the members of the dimension. The processing mode, that is filter first and cross join later, could greatly improve the processing performance. When the amount of data is too large, users are recommended to use dimension filtering instead of Filtering.
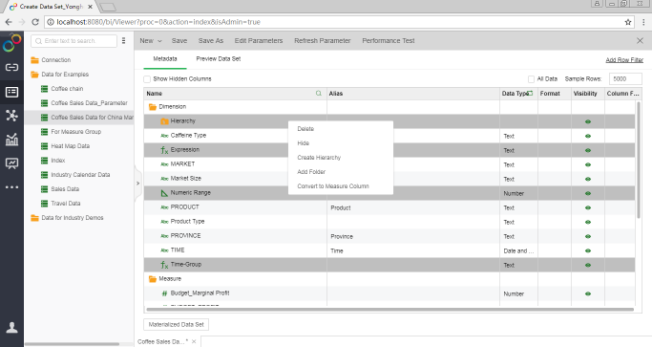
Batch Hide and Delete Columns
For user-created data columns, such as expressions, hierarchies, data ranges, value mappings, etc., batch deletion is supported. Users only need to select multiple newly-created data columns and delete them at a time through the right-click menu.
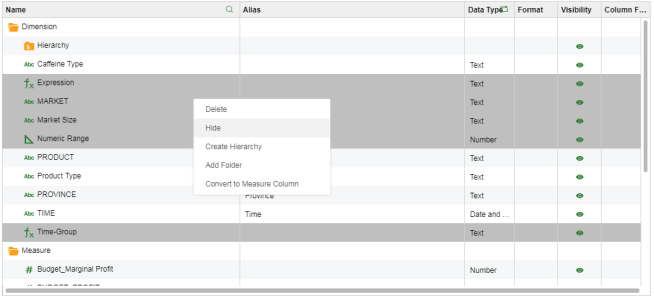
For all data columns in the metadata area, users can hide them in batch. After the data column is hidden, it will disappear from the metadata area, so that the user will not be interfered with the hidden data and focus on processing the required data. With the "Show Hidden Columns" function, hidden data columns appear in the metadata area in a grayed-out state so that users can understand which data columns are hidden. To restore the data to visible state, simply unhide it.
2. Dashboard
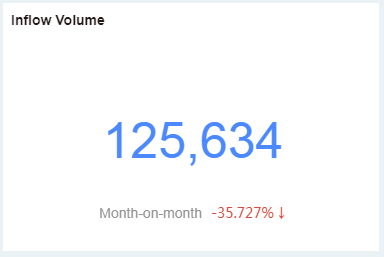
Add Indicator Cards to Display Statistical Result
New chart type, indicator card, displays the statistical result. The indicator card only supports binding one measure column. According to the data bound by the user, the indicator card can show the growth rate compared with the same/ previous period and the dynamic calculation result.
Optimize Map Settings and Easily Create Corporate Data Map
The new version not only enhances the map function, satisfying more map usage scenarios, but also eases the operations.
The promotion of map function mainly includes two aspects:
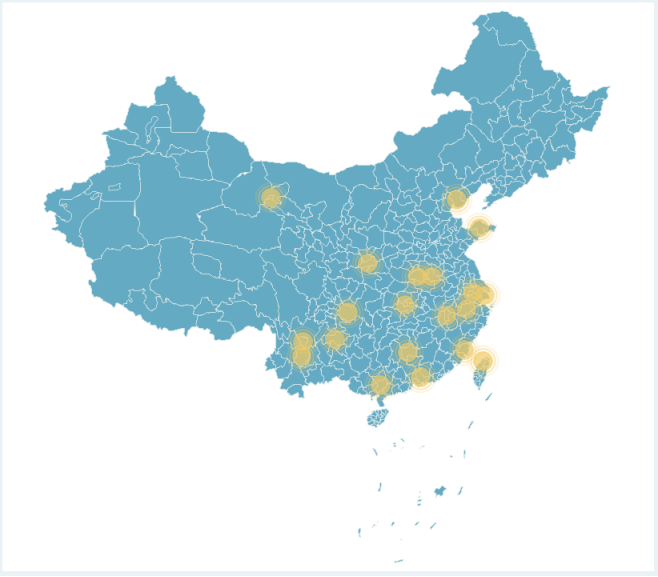
First, the map is more flexible. The user can freely set the display level of the map according to the business scenario, that is, the minimum granularity of the geographic area. If you need to show the profit of each province in the map, you can select “province” as the display level; if you need to show that of each city, select “city” as the display level.
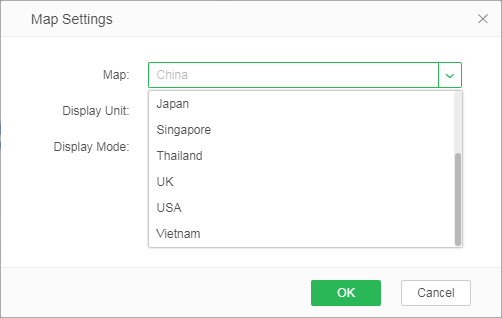
Second, more national maps, including Vietnam, Singapore, Japan, Australia, Thailand, and etc., meet the needs of more overseas companies or overseas markets.
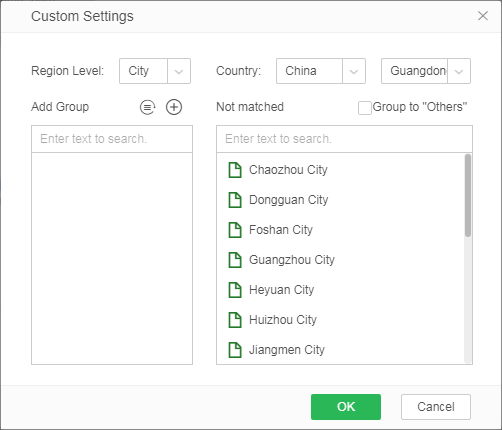
In terms of ease of use, maps can be more easily and conveniently created through more clear and easy-to-understand guidance and more user-friendly interface, especially when users make custom map.
Add Offline GIS Map Enabling Users to View GIS Map Without Network
The new offline GIS map supports users to use GIS maps without Internet, and to conduct co-movement analysis related to geographic data.
! Note: Using an offline map requires the user to modify the tile server address. This may violate the Baidu Maps User Terms of Service. Please use with caution. If a legal issue arises, it is the responsibility of the user.
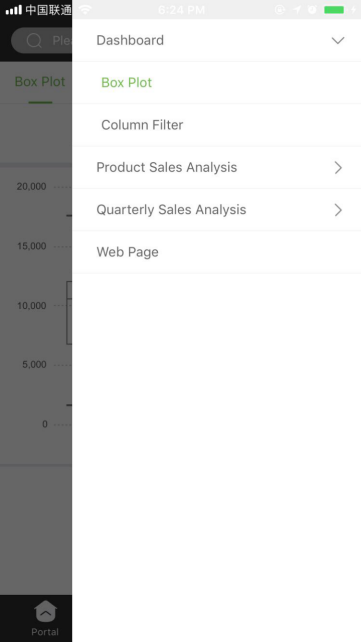
Multiple levels of Navigation to Access More Content in Portal
The portal supports multiple levels of navigation, enabling the enterprise portal to have richer and more well-organized content. Users can view more dashboards and resources through the enterprise portal.
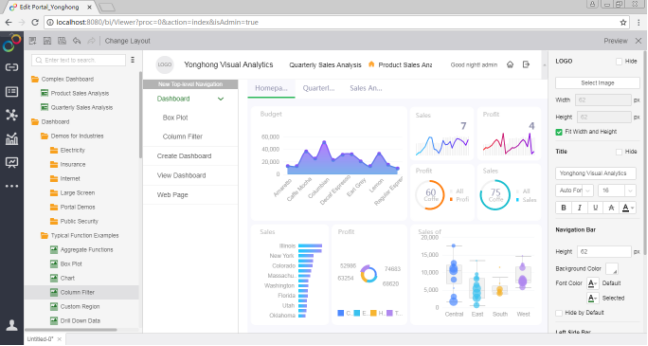
Whether it is a PC or a mobile terminal, users are allowed to use multi-level navigation to enter the corresponding portal page.
Easier-to-use Portal Function
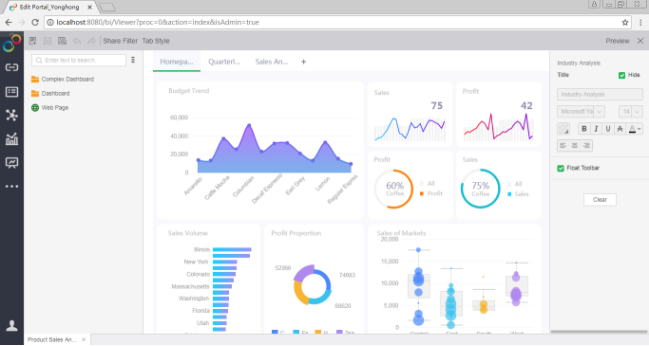
The portal module provides a comprehensive user experience enhancement and function optimization, assisting enterprise users to create better corporate portals with simpler operations.
In terms of ease of use and user experience, the portal module has a new interface, including the top menu area, the left resource area, the right format area, and the central edit area. Well-organized interface layout enables users to experience the WYSIWYG (What You See is What You Get) portal editor and better guide users through the entire process of making the portal. After going through the re-layout, users can more quickly and easily find the required functions to achieve their own needs.
Besides, detailed improvement of the portal module includes:
▪Optimize shared filtering. The user can set up sharing filtering on the menu bar of any complex dashboard. After setting, the dashboards in the complex dashboard will share the same filters.
▪The size of the enterprise logo automatically adapts to the height of the top navigation bar.
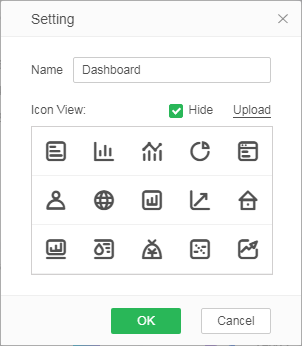
▪Support more personalized settings. The portal module allows users to configure icons for each items in the top navigation bar and side bar, and supports users to set the format of bars to meet the company's custom needs.
3. Enterprise Management
Monitor Column Dependency and Provide Impact Analysis
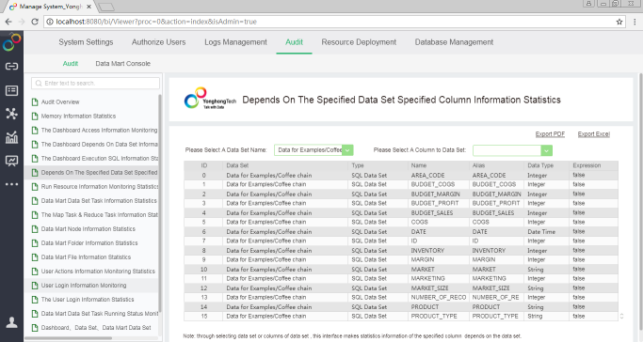
Data column dependency monitoring helps users understand the scope of influence of modified column name or alias. The new "Impact Analysis of Modified Column Names" monitoring report enables you to quickly find out data sets, dashboards, components, etc. that use the data column, making it easier for users to evaluate the impact of modifying the column name or alias.
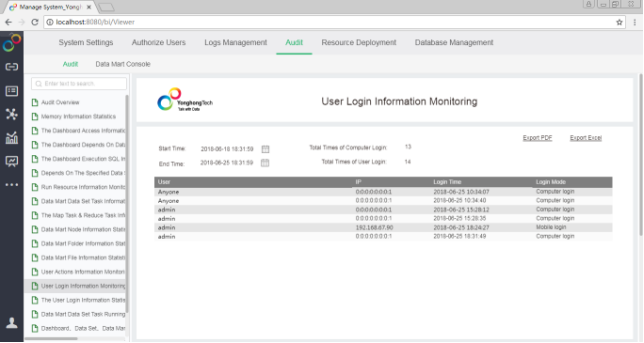
More Detailed User Monitoring to Keep Track of User Activities
The 8.0.1 version monitors more user operations, login and logout , keeping track of user activities, and detecting abnormal user behaviors in a timely manner.
The User Actions Information Monitoring covers more actions, including the addition, deletion, and modification of resources, authentication and authorization operations, system management operations, and preference settings.
New monitoring items in User Login Information Monitoring include logout, session expiration, and login failure.
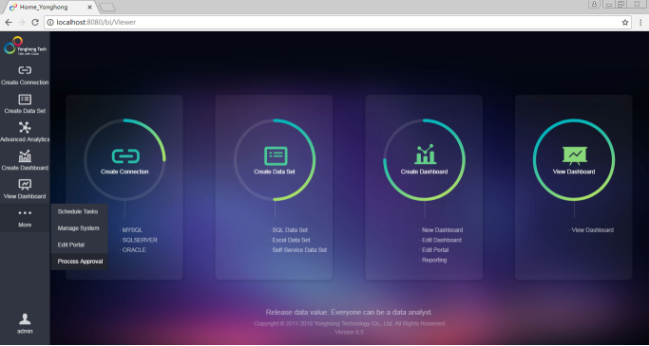
Access to Approval Function Which is Under Permission Control
The authentication and authorization system provides permission control for the process approval function, assigning the ordinary user the permission to use the process approval function, and providing the management function of the process approval for the administrator or other specific users. People who have process approval functions or management functions can enter the process approval module through the process approval on the left navigation bar.
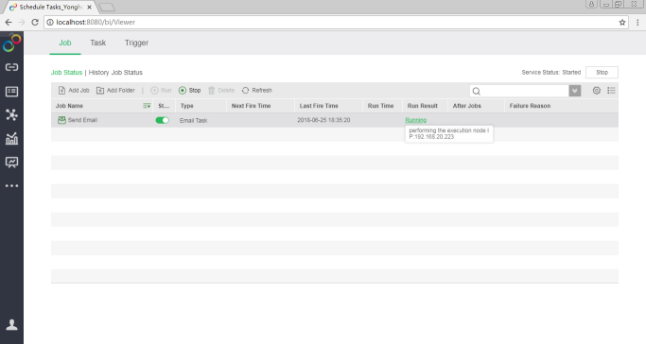
Display Running Node IP of the Scheduling Task to Help Operation and Maintenance
For the current and history jobs, the IP address of the running node is displayed, which helps the O&M personnel to know the load of tasks on each node, and can also check the logs of the corresponding node to solve the problem.
4. APP
Optimize Server Access Mechanism to Avoid Access Errors
In order to improve server access efficiency and avoid access errors, Yonghong mobile terminal has optimized the access mechanism. From the 8.0.1 version and later, the server's access address is changed to: ip:port/bi/server, where ip is the server's IP address and port is the server's port number.
Overall Interface Optimization to Enhance Usability of Mobile Terminal
The mobile app of 8.0.1 version optimizes the overall interface to cater to the user's habits and mainstream preferences.
•Navigation bar at the bottom of the screen guides users to the home page, dashboards, favorites, and my (personal center).
•New dashboard navigation. The dashboards are categorized by public dashboards and my dashboards, guiding users to quickly find the required dashboards.
•Optimize the setup of mobile home page and simplify operation steps.
•Optimize the words on the interface. Use the popular "Favorites" to replace "Focus" and "Me" instead of "Personal Center."
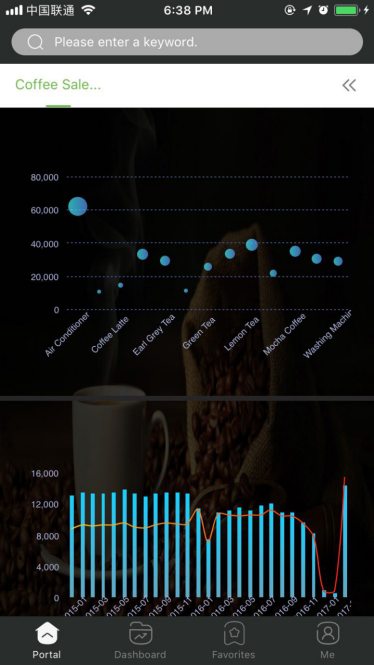
Optimize Mobile Layout Settings to Flexibly Adjust Your Mobile Dashboard
The optimized mobile layout settings make the dashboard more suitable for the mobile phone. The adjustment of mobile layout mainly includes four aspects:
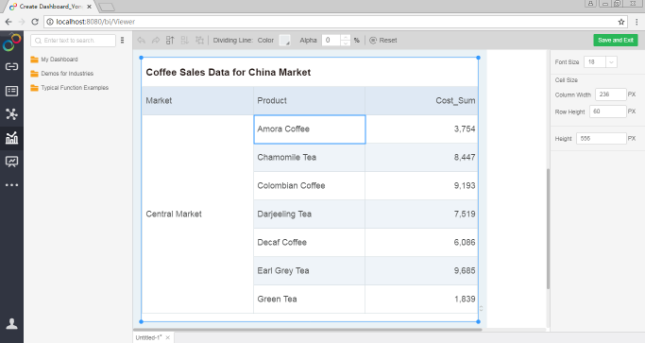
•Freely adjust the cell size. Whether it is a free layout or a grid layout, users can freely adjust the cell size in tables, pivots, and free-form tables, making the viewing of table data more consistent with mobile reading habits.
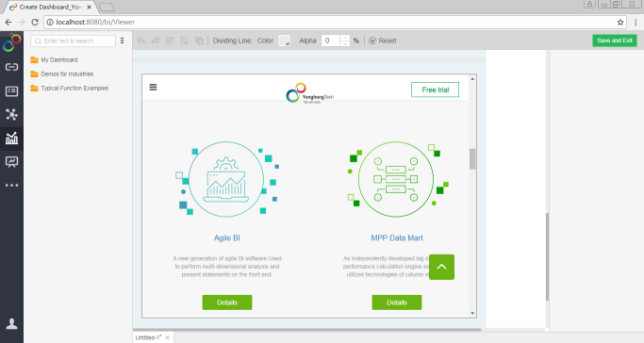
•The web page component displays the specific web page content. When adjusting the dashboard layout for mobile, the user can directly see the content of the referenced web page in the web page component.
▪Optimize the display position of the legend. In the mobile layout of the dashboard, the legend is displayed at the bottom of the component by default. If you have special needs, you can move the legend to the right side of the component.
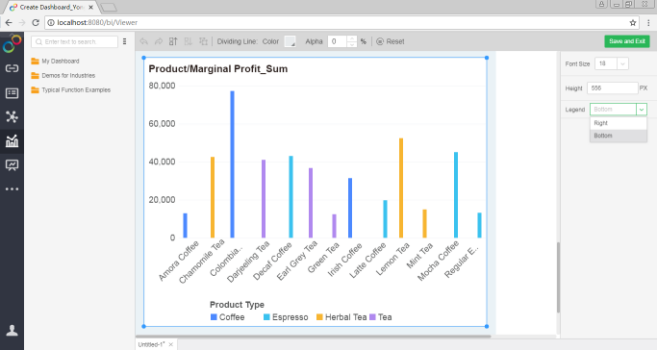
▪Optimize the default height of the component to make the layout more beautiful.
Optimize the Parameter Usage to Assign Value More Easily
The unique mobile interface eases the parameter value assignment so that users can easily assign parameter values. The pop-up parameters of the dashboard slide out from the bottom of the screen. The user gives the parameter a value in a new page by entering one value or selecting one value from list. After that, it will return to the parameter list so that the user can assign values for other parameters.
Improve Dashboard Loading Performance
Increase the speed of dashboard opening and loading, optimize the interaction effect, and enhance user friendliness.
▪Real-time loading mechanism. When the user views the dashboard, as the finger slides on the screen, the display content is loaded in real time, so that the dashboard is opened more quickly.
▪Cache read mechanism. When a dashboard is opened for the second time, the system reads the cache of the dashboard, shortening the loading time of the dashboard, and improving the efficiency of viewing and analysis.
❖New Features List
1. Self-Service Data Preparation
No. |
New Features |
Version |
|---|---|---|
1 |
Optimize the Use of SAP BW Multi-dimensional Database to Improve User Experience and Performance |
V8.0.1 |
2 |
Batch Hide and Delete Columns |
V8.0.1 |
3 |
Greater Support for SAP HANA |
V8.0.1 |
4 |
Optimize the Performance of Refreshing Metadata |
V8.0.1 |
5 |
Enhance the Usability of Data Preparation |
V8.0.1 |
2. Dashboard
No. |
New Features |
Version |
|---|---|---|
1 |
Add Indicator Cards to Display Statistical Result |
V8.0.1 |
2 |
Optimize Map Settings and Easily Create Corporate Data Map |
V8.0.1 |
3 |
Optimize Portal Module to Provide More Functions and Enhance Usability |
V8.0.1 |
4 |
Add Offline GIS Map Enabling Users to View GIS Map Without Network |
V8.0.1 |
5 |
Improve User Experience |
V8.0.1 |
6 |
Support Image in WebP Format to Increase Image Loading Speed |
V8.0.1 |
7 |
New Gradients for Charts |
V8.0.1 |
3. Enterprise Management
No. |
New Features |
Version |
|---|---|---|
1 |
Add Hints for Administrator Login to Improve User Experience |
V8.0.1 |
2 |
Search Function in Access Permission to Quickly Locate the Target |
V8.0.1 |
3 |
Monitor System Resource Relationships and Provide Impact Analysis |
V8.0.1 |
4 |
More Detailed User Monitoring to Keep Track of User Activities |
V8.0.1 |
5 |
Improved Data Mart Console to Manage the Cluster in Easier Way |
V8.0.1 |
6 |
Access to Approval Function Which is Under Permission Control |
V8.0.1 |
7 |
Display Running Node IP of the Scheduling Task to Help Operation and Maintenance |
V8.0.1 |
8 |
Display Resource Loading Progress |
V8.0.1 |
9 |
Easier-to-use Security System |
V8.0.1 |
4. App
No. |
New Features |
Version |
|---|---|---|
1 |
Overall Interface Optimization to Enhance Usability of Mobile Terminal |
V8.0.1 |
2 |
Optimize Personal Center to Meet More Custom Needs |
V8.0.1 |
3 |
Optimize Mobile Layout Settings to Flexibly Adjust Your Mobile Dashboard |
V8.0.1 |
4 |
Optimize the Parameter Usage to Assign Value More Easily |
V8.0.1 |
5 |
Improve Dashboard Loading Performance |
V8.0.1 |
6 |
Display Detailed Data in Full Screen |
V8.0.1 |
7 |
Multiple Levels of Navigation in Mobile Portal |
V8.0.1 |
8 |
Continuously Improve User Experience |
V8.0.1 |