|
<< Click to Display Table of Contents >> Yonghong Z-Suite V8.5 |
  
|
|
<< Click to Display Table of Contents >> Yonghong Z-Suite V8.5 |
  
|
❖New Key Features
1. Self-Service Data Preparation
Optimize Data Processing Performance, and Improve Response Speed of Data Preview
For SQL data set, optimize the performance of refreshing metadata, obtain the table structure quickly, and improve the response speed of data preview.
For the Composed Data Set and Self-Service Data Set which are pushed down to the database for processing, accelerate the data access speed and improve the computing performance.
Support Database Paging, and Improve Data Access Speed
For SQL Server, MySQL, DB2, Oracle (supported by 8.0.1) database, realize database paging query, no longer query all data at one time, but query data in batches to reduce server resource occupancy and improve data access performance.
Push Down to the Database for Processing When the Filter Includes“contains one of”
In an SQL dataset, as long as the filter condition is“Include One of Them” in the Filter, the filter will be pushed down to the database for processing.
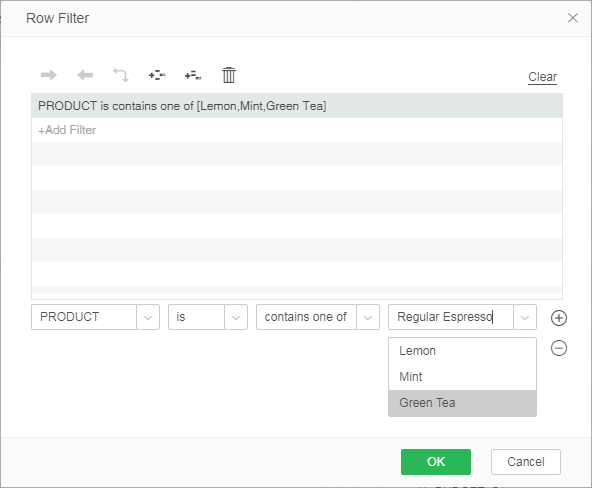
Increase the Number of Default Caches to Improve Query Response Speed
The default number of caches for queries has been increased from 100 to 500. Increasing the cache can result in faster response speed.
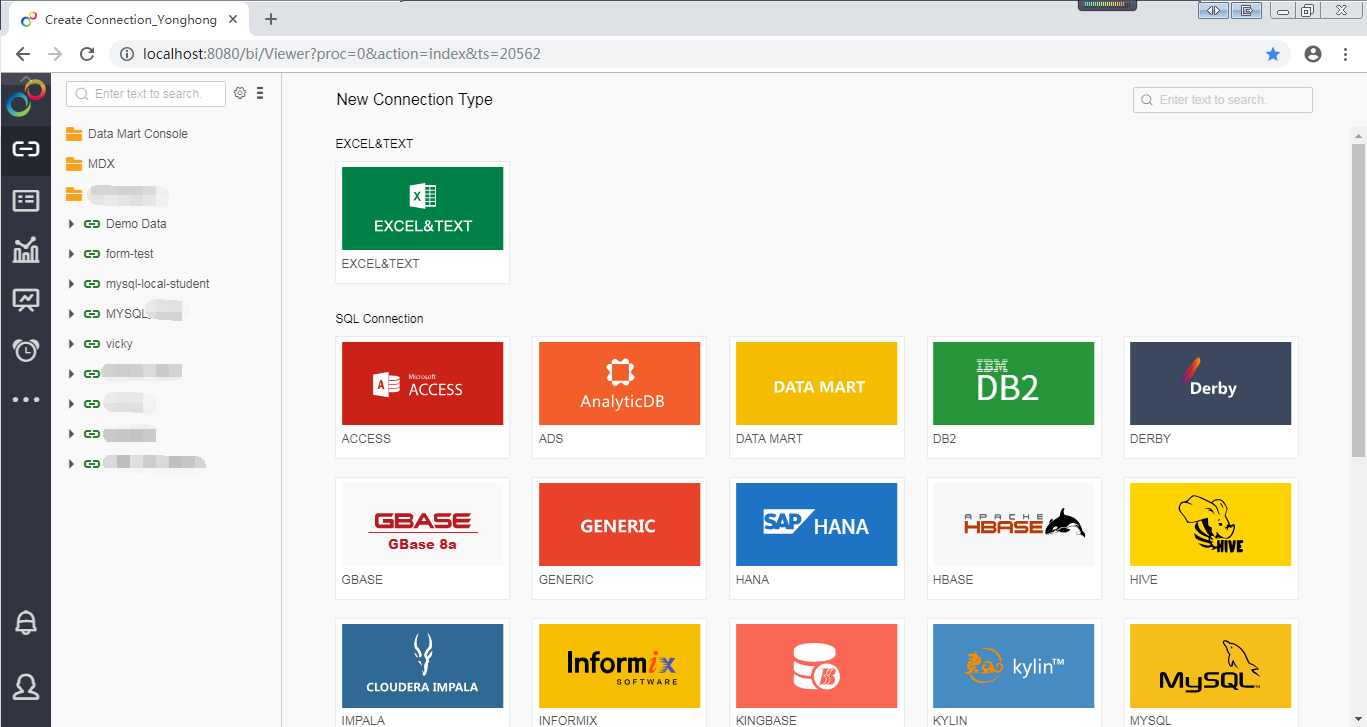
Support GBase Database, Covering More Data Source
Data source support capacity of Yonghong is further enhanced. The newly added GBase data source successfully connects to the user’s GBase database.
Flexible Row and Column Conversion, Free Switching Between One-dimensional Table and Two-dimensional Table
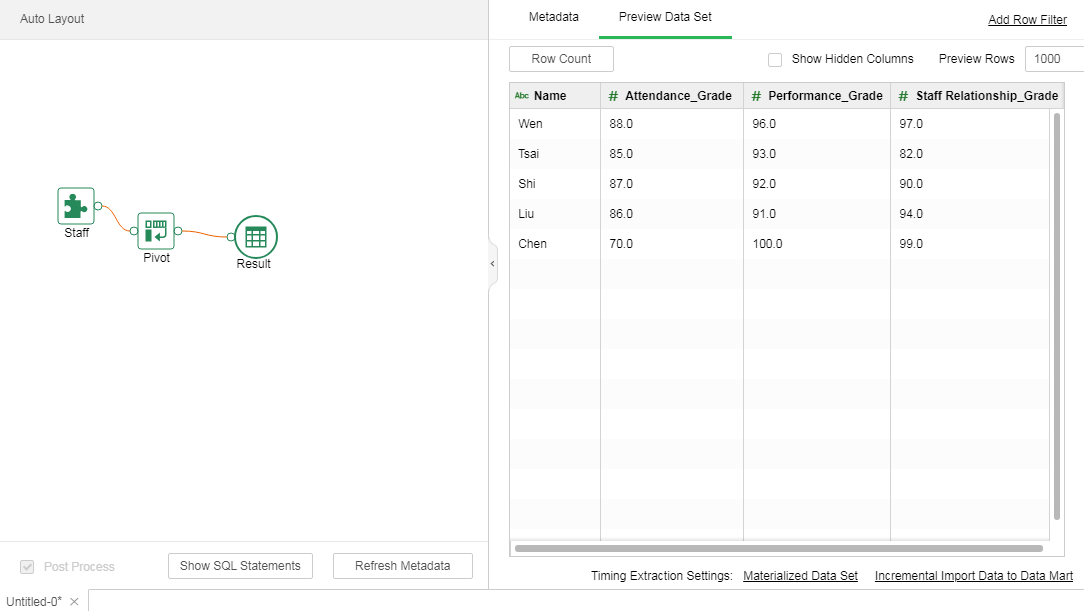
The self-service data set supports the row-to-column feature, known as the PivotTable feature. You can easily convert row to column by selecting the fields that need to be converted, and switch between one-dimensional table and two-dimensional table.
When row and column conversion is performed on a dataset, only one column of data can be selected as the conversion column, and multiple columns can be selected as the retention and value columns. Notes: Date-type column cannot be converted.
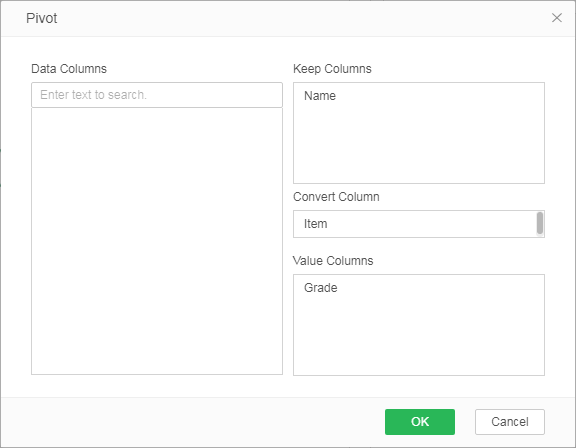
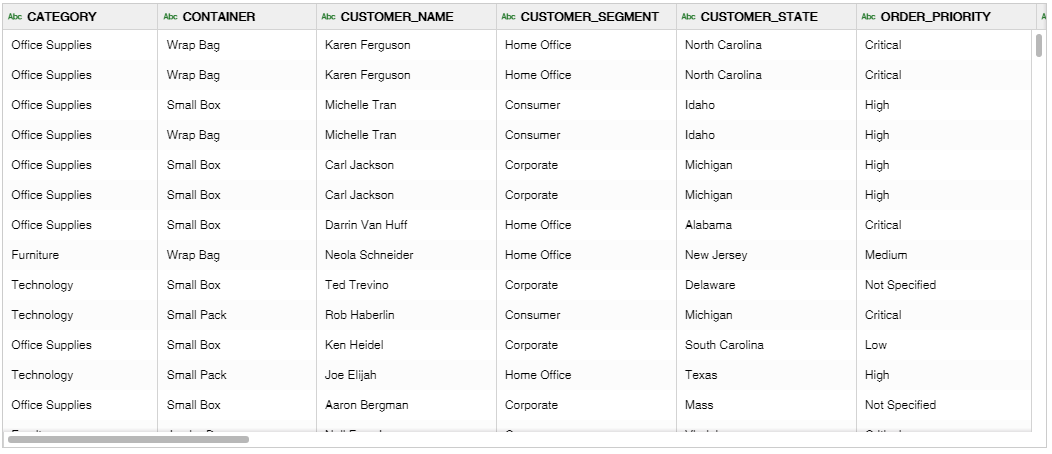
Preview the data before the PivotTable operation, as shown below:
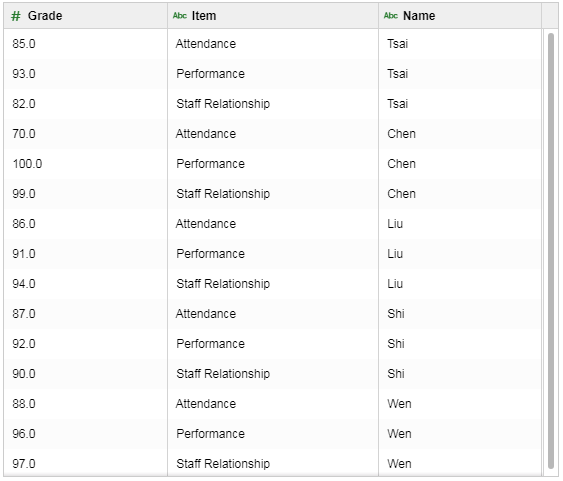
After the conversion of the PivotTable, the one-dimensional table becomes a two-dimensional table, and the preview data is shown below:
Self-Service Data Set Realizing Self-Service Data Sorting and Sampling
At the data preparation stage, the data can be sampled sequentially. The first N rows of data is sampled in ascending or descending order, that is, the largest or smallest data of the first N rows is extracted during data governance, which is convenient for subsequent data analysis and exploration.
MDX Expression Extending the Support Capability of Multidimensional Database
Extend the support of multidimensional database, which is convenient for strong IT and DBA users to create new MDX expressions.
Notes: ESSBASE doest not support MDX expression.
YHSQL Supporting Case When Sentences
YHSQL supports Case When sentences. The user can evaluate the list of conditions and return one of several possible result expressions in two formats of the Case function, simple Case function and Case search function.
Select the datamart data source and the SQL description is as follows:
select case
when PRODUCT_TYPE = 'Coffee' then '1'
when PRODUCT_TYPE = 'Tea' then '2'
else 'Other' end as COLUMN1,
SALES from "Self-service/coffee_sales.sqry"
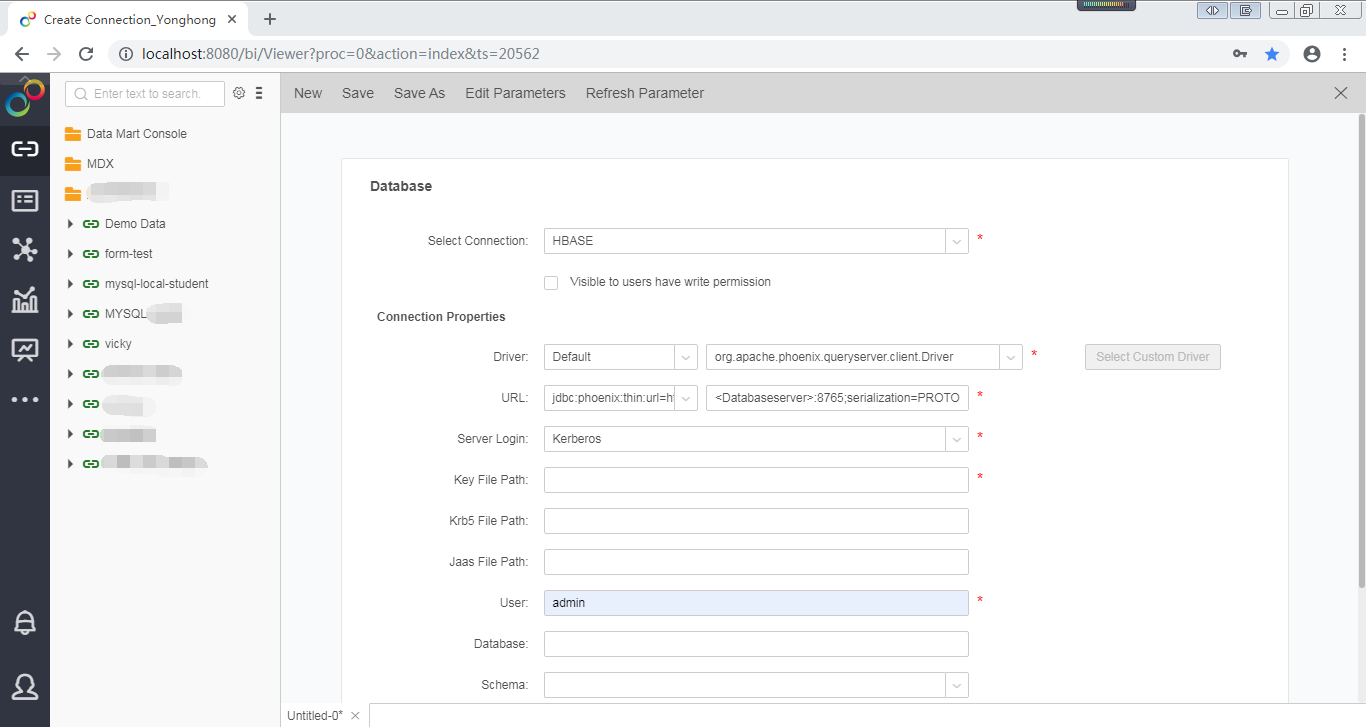
HBase Connection Supports Kerberos Verification Mode
A new Kerberos verification mode for HBase database enhances the docking capability of HBase database.
System Parameters Setting Supports to Configure the Amount of Exported Data
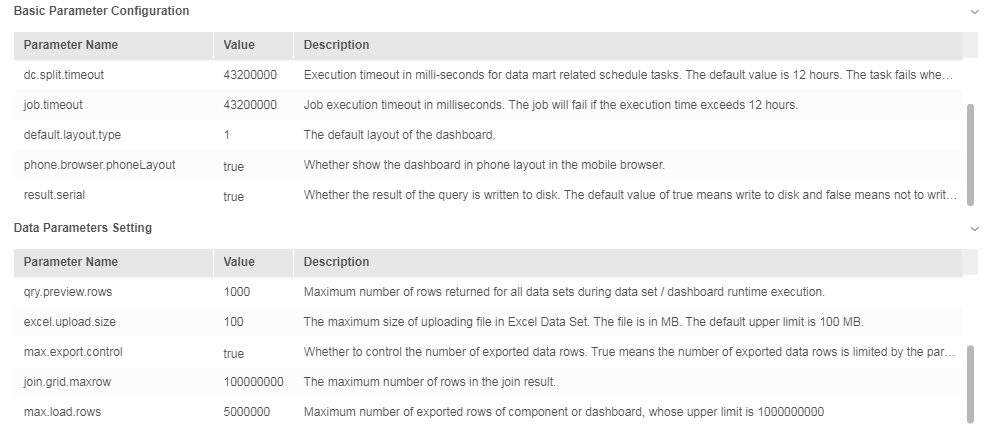
In the system setting interface, add the system parameter max-export. Switch controls report or component export.
The number of rows exported is controlled by the number of rows displayed by max.load.row. By default, true means control export, and setting as false means no control of export data, that is, full data.
Optimize the Setting of Database Column Aliases to Enable the Display of Aliases for Individual Data Sources
Optimize the setting of database column aliases to enable users to set “Display Aliases” separately for the following databases: ACCESS, DB2, DERBY, GENERIC, TERADATA, HANA, KINGBASE, MONGO, KYLIN, MYSQL, ORACLE, POSTGRESQL, PRESTO, SQLSERVER, SYBASE, VERTICA, ADS, GBASE, HIVE, SPARK and IMPALA.
However HIVE, SPARK, IMPALA show aliases only when a single table is selected. Other supported databases support both single tables and complex SQL.
Notes: HBASE, INFORMIX, and DATA MART do not support the setting of displaying list names
By default, check the “Display Alias” property. If no display is required, uncheck the property.

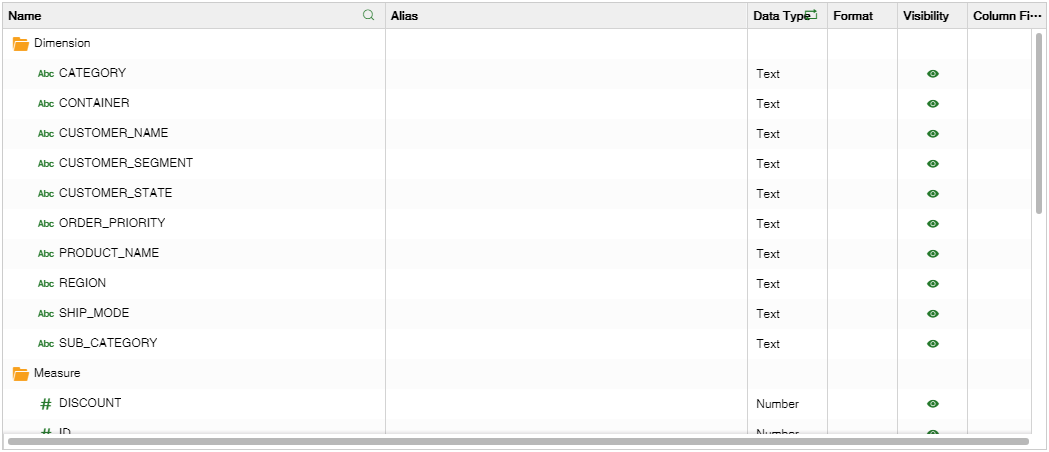
Optimize Display Order of Fields Which is Consistent in Meta Data, Detail Data, and Dashboard
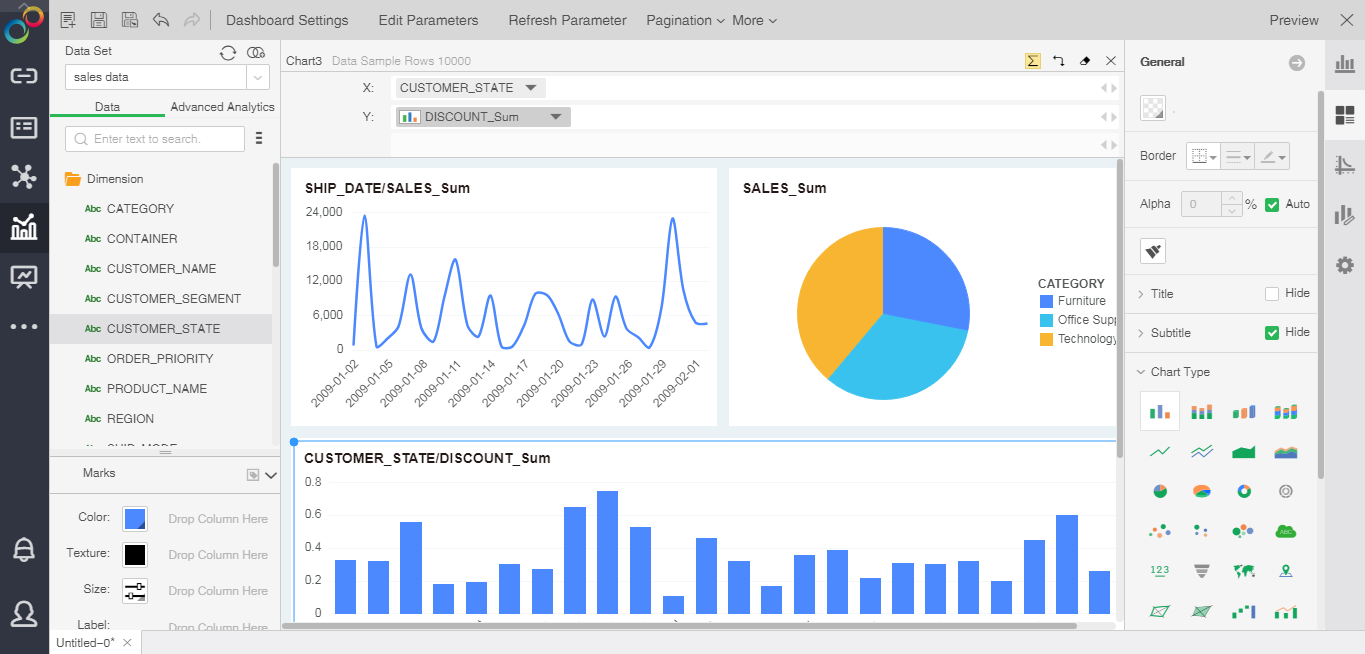
In data set, sort by rules in metadata area dimensions and measures respectively.
In the detail data area, as well as the left data area in the production report, the order of the fields is consistent with the order of the metadata area, so that the users can find the fields quickly.
The rules for regular fields are as follows: number first, then sort by character (case-insensitive sort by 26 letters), and finally Chinese.
2. Advanced Analytics
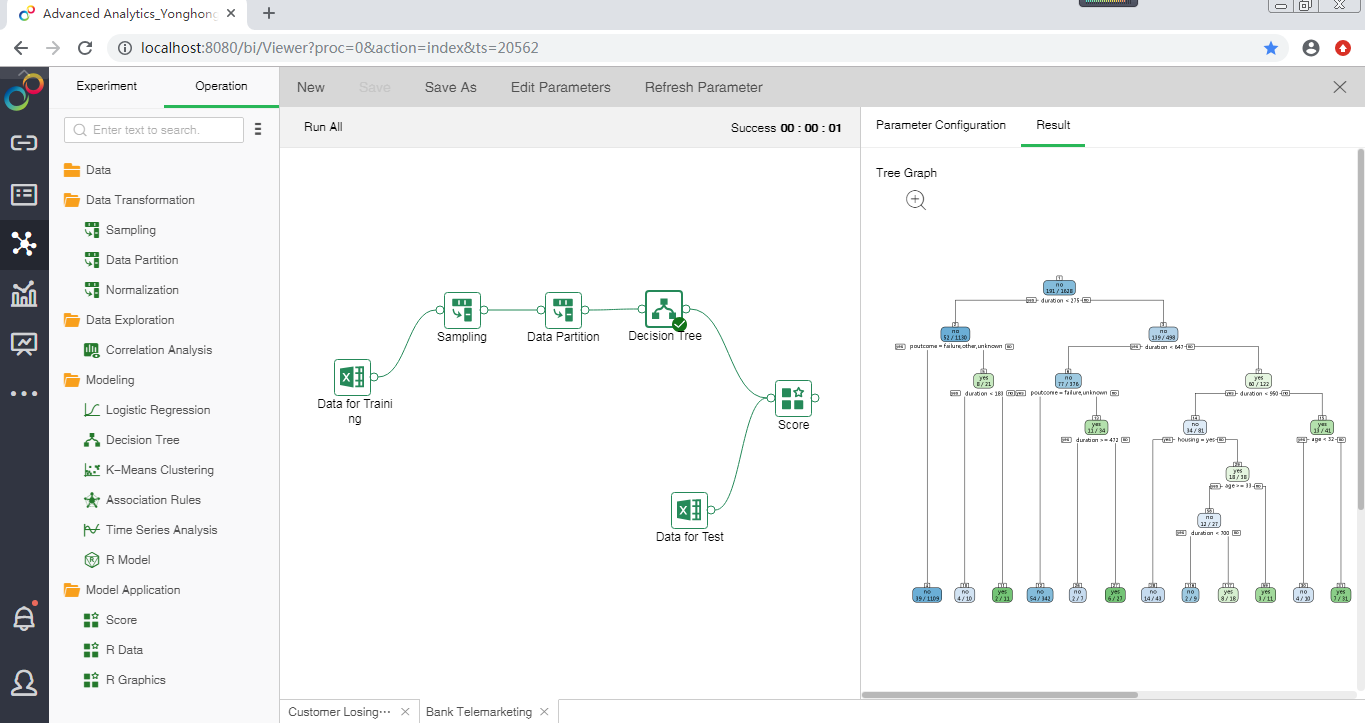
Support PMML Export to Facilitate Cross-Platform Deployment of Model Parameters
PMML (also known as predictive model markup language) is an instantiation standard for data mining. It uses XML format as the carrier to describe the data mining and statistical model, including the input of the model, the conversion used to prepare data for data mining, and the parameters to define the model. It orderly defines the criteria of different stages of data mining. Click "Export PMML" to export the trained model parameters to PMML. Other PMML compliant products or platforms can directly use it.
K-means clustering (Euclidean distance), logistic regression, decision tree, association rule, time series analysis, R model in Yonghong all support exporting PMML.
Enhance the Result Display of Association Rules
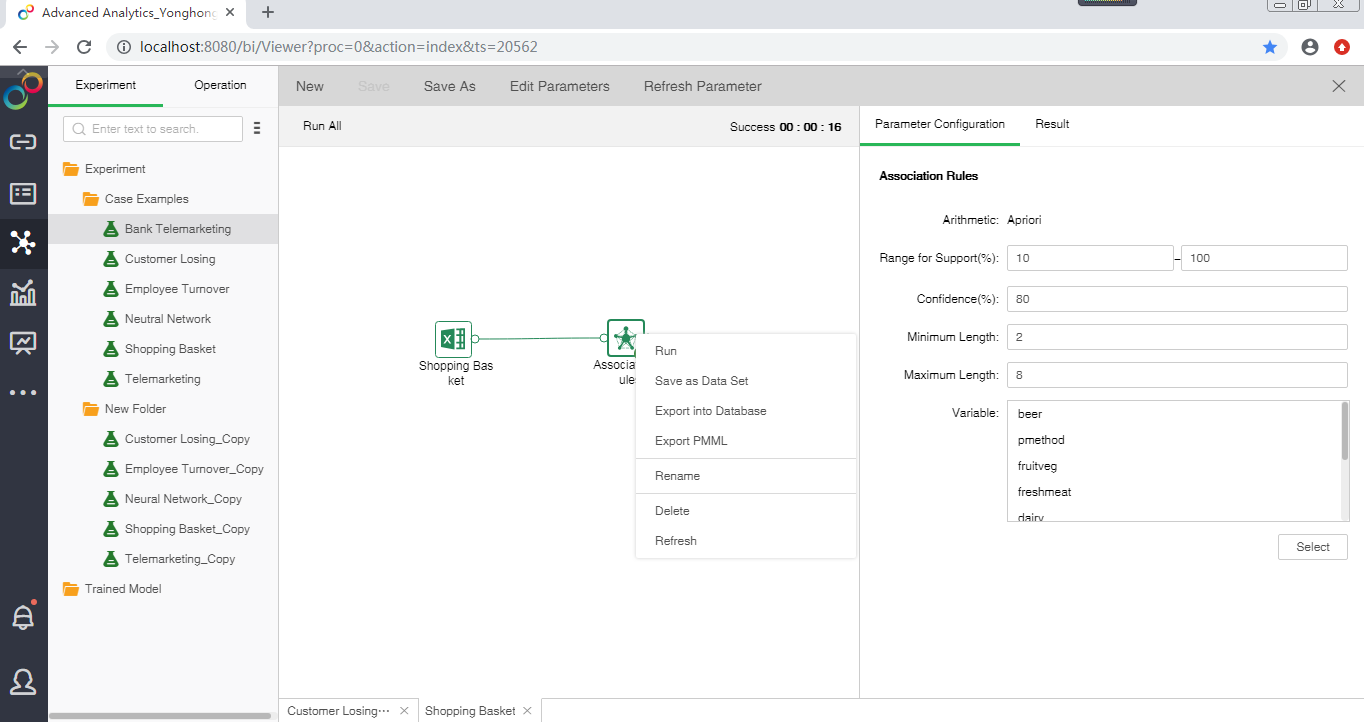
The result display enhancement of association rules includes two parts:
1. Support users to export the results to the data set and to the database to facilitate the user to use the result data for further analysis.
2. As a result of distributed association rules, confidence and lift are added to help judge the correlation between items in a scientific and comprehensive way.
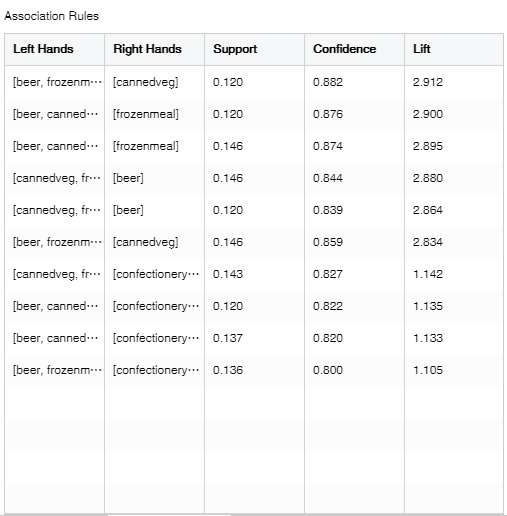
Correlation Analysis Result Supporting Excel Export
Yonghong supports correlation analysis of data and allows users to export correlation analysis result to Excel for further analysis of correlation results.
3. Dashboard
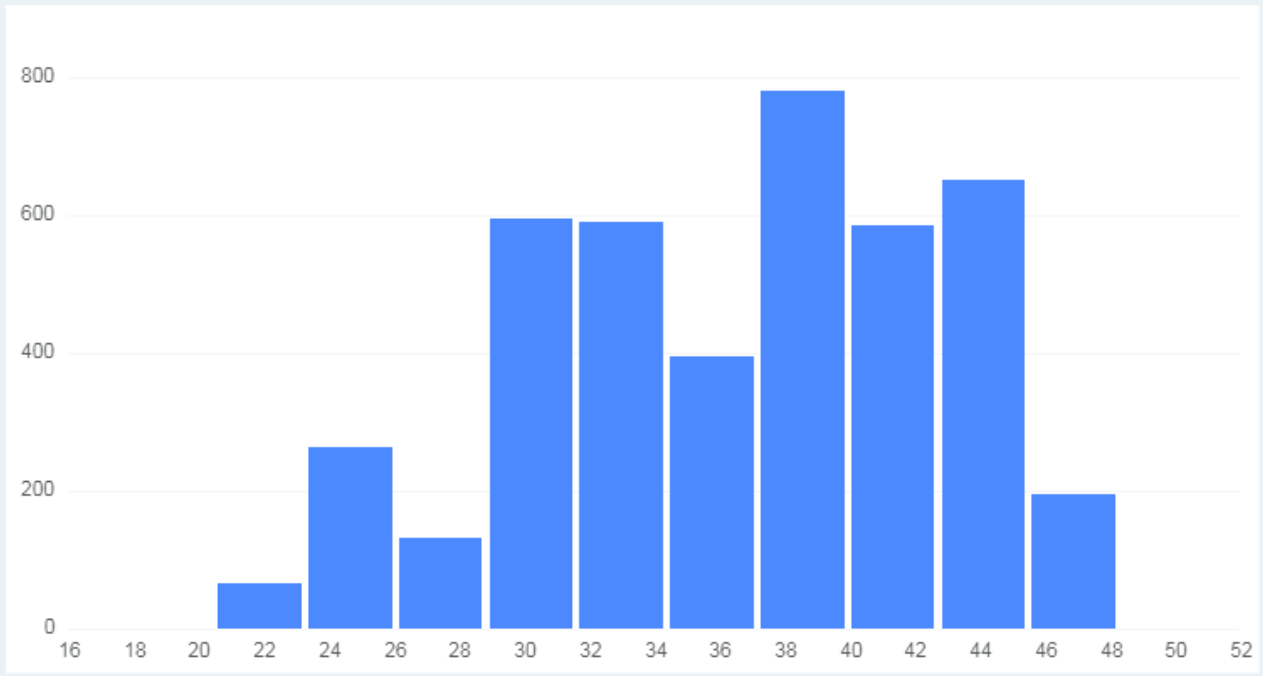
New Chart Type, Histogram, to Meet More Business Scenarios
The newly added histogram presents the frequency of each data group to help users understand the frequency distribution of each group and the frequency difference between each group. It is especially suitable for quality management to judge whether the production process is stable and predict the production quality.
When adding the histogram in the dashboard, it only needs to bind a measure, and the system will automatically calculate the maximum value, minimum value, group number, step size and frequency, and generate the histogram. Users can also customize histogram maximum, minimum and step size.
When a measure, one or more dimensions are bound in a histogram, multiple histograms are generated based on the number of the dimensions. A histogram does not allow you to bind multiple measures.
The histogram supports most of the same functions and settings as the bar chart. However, the histogram does not support negative pile-up, cannot adjust the size of the mark, and it only supports only one calculation method, count.
New Plug-in Chart Types to Meet More Business Requirements
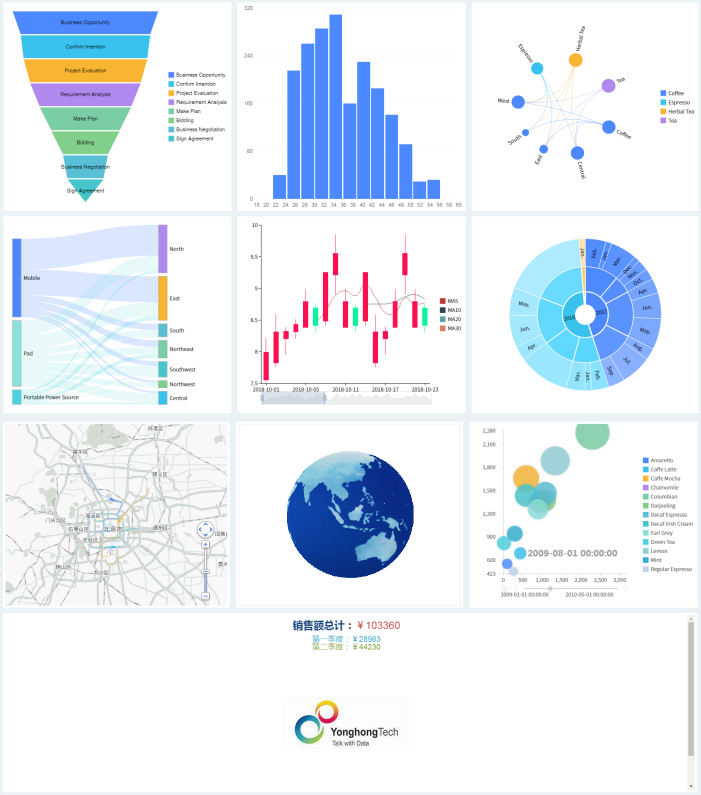
Yonghong supports plug-ins, which not only can support more rich chart types, but also can meet the visual presentation of different customers, especially the display needs in large screen.
In the new version, the plug-in charts includes funnel chart, sankey chart, relation chart, sunburst chart, 3D earth, K line, time track, trackmap, histogram and rich text (supporting parameters).
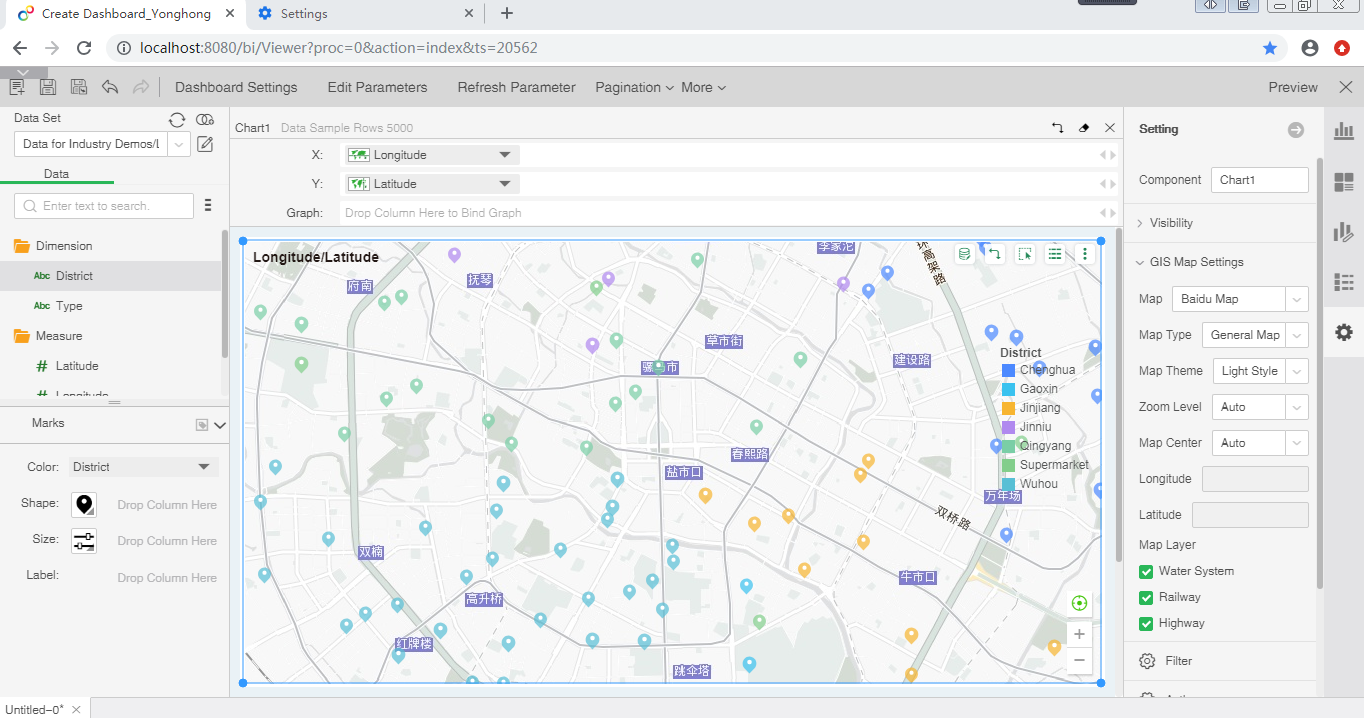
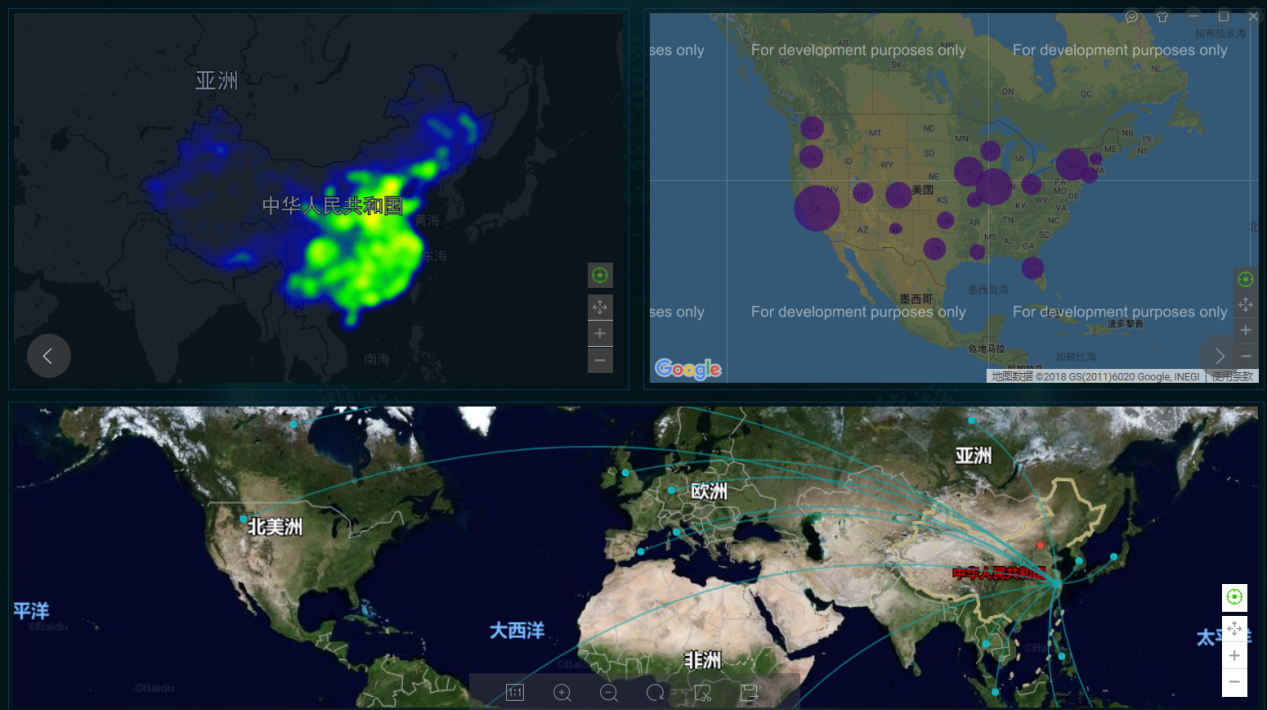
Support a Variety of GIS Map Servers to Enhance the Display Capacity
Other than the Baidu map, Yonghong adds support for AMap, Google and enterprise self-built map servers to meet the needs of different enterprise users for different map servers.
The users can switch map server and change GIS map style when using online Baidu map, AMap and Google map. However, if the user is configured with a customized map server (based on Bbaidu, Google, AMap), or is using an offline map (Baidu), the GIS map style setting cannot be performed.
Notes:
1. Administrators can configure the default GIS map server in bi.properties. Ordinary users can switch map server directly in the interface when making dashboards.
2. Yonghong supports enterprises to build their own GIS map servers. But the map engine that this server uses needs to be one of Baidu, Amap and Google.
3. Offline map only supports Baidu map currently.
4. At the same time, GIS map supports setting default level of granularity and central landmark to meet the needs of initial map display definition. User data may come from different geographic coordinate systems, which enables you to switch data coordinate systems in the interface to match different map servers.
Attention:
Yonghong only provides access to Baidu map, Amap and Google map, and does not provide permission to all the maps above. To ensure the normal use of Baidu map, Amap and Google map, please apply for a permit by yourself. If the user does not have the permit, the user shall bear the legal problems.
Scaling Analysis of Chart to Adjust Data Range Flexibly
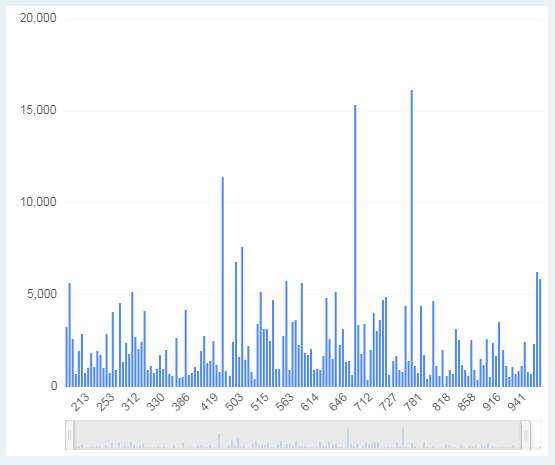
When the data items in the graph are too many and too dense, it is not conducive to the analysis of single or partial data items. To solve this problem, the new version provides axis range. The axis range provides a thumbnail of the chart showing the data trend. The users can use the axis range tool to not only view the overall situation of the data, but also narrow the axis range to see only the data within the range for specific target analysis.
Notes: The scale axis will automatically calculate the scale range based on the data and the width of the component.
No Need to Configure the Operation “Bind Data”, and the Data Location Can Be Flexibly Switched
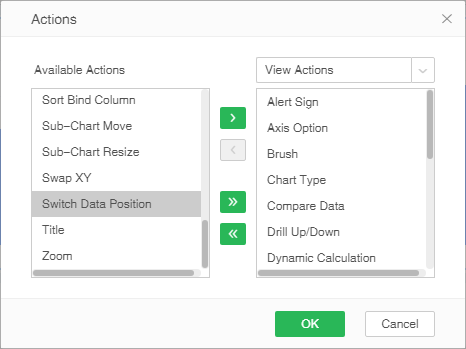
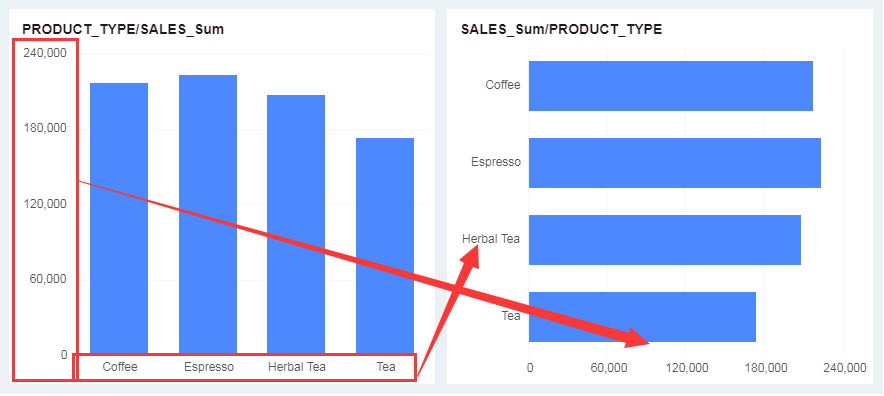
Add “Switch Data Position” component operation to enable the users to flexibly switch row and column axis, row and column, and change column position without “Bind Data” permission. This ensures that the viewer sees only the data has been bound to the component, while increasing the flexibility of its data analysis.
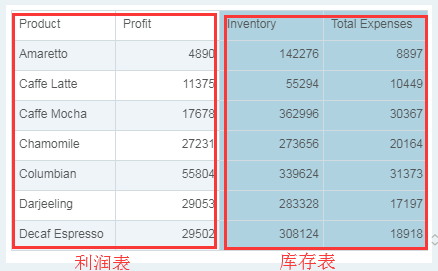
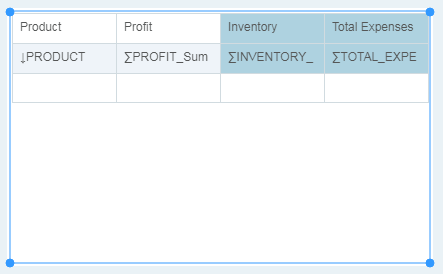
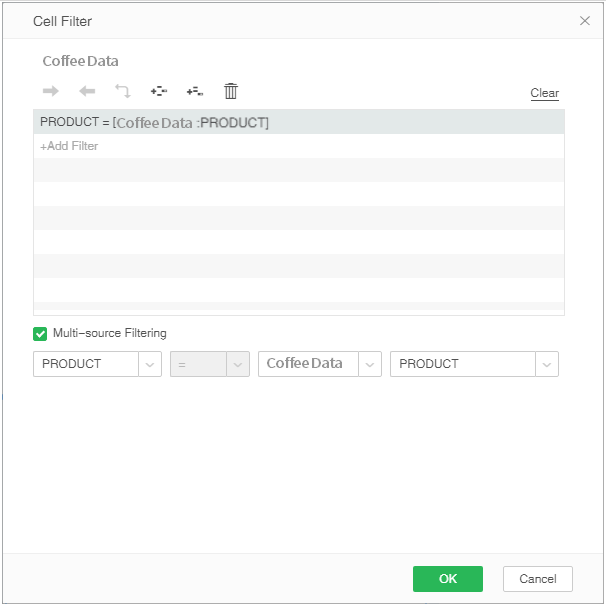
Enhance the Function of Freestyle Table to Display Multi-Source Data
The freestyle table supports data from multiple data sources, which is more consistent with the business scenarios of Chinese complex reports.
Match Ups and Downs Rendering with the Language Environment
For table rendering, version 8.5 has been optimized in two ways to improve the user experience.
•In order to take good care of the usage habits of English users, Ups and Downs Rendering is changing with the language environment, .
When the user looks at the English interface, the color of table ups and downs rendering changes to “Green Goes Up, Red Goes Down” intelligently, so as to meet the habits of users in the United States, Britain, Singapore and other English regions.
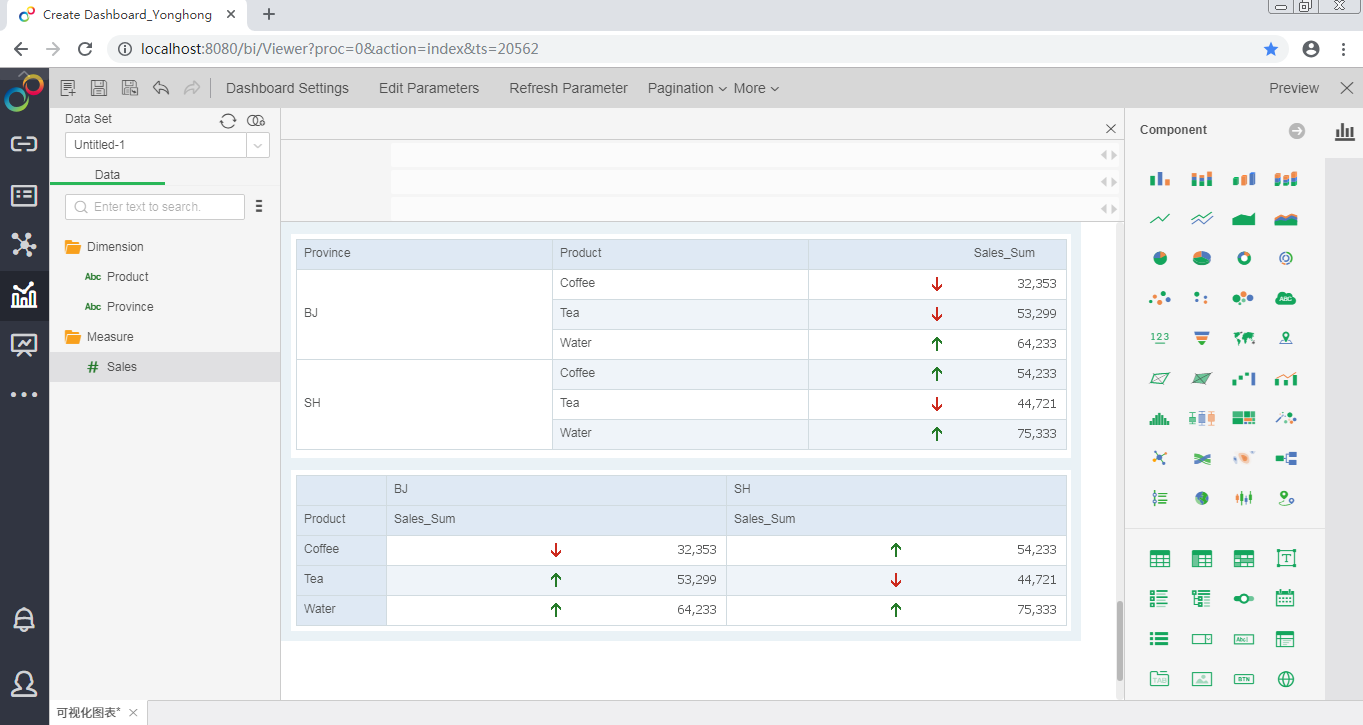
•Optimize the display of table rendering, and still use the original background color after rendering.
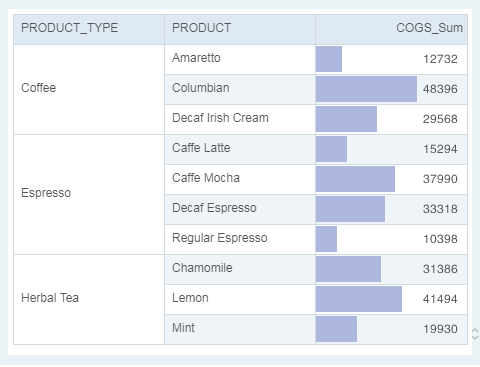
Table rendering effect does not affect the original table color.
Real-time Monitoring of Business indicators, and Push the Abnormal Situation to Staff
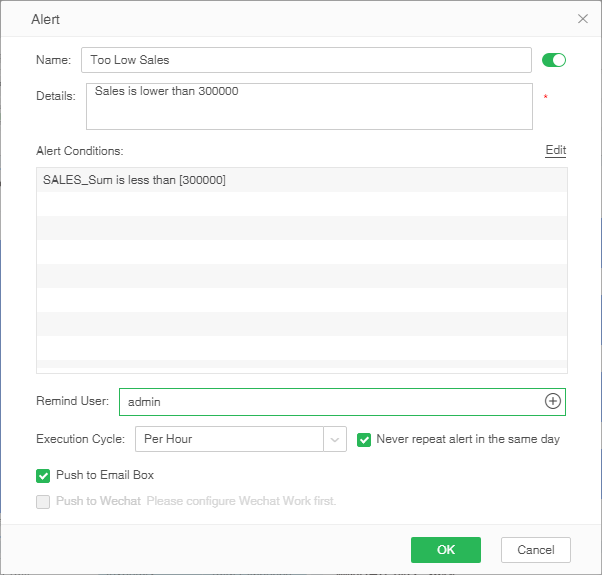
By setting early warning conditions for the specified business indicators, the users can know the abnormal situation of the business indicators at any time and deal with it timely. According to user-defined conditions, when the business data is greater than, less than, equal to a certain value, or in a numerical range, the system will push the information of the business data to the designated users through the message center on the PC side, the message center on the app side, the email, or the enterprise WeChat so as to realize real-time monitoring and dynamic warning of the business indicators.
Share Dashboards to Specific Users to Enhance Collaboration Within the Team
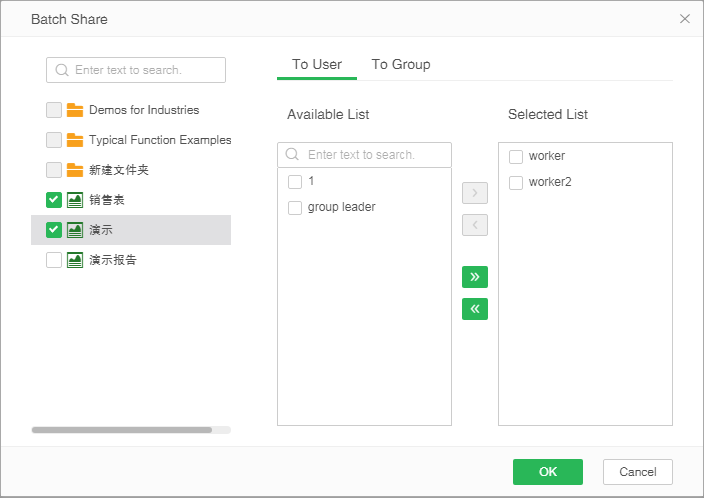
The new sharing function enables the users to share dashboards to specific users and departments within the company, or to designated email address. If you need to share more than one dashboard, you can adopt “Batch Share”.
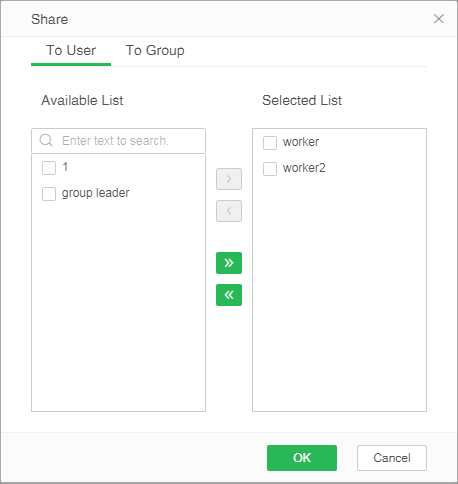
The dashboards shared by others will be placed in the “Shared Dashboard” folder for the users to view by category. The users can not only view the dashboards shared by others, but also edit and save the dashboards, and then share them out.
When a sharer withdraws his share, others cannot continue to view the dashboard.
The sharing of dashboards is strictly controlled by the permission. Only the users who have “Share” or “Mail” permissions can share accordingly. After receiving the dashboard, the users can only see the data and resources authorized.
At the same time, the system will also monitor the users' sharing behavior, and record in the “User Actions Information Monitoring Statistics” table.
Add Frequently Used Dashboards to Favorites
Favorites folder enables users to favorite frequently viewed dashboards. The users do not need to remember the access path of commonly used dashboards, which greatly facilitates the view of dashboards.
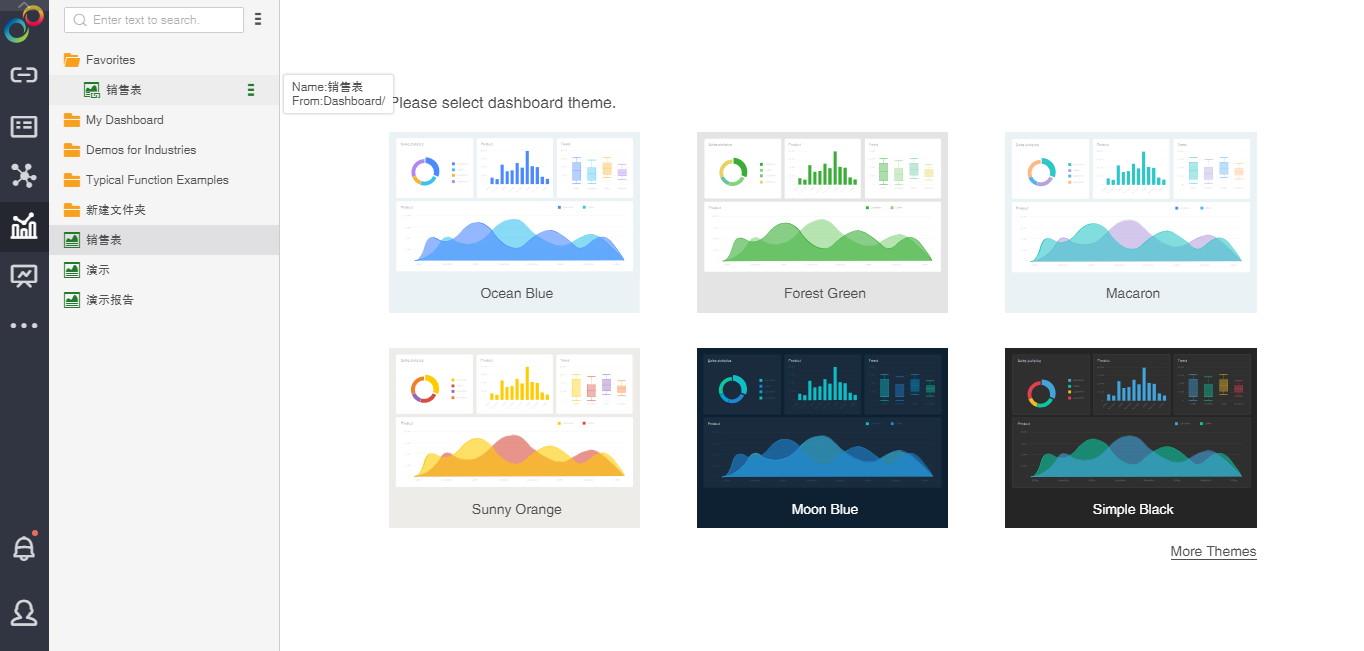
Display the Field Name When Hovering over the Field Alias
When an alias is set for a bound field, it is often difficult to tell which field it is originally. Version 8.5 adds a hint for the original name of the field to help the user identify the field bound by the component.
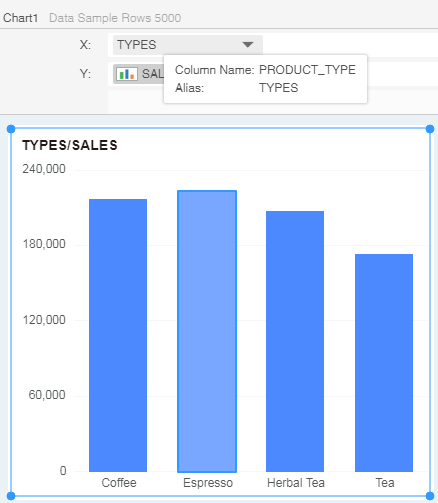
Optimize the Subscription of Dashboards to Improve the Operation Experience
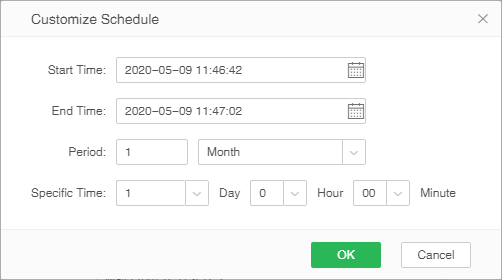
Optimize subscription settings and operation guidance to make dashboard subscription easier to use. In the new version, the users only need to select the period of subscription, the frequency and time of sending subscribed dashboard to complete the dashboard subscription easily.
Notes: The minimum subscription interval in the new version is 1 day, and it is not supported to send a subscription email every N hours and N minutes in the same day. If the user has the need to send messages every N hours, it can be achieved by scheduling tasks. Plan to support hourly subscription in version 8.5.1.
Download Queue Mechanism to Improve User Experience and System Stability
New version adds the download queue mechanism. When the exported data volume is too large or data query timeout, the system will turn it into the download queue and the users can manage these download tasks in Schedule Tasks. The result of download task will be notified to relevant users via message center or email. The tasks in Schedule Tasks will be deleted automatically after 1 month by default, and Schedule Tasks support batch editing of some information.
In addition, when data query timeout, the result set of the query will be transferred to the download queue to reduce the waiting time in the foreground.
The downloaded data files are stored at the specified path, and the user's storage space can be controlled by configuration. When the user data is full, the user could clear the selected data by the custom developed management page. In the future, it plans to clear all data with one click.
Parameters description:
req.timeOut=0 // query request timeout, unit ms.
req.trans.export.path= // the file directory after the query request has timed out. Default directory is /YHDownload, at the same level with bihome
req.trans.job.user.space=500 // the default size of disk space per user is M.
req.trans.job.interval=0 // time interval of the download tasks. If the interval between two tasks does not exceed a certain period, the old task will be flushed out by the new task.
req.trans.max.jobs=0// the maximum number of queues required to perform the export task.
trans.to.job.req=all //all (default): Both data query and data export support the download queue; only data export supports the download queue; only the data query supports the download queue.
Job.timeout=43200000// job execution timeout, unit milliseconds. By default, when the execution time exceeds 12 hours, the job will fail.
clean.download.jobs=true// default value is true, which means the jobs will be automatically cleared after 1 month, and the false means never clean the jobs.
Support Image of Format WebP to Improve Image Loading Performance
When making the dashboard, the users can add pictures of format WebP. WebP images not only take up less storage space, but also shorten loading time, and speed up page loading to ensure the efficiency of user access to the dashboard.
Notes: Only the Google browser supports WebP images.
Friendly Message Prompt to Recommend the Best Suitable Browser
Through friendly message prompt, recommend the user to use the appropriate browser to ensure the best display effect. When the user first logs in to the homepage, the current browser is checked. If an unofficially maintained browser or browser version is found, the user is prompted to use the appropriate browser or browser version. If the user doesn't want to see the prompt again, check “No More Pop-ups”.
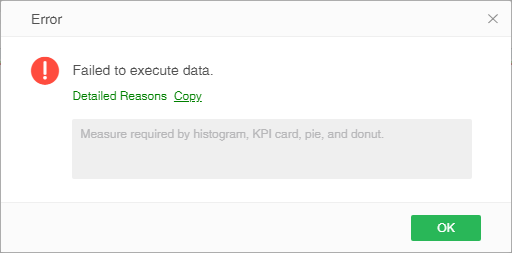
Display error reasons, guide the users to solve the problem of error better
When the system reports an error, it will display the cause of the error, help the user to understand and give feedback to the service personnel, so as to quickly solve the problem.
4. Enterprise Management
Integrate Enterprise WeChat to Receive Alert Messages & Task Status in Real Time
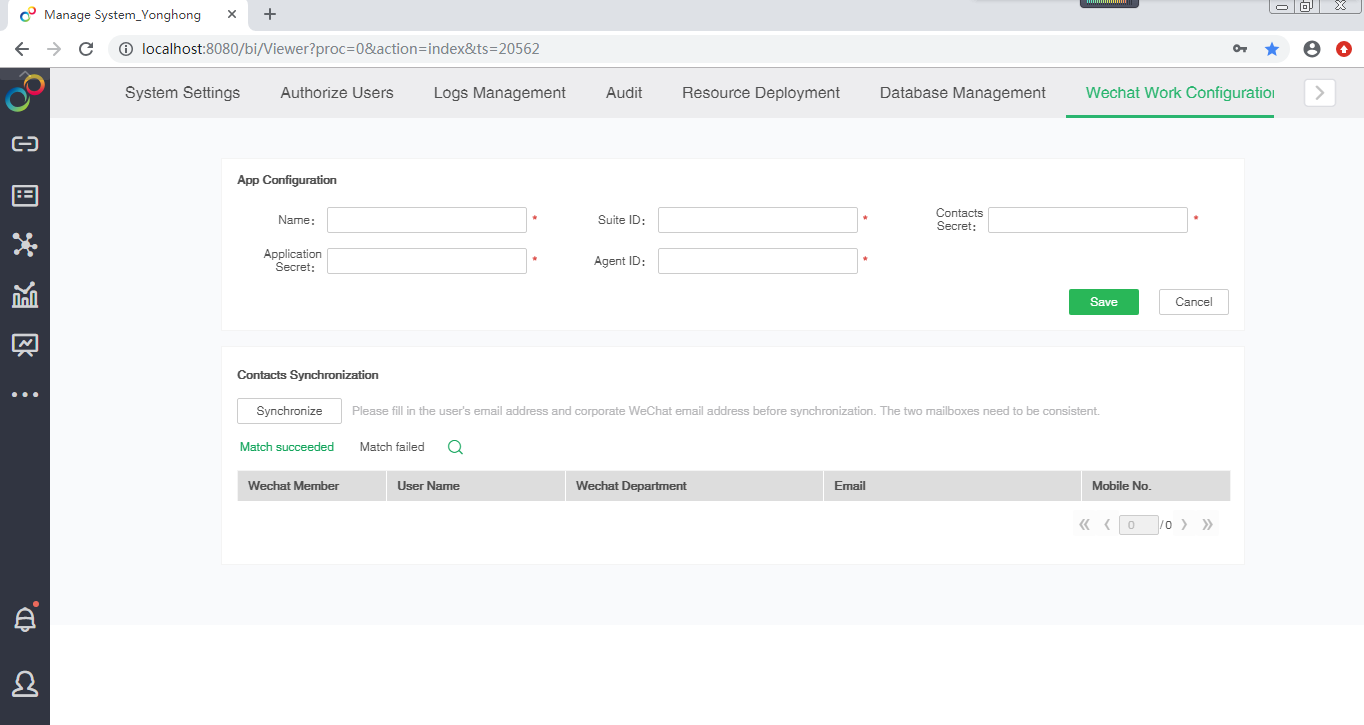
Yonghong Z-Suite integrates enterprise WeChat to enable the users to open Yonghong's enterprise application in enterprise WeChat and receive messages. Users can receive the messages about abnormal business indicators, abnormal system status and the result reminder of the scheduling tasks in the enterprise WeChat, so as to ensure that the users can receive the information in time and master the business and system information at any time.
Before the enterprise WeChat is used to receive messages, the administrator needs to make necessary configuration, including getting the enterprise contacts which records the WeChat member name, account number, department, mailbox and mobile phone number, and match the members' mailboxs in the system with those in the enterprise Wechat. If the mailboxes are consistent and the match is successful, the user can receive messages in the enterprise WeChat. If the mailbox match fails, the administrator can also manually match them.
Notes:
1. If the data space is not configured or use the No Security System, the configuration of enterprise WeChat cannot be conducted, and relevant functions of enterprise WeChat cannot be used.
2. Only the enterprises with enterprise WeChat accounts can use relevant functions of enterprise WeChat.
System Alert Platform -- Monitoring System Status and Timely Send System Alert
To ensure the stability and efficiency of the system, Yonghong Z-Suite will conduct real-time or periodic monitoring of important system indicators. Moreover, it will send abnormal conditions of the system to the administrator and other designated users, groups and roles through the message center on the PC side, message center on the app side, email or enterprise WeChat, so that the operation and maintenance personnel can deal with the system problems in advance and ensure the stability and high performance of the system.
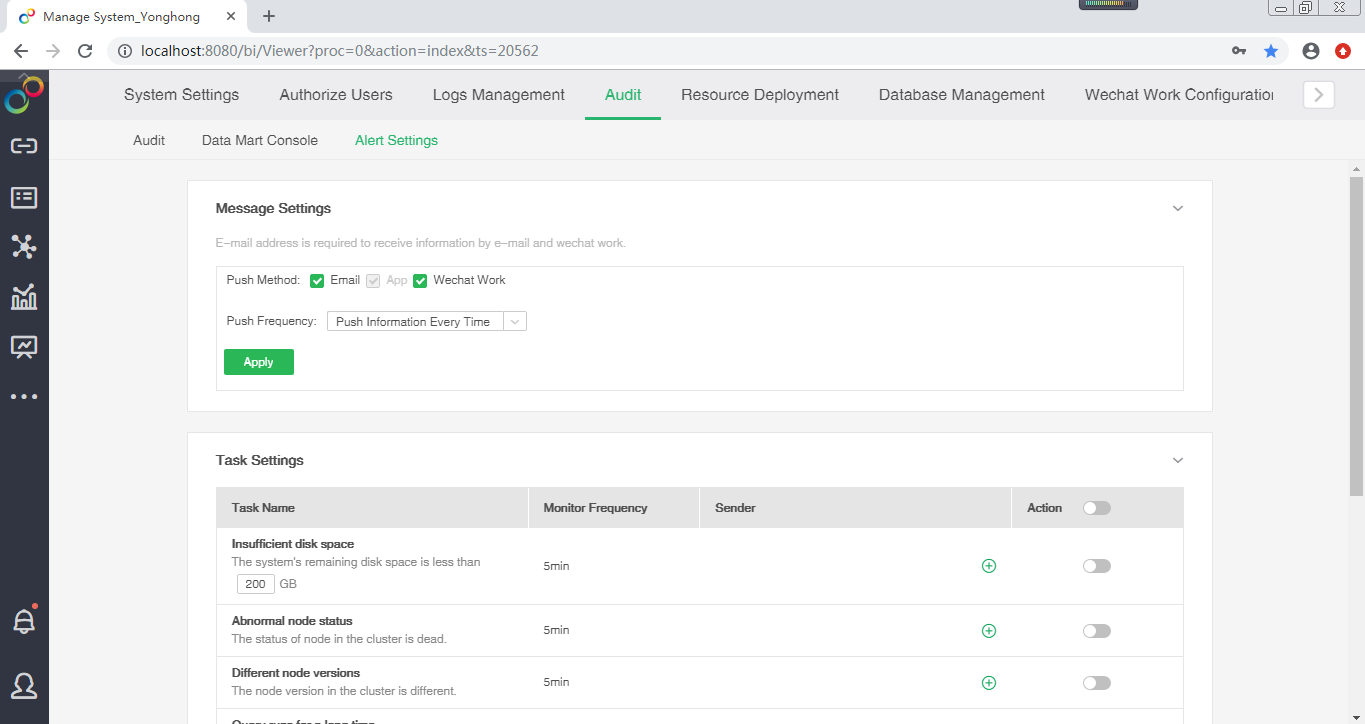
System indicators to be monitored include: disk space, node status, node versions, query run time, CPU utilization, network outages, database outage, number of concurrent users, and FullGC.
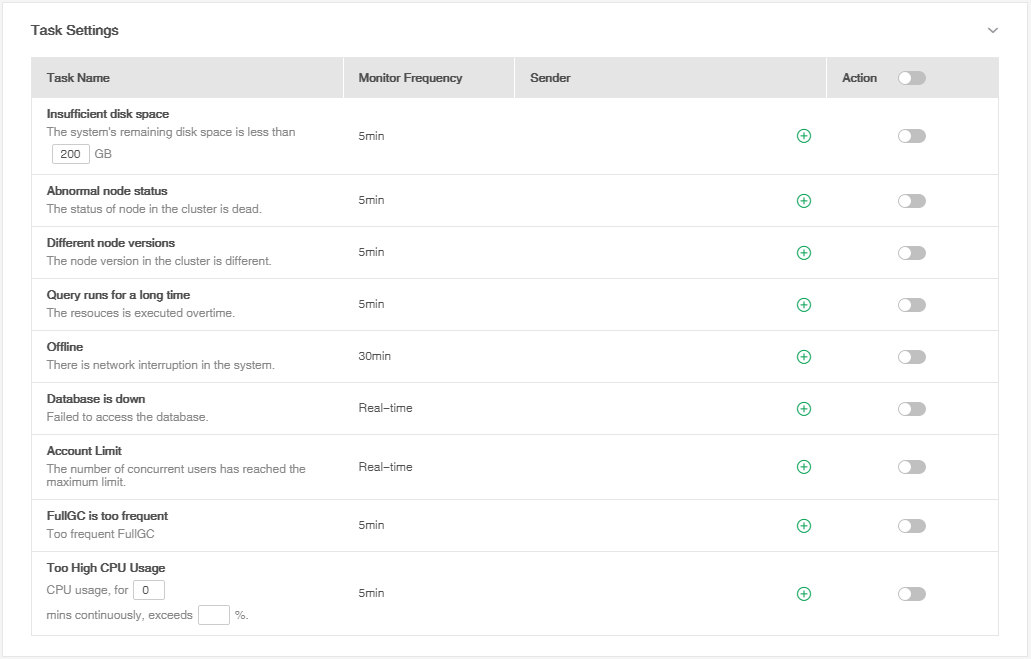
If there is an unread message, the user can see a prominent unread message reminder on PC and mobile. Open the message center, you can view the details of the message one by one, or you can mark all messages as read with one click. And the message status is synchronized in real time between PC and mobile terminals. By default, these messages are kept forever. The users can also control the number of days a message is saved by adding the parameter msg.keep.days= in bi.properties.
For the stand-alone version (that is, the local mart), the monitoring data can be stored either in the configured database or locally. For multi-machine version (that is, MPP mart), if it is a file system, it is stored locally by default. If it is a database system or a shared file system, the user must first configure the monitoring database in the system settings before using the monitoring and alert function.
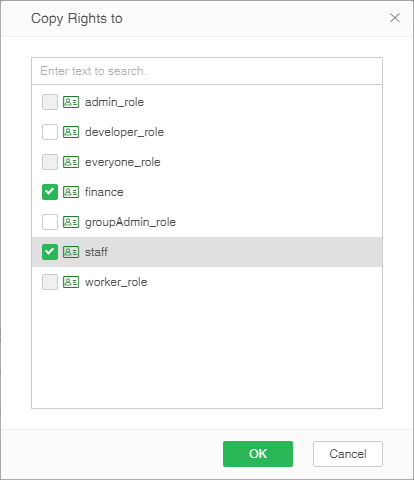
Role Replication Capacity Facilitates the Authorization For Resources and Operations
In order to increase the ease of authorization and avoid the confusion of role inheritance, roles are no longer allowed to be assigned in the new authorization system.

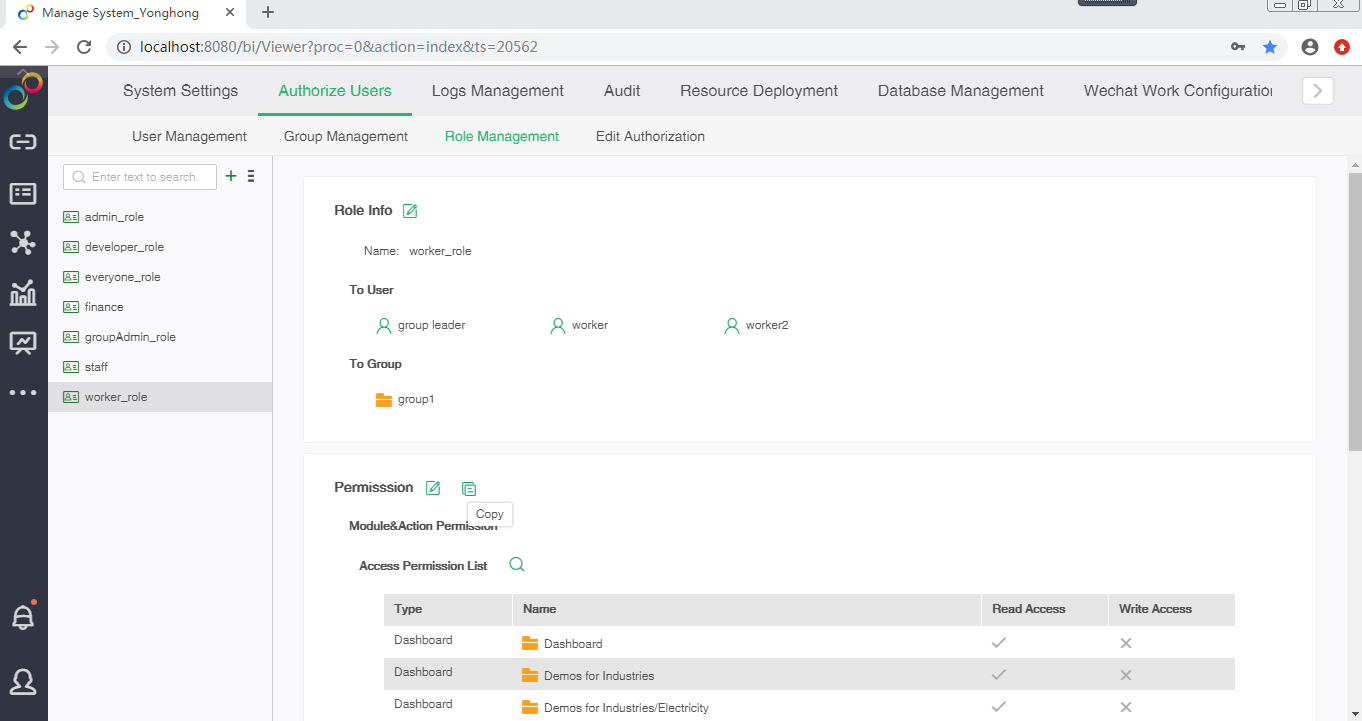
If you need to add permissions for a role in batches, you can copy the permissions of one role to another role through the role replication function, which greatly facilitates the allocation of permissions. However, admin_role and roles with empty permissions are not supported for replication to other roles. Furthermore, a group administrator (groupadmin_role) can only replicate roles created by himself or other group administrators in the same group.
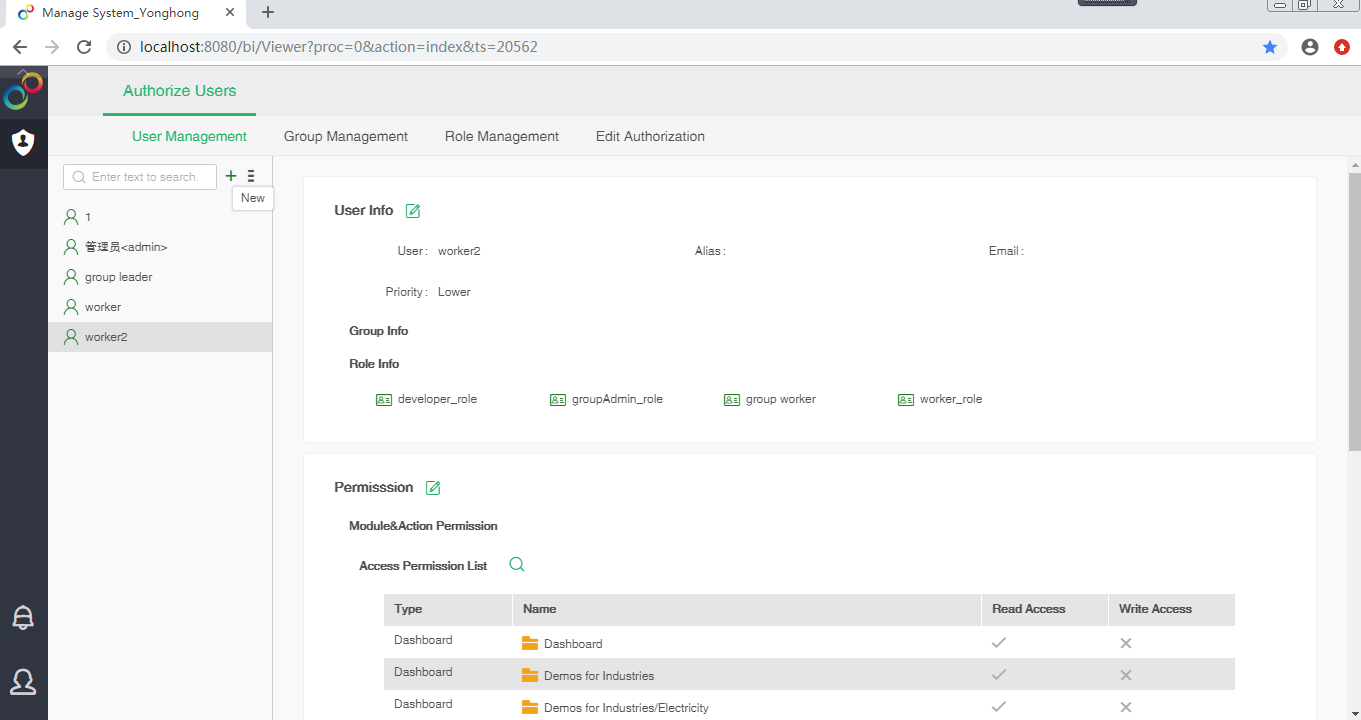
Optimize the Management Behavior of Group Administrators, and Implement the Management of Users and Authority into Groups.
In the new version, the group administrator has the permission to create new roles, edit roles, and assign roles to group members. For large and medium-sized enterprises, it enables the group administrator, who is more familiar with the group, to manage the members and their permissions within the group, and avoids that the permission management is not timely and in place due to huge organizational structure.
5. APP
Easily Manage Server Addresses
The new version not only optimizes the function of adding server, but also adds the function of deleting server address, which is convenient for the users to manage the server address.
When the users need to add a new server connection, they can directly enter the server address, or scan the QR code of the server through the “Scan” function.


When the user no longer needs an existing server connection, the server address can be deleted through the delete function.

Considerate Password Management Ensuring Password Security
Yonghong mobile terminal provides a more considerate password management, which not only supports gesture password, but also allows the users to change their passwords.
The combination of convenience and security is realized by using gesture password for login authentication. After the user sets the gesture password on the mobile terminal, the next time the app is opened, the user can directly enter the homepage through the gesture password. There is no need to enter the account password.
Notes: After the user logs out after logging in, the next time you open the app, you must enter the account password to enter the homepage.


Whether it is the account password login or the gesture password login, the users can change their login passwords at any time or regularly to avoid password leakage and ensure data security.
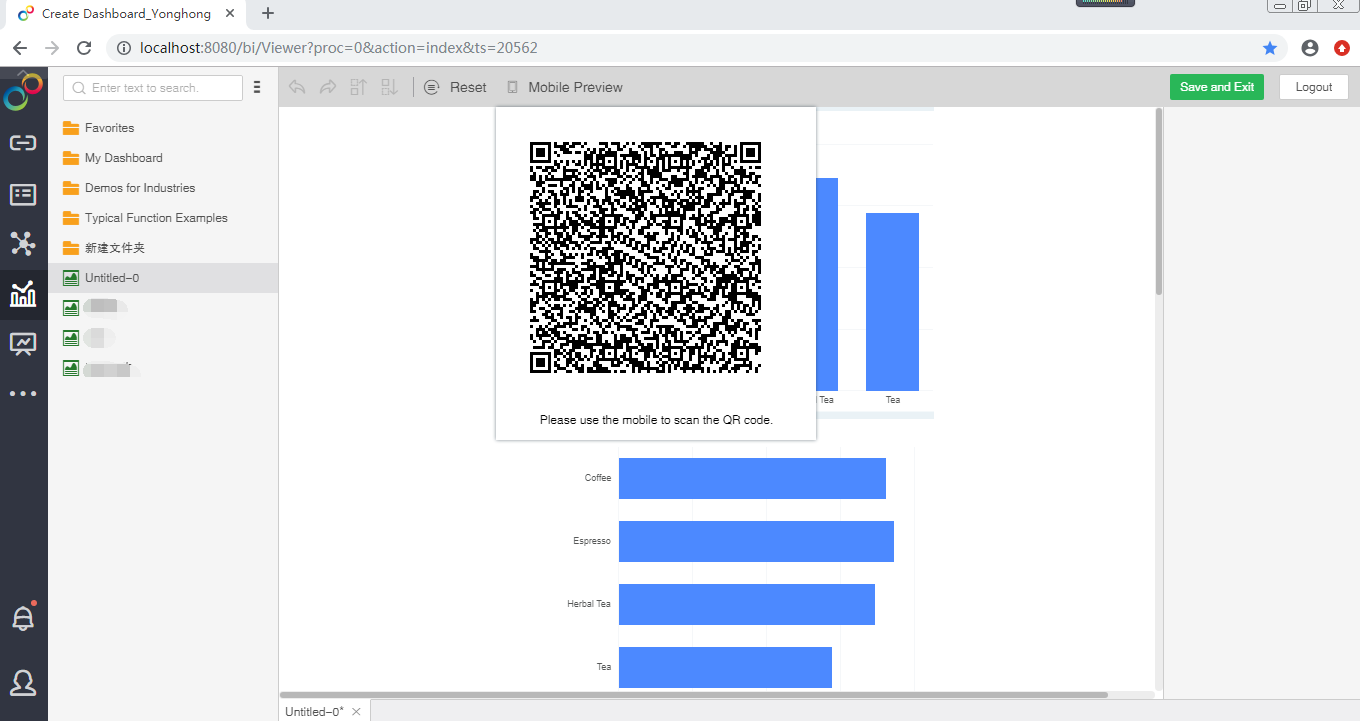
Support Scanning QR Code to Preview the Dashboard, Which Make Mobile Layout Adjustment Easily
When the users adjust the mobile layout of the dashboard, they often do not know how to check the actual effect of the dashboard with the mobile phone. With the mobile preview function, the users can directly scan the QR code with mobile phone when adjusting the layout of mobile phone, and directly view the actual display effect of the dashboard on mobile phone. It is convenient for the dashboard developers to adjust the layout of the mobile phone according to the actual display effect.
JS Script Preloading Mechanism Improving Dashboard Loading Performance
The mobile terminal loads JS scripts in advance to improve the dashboard opening speed and increase user friendliness.
Paging Table on App Improving Query Performance
When view table in full screen with the mobile app, the data is queried in pages, which improves the query performance.
Add Favorites Page at Mobile Terminal to Collect the Favorite Dashboards
All collected dashboards are displayed on the Favorites page. There is no need to search for the collected dashboards from all dashboards.

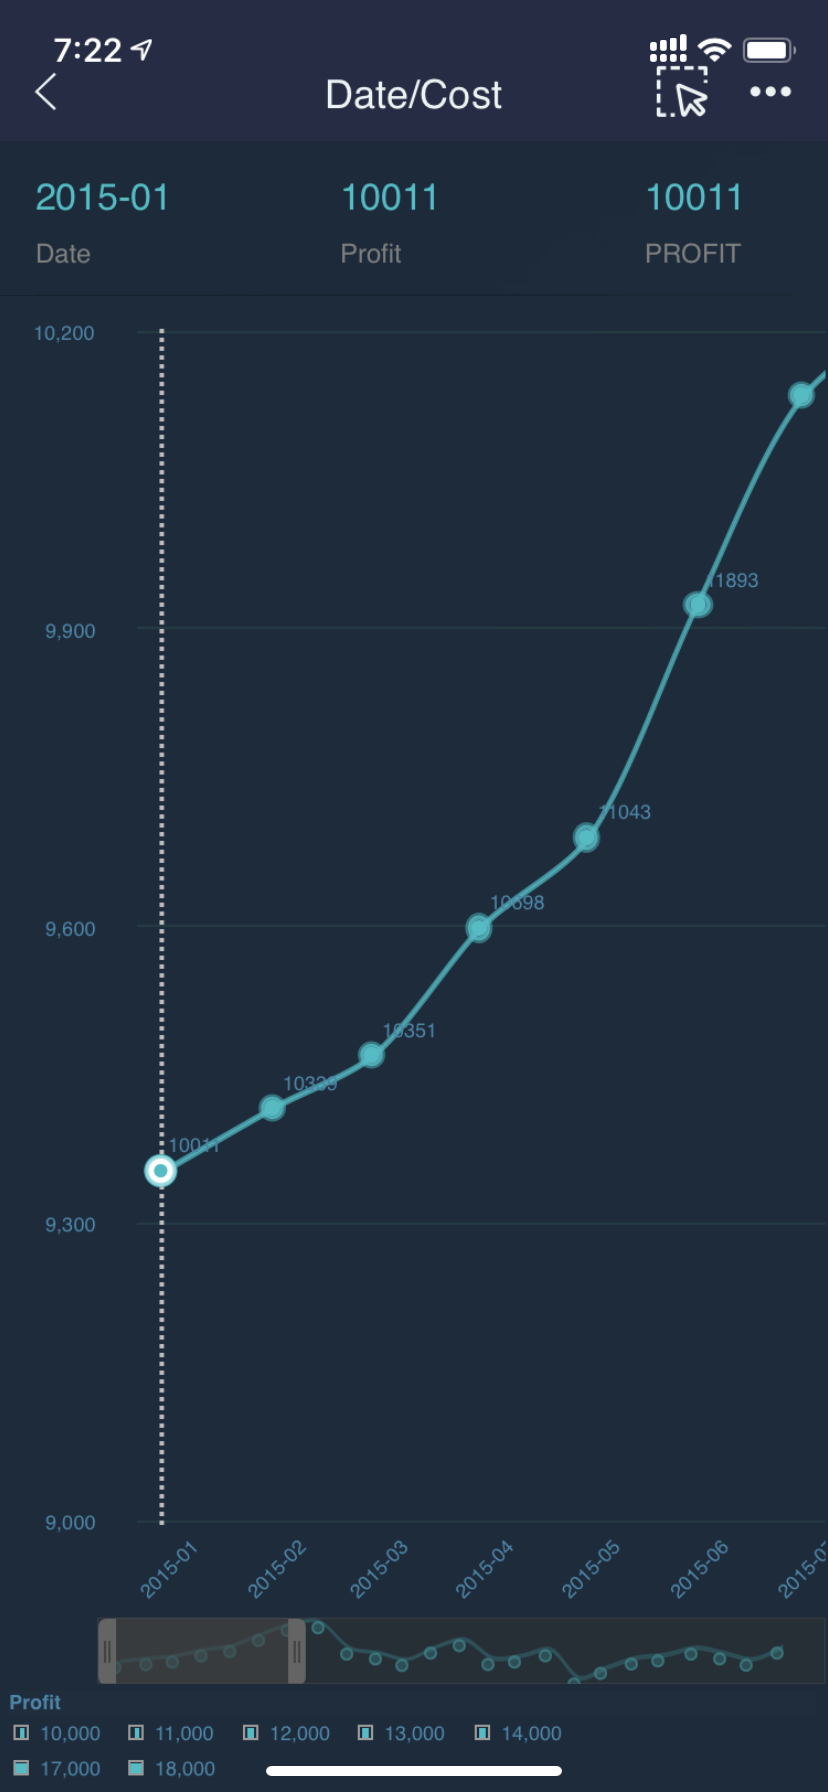
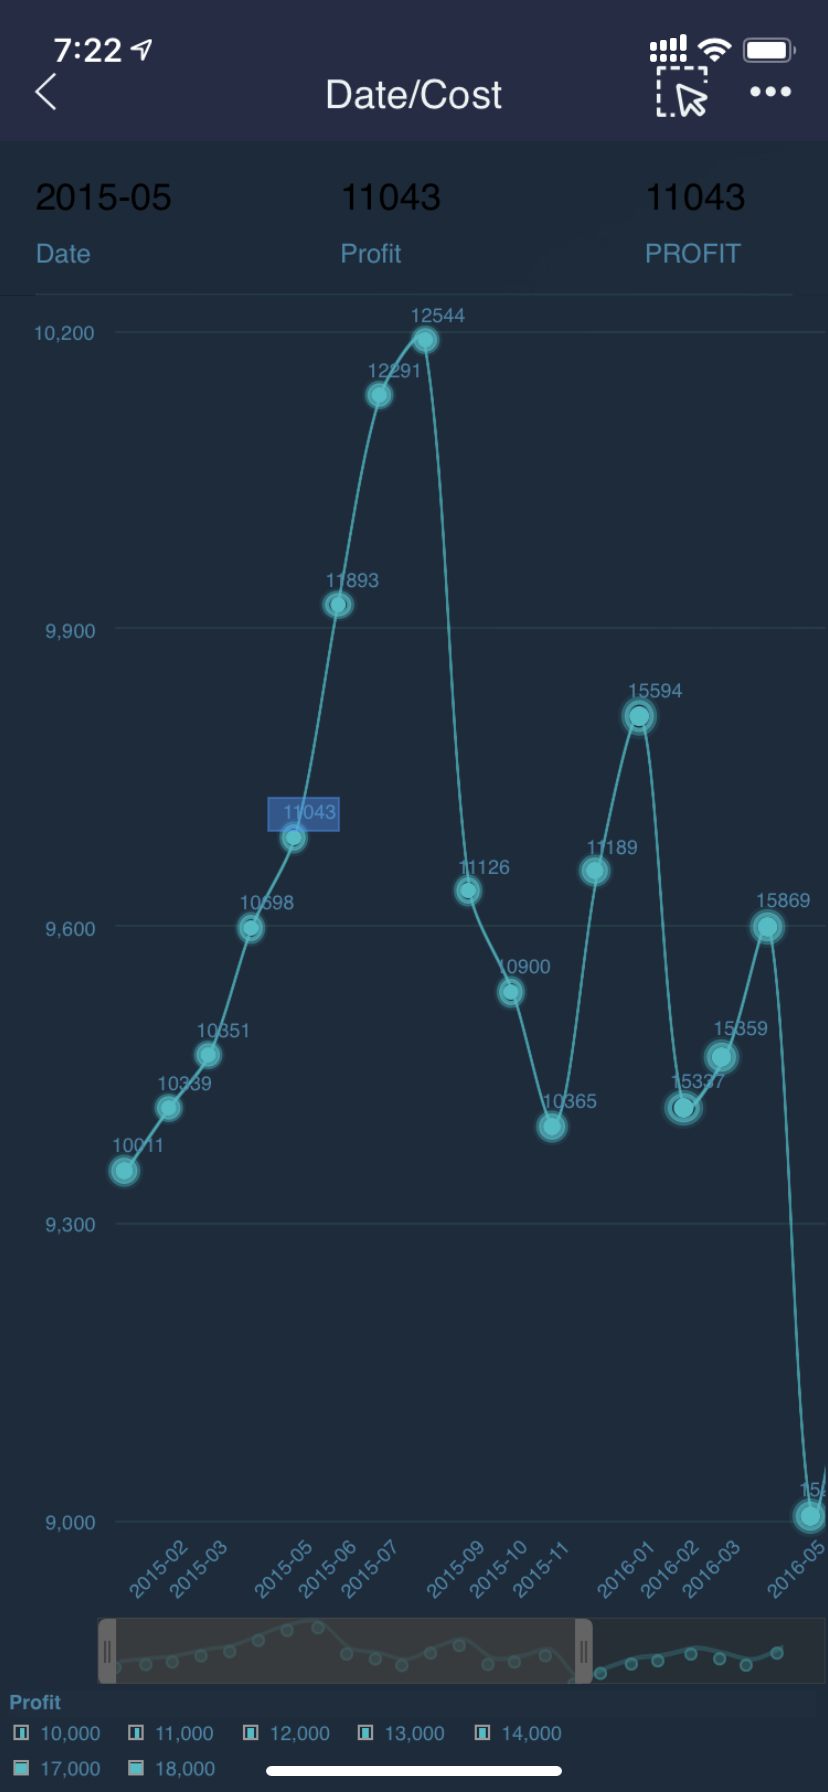
Graph Supports Scaling Analysis, and Even Better Finger Zooming Experience
In the full screen state of the chart, you can scale the display range of the chart by swiping your finger. The operation is more flow.
6. BIG DATA
Support Flexible Setting of Precision of Data Mart, and Obtain the Double Win of Storage Space and Computing Precision
Yonghong data mart supports setting the precision of each field separately when saving to data mart, which not only ensures the requirement of calculating precision, but also saves the storage space. When materialize data set or incrementally import data to data mart, the user can set the data precision, and the system will detect whether the precision is consistent with that previously set.
If the user sets the precision for a field, the data is stored with the same precision as the user required. If the user does not set the precision for a field, the default global data precision is used to store the data.
Support Storing Data Boundary Values
For the mart data, the boundary values and null values are stored correctly to prevent the boundary values in the data from being incorrectly treated as null values.
High Precision Computation Is Supported to Ensure the Accuracy of Large Data Aggregation
The accuracy of calculation is improved without sacrificing performance. Not only the results of big data aggregation are within the precision range required by the users, but also avoid sacrificing the computational performance due to pursuit of high accuracy.
Optimize Aggregation Calculation Performance and Ease Memory Pressure
Multiple Reduce nodes participate in the aggregation calculation, and the results are returned to the client node for the results merging. In this way, not only can the parallelism of calculation be improved and the pressure of memory consumption of Reduce nodes be alleviated, but also the stream-processing effect be achieved and the single Reduce calculation result be returned to the subsequent calculation in time.
Notes: By default, it is still the single Reduce node that participates in the aggregation calculation. If more Reduce nodes are required, add parameter _RED_TASK_COUNT_ (default value is 1) in the data set or dashboard module. This parameter value represents the number of Reduce nodes involved in the calculation. The premise is that the user has enough Reduce nodes.
Manage Memory Objects to Improve System Stability
By means of different methods such as exchange mechanism, total memory limit and statistics of memory usage, the large memory objects generated in the calculation process are managed uniformly, so as to avoid Full GC and memory overflow in the calculation process as far as possible and ensure the stability of the system. At the same time, memory object management helps to quickly find the computing tasks that take up too much memory and helps customers optimize their computing scenarios.
Store Metadata Information Seperately to Ease Data Migration
For the Map node, split the metadata storage information and store them into different mart folders. In this way, when you need to merge or migrate the mart files, you only need to copy the data under the required mart folder. The system can normally identify and use these mart files.
Improve the RPC Retransmission Mechanism to Ensure Its Execution
The new version improves the RPC retransmission mechanism to avoid failure of calculation when network jitter and other abnormal situations occur, and at the same time, ensures that the RPC retransmission mechanism will not affect the normal processing of requests.
Detect Result Set of Large Table Join to Avoid Large Result Set Dragging Down System Performance
For the calculation not in the database, in order to avoid the result set of large table Join being too large and dragging down system performance, a new parameter join.grid.maxrow=10000000 is added to control the size of result set. An error is thrown when the number of rows in the result set exceeds the parameter value.
The Interfacial Operation of Data Split to Improve the Usability
When incrementally importing data to data mart, there is no need to add parameters for customized average split.
When data is averagely split and imported into data mart, automatic split is not only supported, but also the split value can be customized in an interface way.
As long as you set the split type, column, number and value in the interface, you can easily achieve visualized data split.
❖New Features List
1. Self-Service Data Preparation
No. |
New Features |
Version |
1 |
Optimize Data Processing Performance, and Improve Response Speed of Data Preview |
V8.5 |
2 |
Support Database Paging, and Improve Data Access Speed |
V8.5 |
3 |
Push Down to the Database for Processing When the Filter Includes“contains one of” |
V8.5 |
4 |
Increase the Number of Default Caches to Improve Query Response Speed |
V8.5 |
5 |
Support GBase Database, Covering More Data Source |
V8.5 |
6 |
Data Connection Adds The Enter to Excel&Text Data Source, and Improve The User Experience of Excel, Txt, CSV and Log Data |
V8.5 |
7 |
Flexible Row and Column Conversion, Free Switching Between One-dimensional Table and Two-dimensional Table |
V8.5 |
8 |
Self-Service Data Set Realizing Self-Service Data Sorting and Sampling |
V8.5 |
9 |
MDX Expression Extending the Support Capability of Multidimensional Database |
V8.5 |
10 |
YHSQL Supporting Case When Sentences |
V8.5 |
11 |
HBase Connection Supports Kerberos Verification Mode |
V8.5 |
12 |
Get Through the Operation Flow, and Import Incremental Data to the Mart with One Click |
V8.5 |
13 |
System Parameters Setting Supports to Configure the Amount of Exported Data |
V8.5 |
14 |
Optimize the Setting of Database Column Aliases to Enable the Display of Aliases for Individual Data Sources |
V8.5 |
15 |
Optimize Display Order of Fields Which is Consistent in Meta Data, Detail Data, and Dashboard |
V8.5 |
2. Advanced Analysis
No. |
New Features |
Version |
1 |
Flexible Advanced Analysis Home Page to Meet the Needs of Different Customers |
V8.5 |
2 |
Support PMML Export to Facilitate Cross-Platform Deployment of Model Parameters |
V8.5 |
3 |
Enhance the Result Display of Association Rules |
V8.5 |
4 |
Correlation Analysis Result Supporting Excel Export |
V8.5 |
3. Dashboard
No. |
New Features |
Version |
1 |
New Chart Type, Histogram, to Meet More Business Scenarios |
V8.5 |
2 |
New Plug-in Chart Types to Meet More Business Requirements |
V8.5 |
3 |
Support a Variety of GIS Map Servers to Enhance the Display Capacity |
V8.5 |
4 |
Scaling Analysis of Chart to Adjust Data Range Flexibly |
V8.5 |
5 |
No Need to Configure the Operation “Bind Data”, and the Data Location Can Be Flexibly Switched |
V8.5 |
6 |
Enhance the Function of Freestyle Table to Display Multi-Source Data |
V8.5 |
7 |
Match Ups and Downs Rendering with the Language Environment |
V8.5 |
8 |
More Flexible Interaction Color to Match Dashboard Theme Style |
V8.5 |
9 |
Real-time Monitoring of Business indicators, and Push the Abnormal Situation to Staff |
V8.5 |
10 |
Share Dashboards to Specific Users to Enhance Collaboration Within the Team |
V8.5 |
11 |
Add Frequently Used Dashboards to Favorites |
V8.5 |
12 |
Optimize the Settings of Sequent Comparison an Parallel Comparison |
V8.5 |
13 |
Unified Entrance of Detail Expression and Dimension Expression to Improve the Usability |
V8.5 |
14 |
Display the Field Name When Hovering over the Field Alias |
V8.5 |
15 |
The Chart Animation Shows the Data Changes, and the State Comparison Experience Is Better |
V8.5 |
16 |
Add Loading Animations to Enhance the User Experience When Opening Dashboard |
V8.5 |
17 |
Optimize Icon Position of Component Operation to Solve Occlusion Problem of Component Title |
V8.5 |
18 |
Optimize the Script Logics When Getting Value |
V8.5 |
19 |
Optimize Component Hiding Operation to Improve Usability |
V8.5 |
20 |
Optimize the Subscription of Dashboards to Improve the Operation Experience |
V8.5 |
21 |
Download Queue Mechanism to Improve User Experience and System Stability |
V8.5 |
22 |
Support Image of Format WebP to Improve Image Loading Performance |
V8.5 |
23 |
Friendly Message Prompt to Recommend the Best Suitable Browser browser |
V8.5 |
24 |
Display Error Reasons, Guide the Users to Solve the Problem of Error Better |
V8.5 |
25 |
The Home Page of Each Module Adapts to the Screen Size |
V8.5 |
26 |
Strictly Control the View of Detail Data, and Improve the Level of Data Security |
V8.5 |
27 |
Enhance Brush Function |
V8.5 |
28 |
Support to Hide the Hint When Viewing Dashboard |
V8.5 |
29 |
Table Data Supports Data Paging |
V8.5 |
4. Enterprise Management
No. |
New Features |
Version |
1 |
Integrate Enterprise WeChat to Receive Alert Messages & Task Status in Real Time time |
V8.5 |
2 |
System Alert Platform -- Monitoring System Status and Timely Send System Alert |
V8.5 |
3 |
Add System Mailbox Configuration for Sending System Mail |
V8.5 |
4 |
Add Required Attributes to User Information to Ensure Timely Information Receiving |
V8.5 |
5 |
Mailbox Configuration in Preference Adds Mailbox Validation |
V8.5 |
7 |
Compatible with Exchange Mailbox |
V8.5 |
8 |
Password Complexity Upgrade to Enhance Security |
V8.5 |
9 |
Password Recovery Mechanism to Help the Users Solve the Problem of Forgotten Passwords |
V8.5 |
10 |
Role Replication Capacity Facilitates the Authorization For Resources and Operations |
V8.5 |
11 |
Optimize the Management Behavior of Group Administrators, and Implement the Management of Users and Authority into Groups. |
V8.5 |
12 |
Support Folders to Efficiently Manage Scheduling Tasks and Triggers |
V8.5 |
13 |
Enhance Batch Management, While Deleting or Editing Multiple Scheduling Tasks |
V8.5 |
14 |
Multiple Triggers to Meet the Complex Scheduling Task Scenario |
V8.5 |
15 |
Optimize Scheduling Task Execution Logic: Restart Task is No Longer Performed Immediately |
V8.5 |
16 |
Optimize the Execution Timeout Mechanism of Scheduling Task to Improve the Performance of Scheduling Task |
V8.5 |
17 |
Optimize the LDAP Stock Synchronization Rules to Avoid Synchronization Failures |
V8.5 |
18 |
Hide the Audit Entry to Non-C Nodes to Avoid System Error |
V8.5 |
19 |
Enhanced Threads Management and Support Downloading Thread Logs |
V8.5 |
20 |
Optimize Log Management to Facilitate Troubleshooting |
V8.5 |
21 |
Single Sign-on Integration and Automatically Create New Users |
V8.5 |
5. App
No. |
New Features |
Version |
1 |
Easily Manage Server Addresses |
V8.5 |
2 |
Considerate Password Management Ensuring Password Security |
V8.5 |
3 |
Support Scanning QR Code to Preview the Dashboard, Which Make Mobile Layout Adjustment Easily |
V8.5 |
4 |
JS Script Preloading Mechanism Improving Dashboard Loading Performance |
V8.5 |
5 |
Paging Table on App Improving Query Performance |
V8.5 |
6 |
Add Favorites Page at Mobile Terminal to Collect the Favorite Dashboards |
V8.5 |
7 |
Graph Supports Scaling Analysis, and Even Better Finger Zooming Experience |
V8.5 |
8 |
Optimize the Style and Function of Components to Bring You a Pleasant Data Analysis Experience |
V8.5 |
6. Big Data
No. |
New Features |
Version |
1 |
Support Flexible Setting of Precision of Data Mart, and Obtain the Double Win of Storage Space and Computing Precision |
V8.5 |
2 |
Support Storing Data Boundary Values |
V8.5 |
3 |
High Precision Computation Is Supported to Ensure the Accuracy of Large Data Aggregation |
V8.5 |
4 |
Optimize Aggregation Calculation Performance and Ease Memory Pressure |
V8.5 |
5 |
Manage Memory Objects to Improve System Stability |
V8.5 |
6 |
Store Metadata Information Separately to Ease Data Migration |
V8.5 |
7 |
Classify and Isolate the Mart Tasks and Use Thread Resources Independently |
V8.5 |
8 |
Improve the RPC Retransmission Mechanism to Ensure Its Execution |
V8.5 |
9 |
Detect Result Set of Large Table Join to Avoid Large Result Set Dragging Down System Performance |
V8.5 |
10 |
The Interfacial Operation of Data Split to Improve the Usability |
V8.5 |