|
<< Click to Display Table of Contents >> Change Chart Type |
  
|
|
<< Click to Display Table of Contents >> Change Chart Type |
|
Editor Dashboard page and the components that have been made can switch the chart. On the basis of no need to add new components and bind data, quickly change the chart type, view the display results of the same data on different kinds of charts, and meet the requirements of diversified visual data analysis.
The switch chart supports switching back and forth between table components and chart type components. However, due to the binding rules of chart type components, only the component icons that meet the switching conditions are highlighted and operable when the switch type is selected.
There are two ways to change the chart type. The one is to change the chart type through the General of right panel => Switch Chart, and the other one is to directly change the chart type by clicking the Change icon.
1. Change the chart style through selecting chart type in the Right Pane =>Switch Chart.
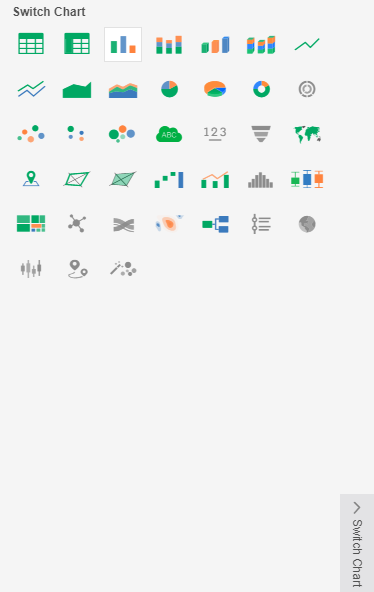
Chart type icon retract by default.
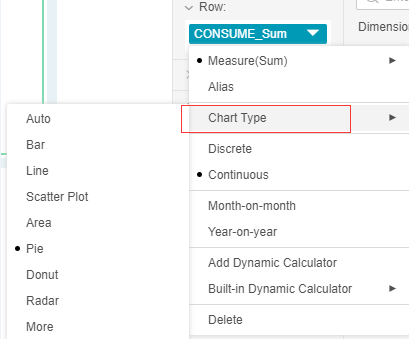
2. Change chart types by clicking on the Change icon:
Click inside the red box in the following figure.