|
<< Click to Display Table of Contents >> Dynamic performance analysis report |
  
|
|
<< Click to Display Table of Contents >> Dynamic performance analysis report |
  
|
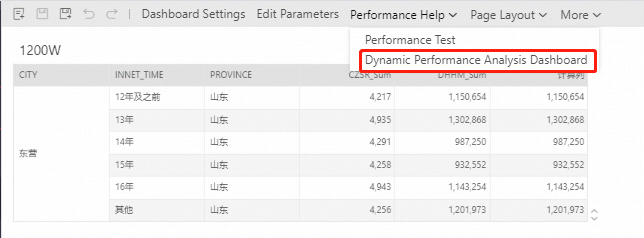
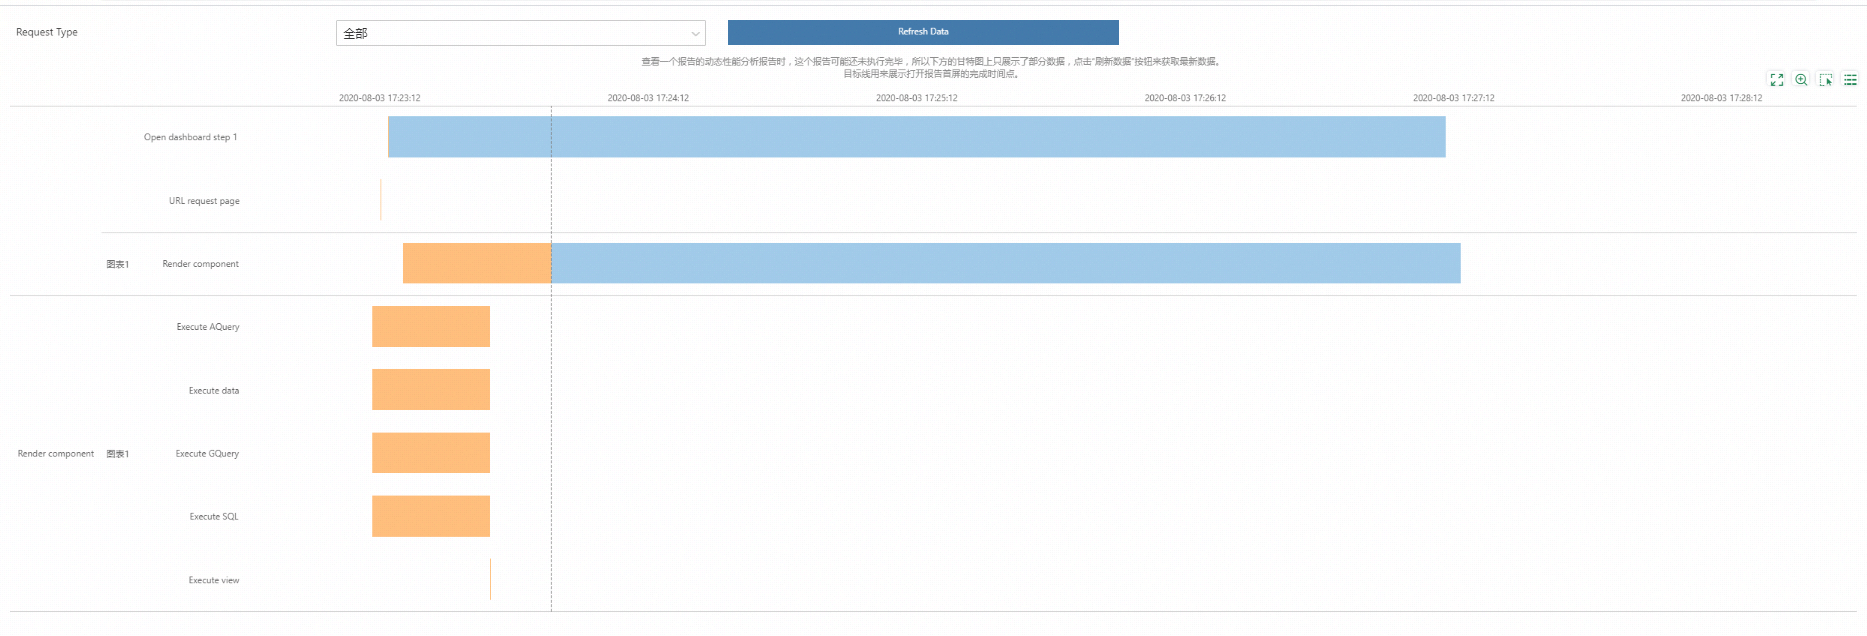
Generally, the steps for a user to open a Yonghong report are divided into: open the report, execute the data of different components on the report, and return the data to the foreground for rendering. Through the dynamic performance analysis report, the system displays the time-consuming execution of each step in the form of a Gantt chart. Users can take certain measures based on the results presented by the data. When making a report, click on the performance help --> dynamic performance analysis report in the menu bar to realize this function, as shown in the figure below:

Note: In the report execution steps, there are many steps that are very time-consuming. We use the audit.performance.record.limit=xxx property (unit is s) to avoid displaying these steps that are less time-consuming in opening reports. The default value is 3s, that is, the steps below 3s will not be displayed during the execution. Users can configure the detection parameters suitable for their own environment in bi.properties according to their own needs.
Generally, the opening steps of Yonghong report can be divided into opening URL --- > initialization parameters --- > initializing JS --- > opendbreq --- > rendering report background --- > opendbreq2 --- > rendering components --- > updateelemreq --- > components returned by rendering --- > rendering returned results
In the Gantt chart, the x-axis is the time span, and the y-axis is the steps executed by the report. In addition, we also display the opening time of the first screen of the report in the form of a target line, as shown in the following figure.

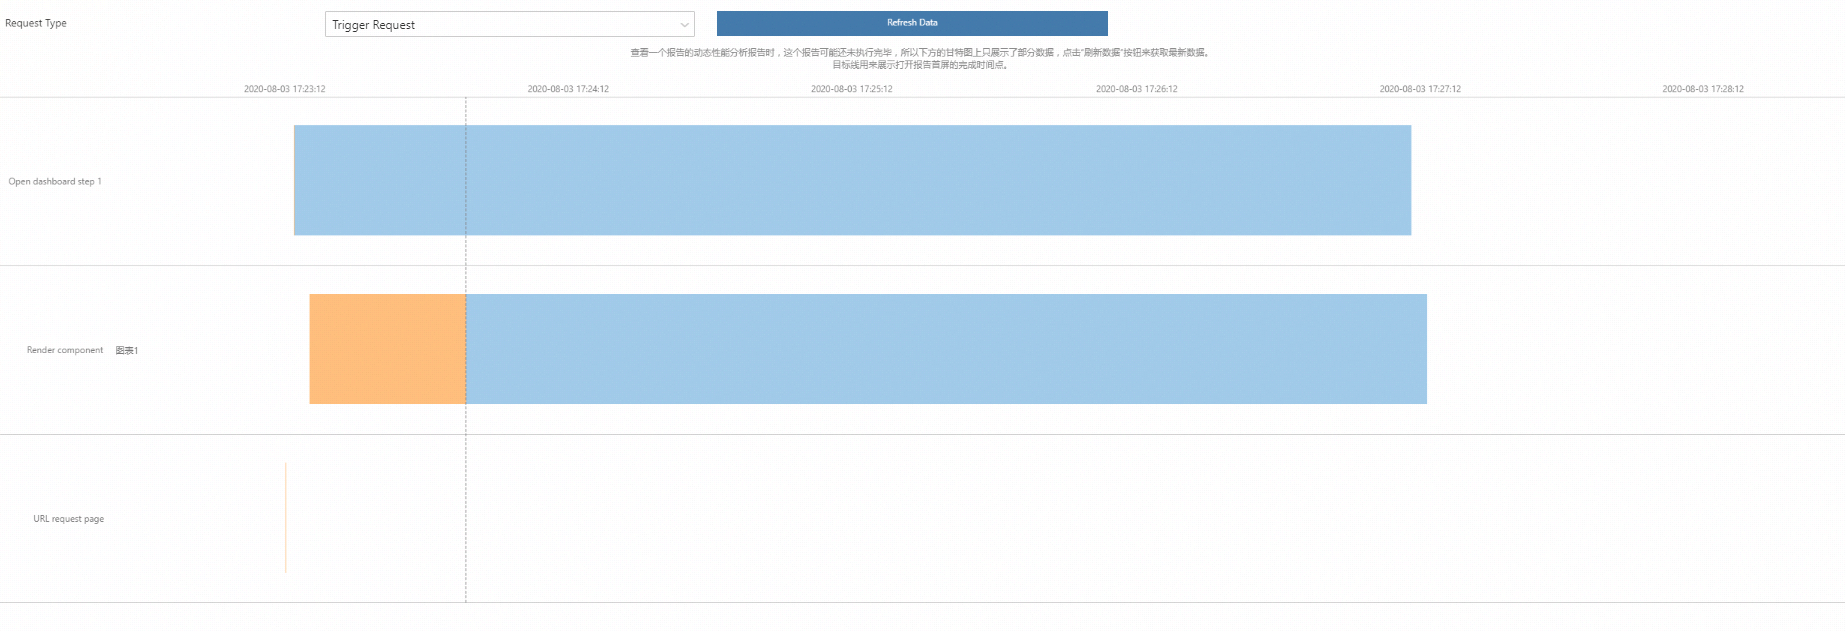
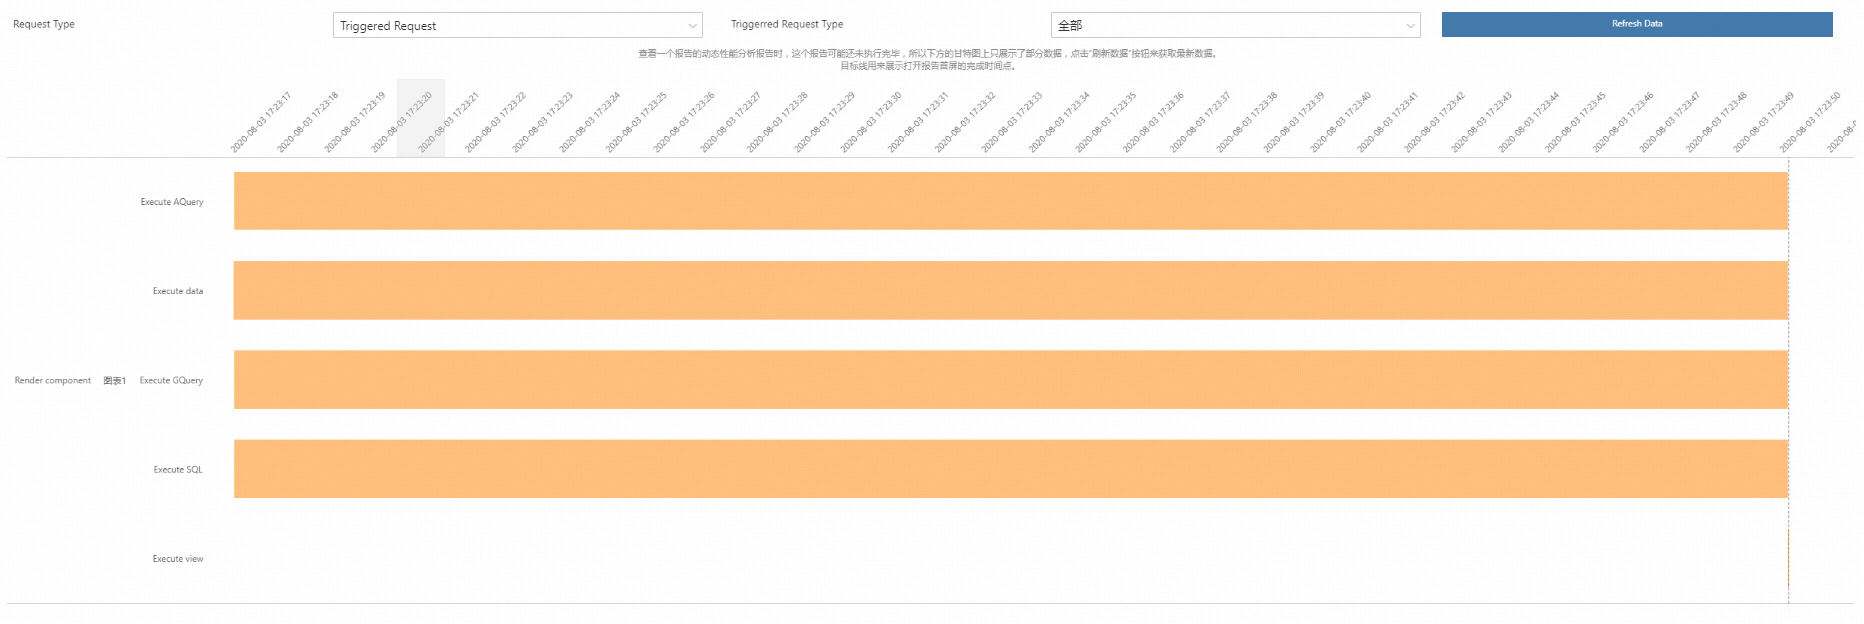
In the request type, we can choose active request and passive request to refine the operations performed by the report, as shown in the following figure:


In addition to real-time monitoring on the report side, users can also open the management system-->Monitoring and early warning-->System monitoring-->Performance statistics-->Operation resource information monitoring statistics report of historical running resources by clicking the report hyperlink To analyze the data of the historical open report, as shown in the figure below:

Note: for dynamic performance testing
Receivetime = time the request was received
Overtime = the time when the request ended
Create time = start time of request
Procost = execution time
NetCost = transmission time
Totalcost = total time
Executeauery = execution data a
Executegquery = execution data G
Executedata = execution data
Loadcontextreq = variables required to prepare the running environment
Urlloaddbreq = URL request page
Opencachedbreq = open report (with cache in foreground)
Opendbreq2 = open report phase 2
Opendbreq = open report phase 1
Updateelemreq = return data to foreground rendering
Updateimage = return image to foreground rendering
Subscribereq = get subscription status
Getconn = get database connection
Executeview = execution view
Executesql = execute SQL
Dashboard__ =Report
Loadgridcountreq = number of request table rows
Fixdbscalereq = report adaptation
Pagecountreq = number of requested form pages