|
<< Click to Display Table of Contents >> Health Check |
  
|
|
<< Click to Display Table of Contents >> Health Check |
|
The health check is mainly used to check the current status of the system. After the health check is completed, the system will automatically generate an inspection report. The report will give some optimization suggestions for some core indicators. The user can adjust the system according to the recommendations to ensure the system's smooth operation.
❖The storage of health report
The health report are stored in the database table and under bihome/word, and the detailed data in the report is only stored in the database table. The report data is stored in the derby database by default, and the user can also customize the stored database table. The specific steps are as follows:
From the Database Connection Configuration area of the System Setting of System Management, click the audit selection button and select the database connection.
Click Test Connection: Test whether the database used can be successfully connected.
When the user uses the health check module, two tables (YH_HEALTHCHECK, YH_HEALTHCHECK_ITEM) are created to the database, which are used to store the health check report and each check item in each health report.
Click Delete Connection: Delete two tables (YH_HEALTHCHECK, YH_HEALTHCHECK_ITEM) that already exist in the database.
❖General health report
The user can periodically perform a health check for the system to generate an health report, or manually check the system at any time. The process of manually checking the system to generate health report is as follows:
Click "general health report" to enter the generate health report dialog box, as shown below:
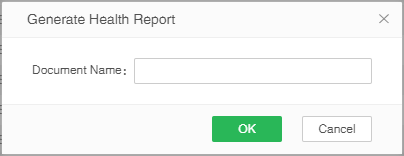
【Document Name】Health check document name, required.
【OK】Click "OK" to enter the check health report dialog box.
【Cancel】Click "Cancel" to cancel creating the document and return to the check document list page.
After the user fills the document name and clicks OK, it will enter the check health report dialog box, as shown below:
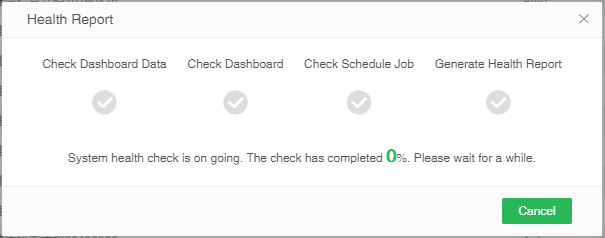
【Cancel】Click "Cancel" to cancel creating the document and return to the check document list page.
【Close】Click the "Close" button in the upper right corner to close the check health report dialog box and the document will continue to be generated in the background.
The document check includes dashboard data check, dashboard design check and schedule job check. The current check progress is displayed in the dialog box, and each check is completed, a green check mark will displayed under the corresponding check item. After each item is checked, the document is generated and the document window will be closed automatically, the created document will also be displayed in the check document list.
➢Description:
The time to automatically check the system to generate documents can be defined by configuring the properties in bi.properties file: healthcheck.trigger.cron=×××, the attribute value is cron expression, and the default value is automatically checked at 3 am every day on the 1st of each month.
Checking the document retention time can be defined by configuring the property in bi.properties file: healthcheck.remove.days=××× (days), the default value is 365 days, which one year is reserved.
❖Check document list
All document information created is listed in the check document list. Users can also search for the document information they want to select by document name or time, as shown in the following figure:
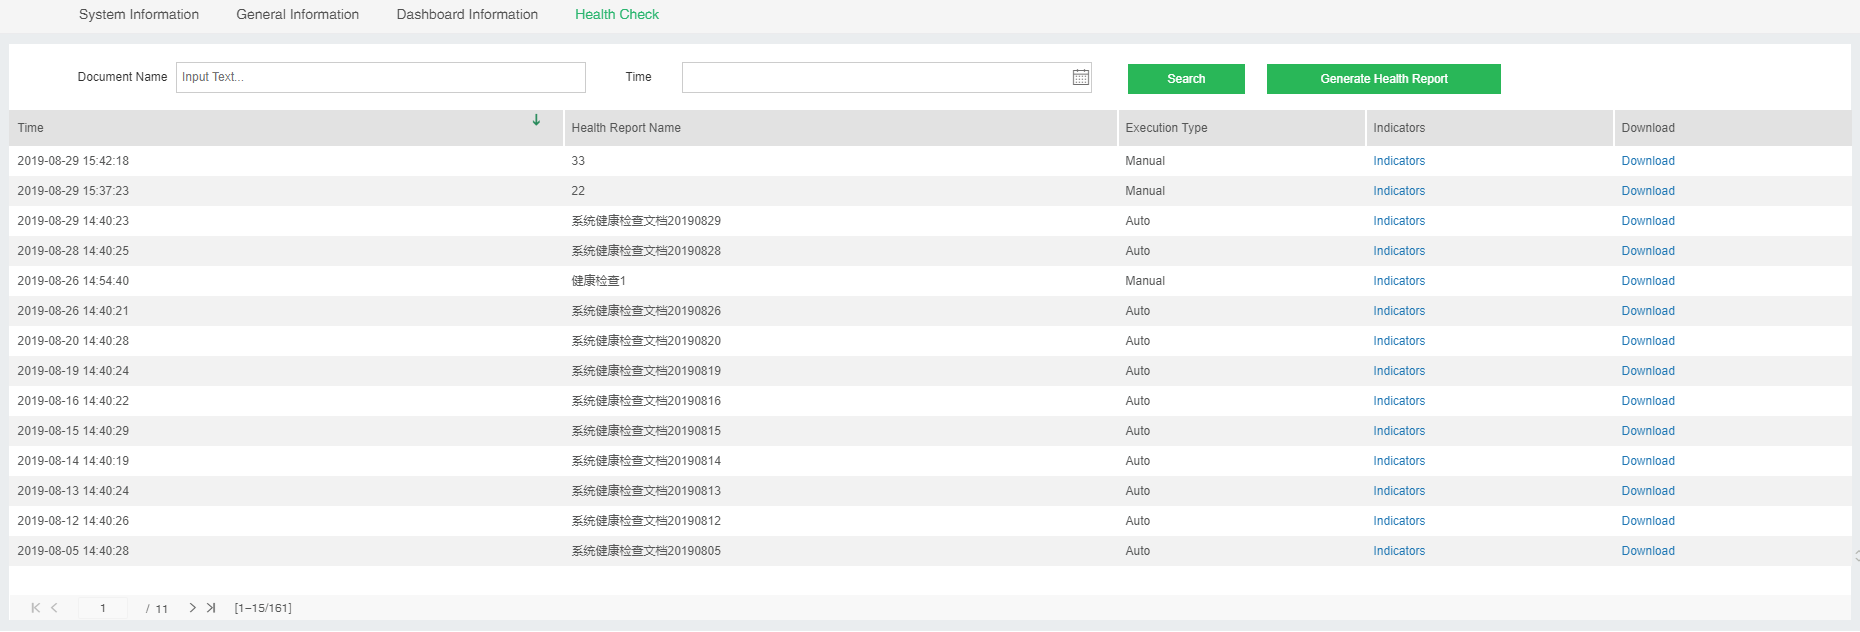
【Time】The time to generate the health report.
【Health Report Name】The report name of the health report is created automatically or manually.
【Execution Type】The type of create health report, including automatic and manual.
【Indicators】Click the "indicators" to jump to the report details page. The report details include dashboard data, dashboard design and schedule task.
【Download】Click "Download" to download the health check report in word format. The content of the document is divided into basic information, inspection results and follow-up suggestions. The basic information and inspection results only list the results of some core indicators in the system inspection. The subsequent recommendations are the optimization suggestions given for each item according to the inspection results. The user can make appropriate adjustments to the system for subsequent recommendations.
❖Dashboard Data
The dashboard data counts the result set, number of expressions of each dashboard and so on in the current system, as shown in the following figure:
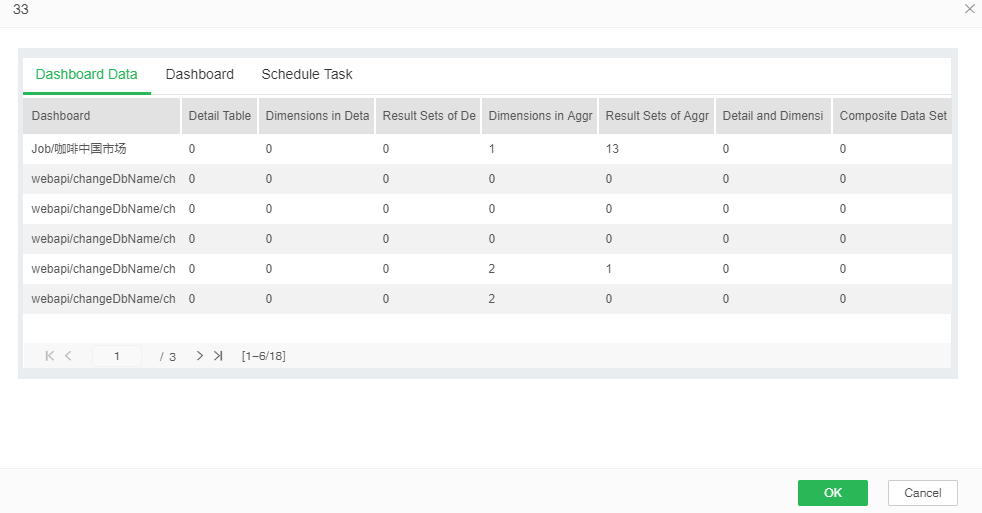
【Dashboard】The name of the dashboard, including the full path of the dashboard.
【Detail Tables】The total number of detail tables in the dashboard.
【Dimensions in Detail Tables】The number of dimensions in detail tables in the dashboard. If there are multiple detail tables in a dashboard, it counts the number of dimensions of the detail table with the largest number of dimensions in all detail tables.
【Result Sets of Detail Tables】The result sets of detail tables in the dashboard. If there are multiple detail tables in a dashboard, the result sets of the detail table with the largest result sets in all detail tables is counted.
【Dimensions in Aggregate Tables】The number of dimensions in aggregate tables in the dashboard. If there are multiple aggregate tables in a dashboard, it counts the number of dimensions of the aggregate table with the largest number of dimensions in all aggregate tables.
【Result Sets of Aggregate Tables】The result sets of aggregate tables in the dashboard. If there are multiple aggregate tables in a dashboard, the result sets of the aggregate table with the largest result sets in all aggregate tables is counted.
【Detail and Dimension Expressions after Imported to Data Mart】The total number of detail and dimension expressions created on the data set or dashboard, and the data set on which the dashboard depends must be the sql data set imported into the mart or data mart data set.
【Composite Data Sets in Data Mart】The total number of composite data sets that the dashboard depends on which the data set is imported into the mart.
➢Description:
For result sets, the actual result sets of the dashboard can only be obtained after the dashboard is opened or previewed in the view dashboard, and the result sets record 0 after the dashboard is opened in the edit dashboard. Once the dashboard's result sets is recorded and then opened in the edit dashboard, the result sets is not updated, and the result sets is updated unless the dashboard is previewed again or opened in the view dashboard.
For the number of expressions, if there are multiple components in a dashboard, different components are bound to the same expression, the number of the same expression is counted multiple times; if an expression is a nested expression, as long as the outermost expression satisfies requirements are counted.
❖Dashboard Design
The dashboard design counts the number of filter components, the number of parameter components and the number of Non-SQL expressions of direct connection to database in each dashboard in the current system, as shown in the following figure:
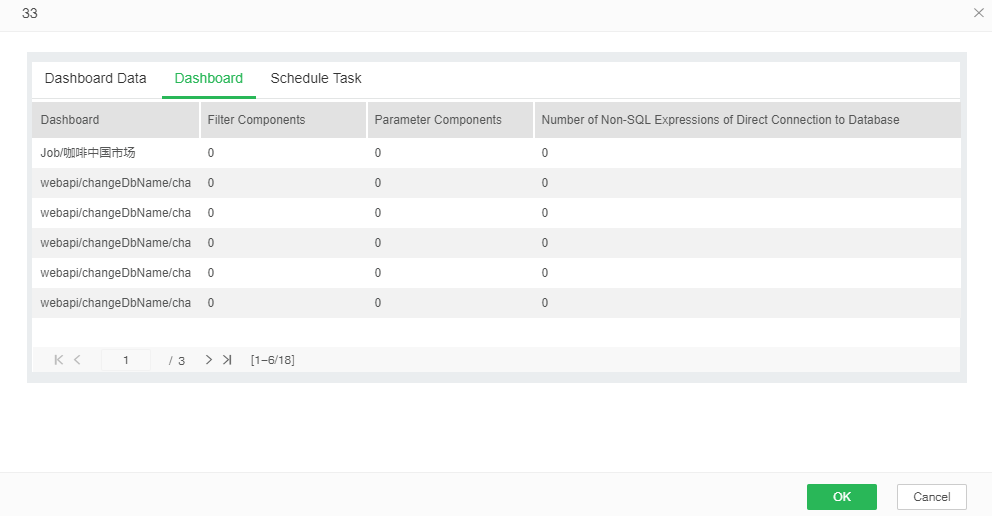
【Dashboard】The name of the dashboard, including the full path of the dashboard.
【Filter Components】The total number of filter components in the dashboard. The filter components include: filter list, filter tree, range filter, calendar and filter container. Each filter component in the filter container is counted separately.
【Parameter Components】The total number of parameter components in the dashboard. The parameter components include: listbox, combobox and text parameter.
【Number of Non-SQL Expressions of Direct Connection to Database】The total number of non-SQL expressions created on the dashboard or data set, and the data set that the dashboard depends on must be the sql data set that is not import into mart.
➢Description:
For the number of expressions, if there are multiple components in a dashboard, different components are bound to the same expression, the number of the same expression is counted multiple times; if an expression is a nested expression, as long as the outermost expression satisfies requirements are counted.
❖Schedule Task
The detail information of all jobs are counted in the scheduled task, as shown in the following figure:
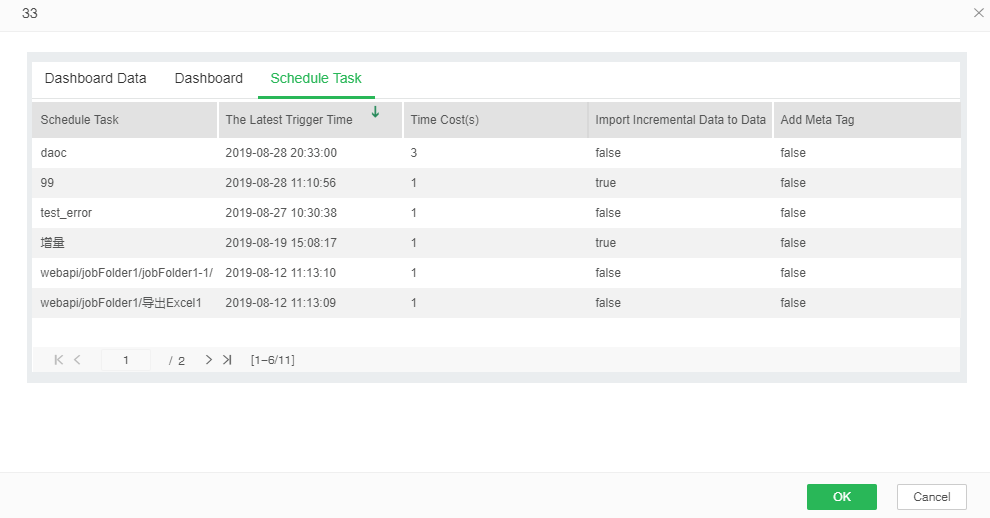
【Schedule Task】The name of the job in the schedule task, including the full path of the job.
【The Lastest Trigger Time】The last time of the job was executed.
【Time Cost】The time taken for the job to run, the unit is s. The running time of the job is less than 1s and is counted by 1s.
【Import Incremental Data to Data Mart】Whether the type of the job is an incremental import data to data mart.
【Add Meta Tag】Whether there is a meta script in the script box for the type of the incrementally importing data to data mart jobs.
❖Description:
For multitasking type jobs, only the details of the job are counted, and the details of the task are not counted.