|
<< Click to Display Table of Contents >> Dashboard Information |
  
|
|
<< Click to Display Table of Contents >> Dashboard Information |
|
The top 50 dashboards of visits are counted in the dashboard information, including: the number of visits, the percentage of visits, the total number of components in the dashboard, the average time cost of data set opening, whether the dashboard sets batch submissions, and the number of query that are dependent on the dashboard. Users can enter one or more dashboard names in the search box to view the details of a dashboard.
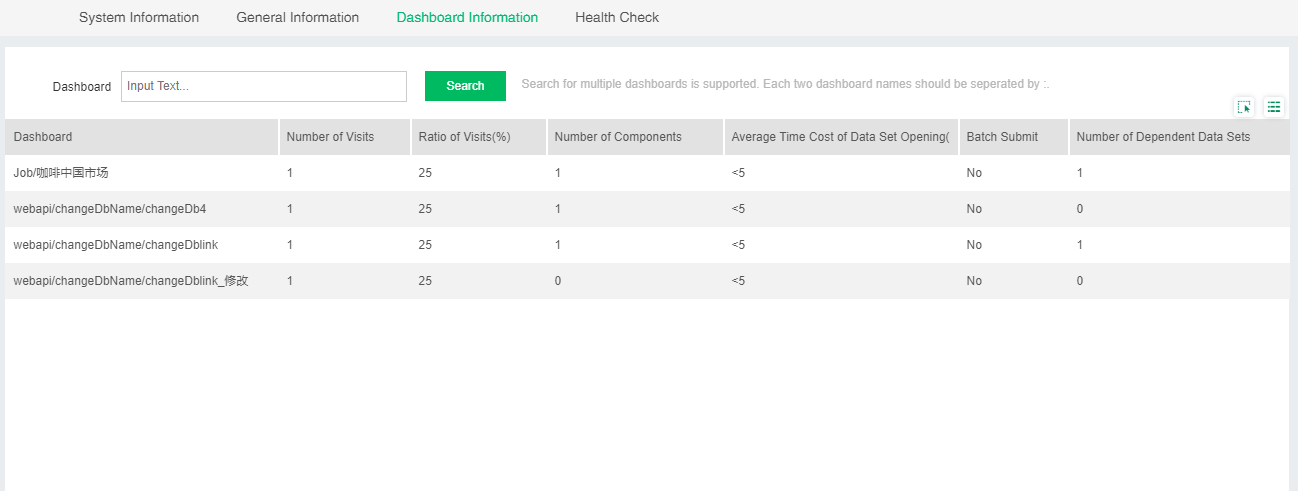
➢Description:
The average time cost of the data set opening is the data set execution time when the dashboard is opened in the view dashboard module. when the dashboard is opened in edit dashboard module or previewed, it will not counted and is displayed as <5s.