|
<< Click to Display Table of Contents >> Data Transformation |
  
|
|
<< Click to Display Table of Contents >> Data Transformation |
  
|
❖Data Transformation
Data conversion contains sampling, data partitioning and standardization.
•Sampling
Sampling is a common method for analysis of data object subset. In statistics, sampling is used for data realization investigation and final data analysis. Sampling is also useful in data mining. However, in statistics and data mining, the motivations for sampling are different. Sampling is used in statistics process since the entire data set is too expensive and time consuming. And sampling is also used in data mining since the data treatment is too expensive and time consuming. In some cases, the sampling algorithm can compress the data so that it is possible to use better but more expensive data mining algorithms.
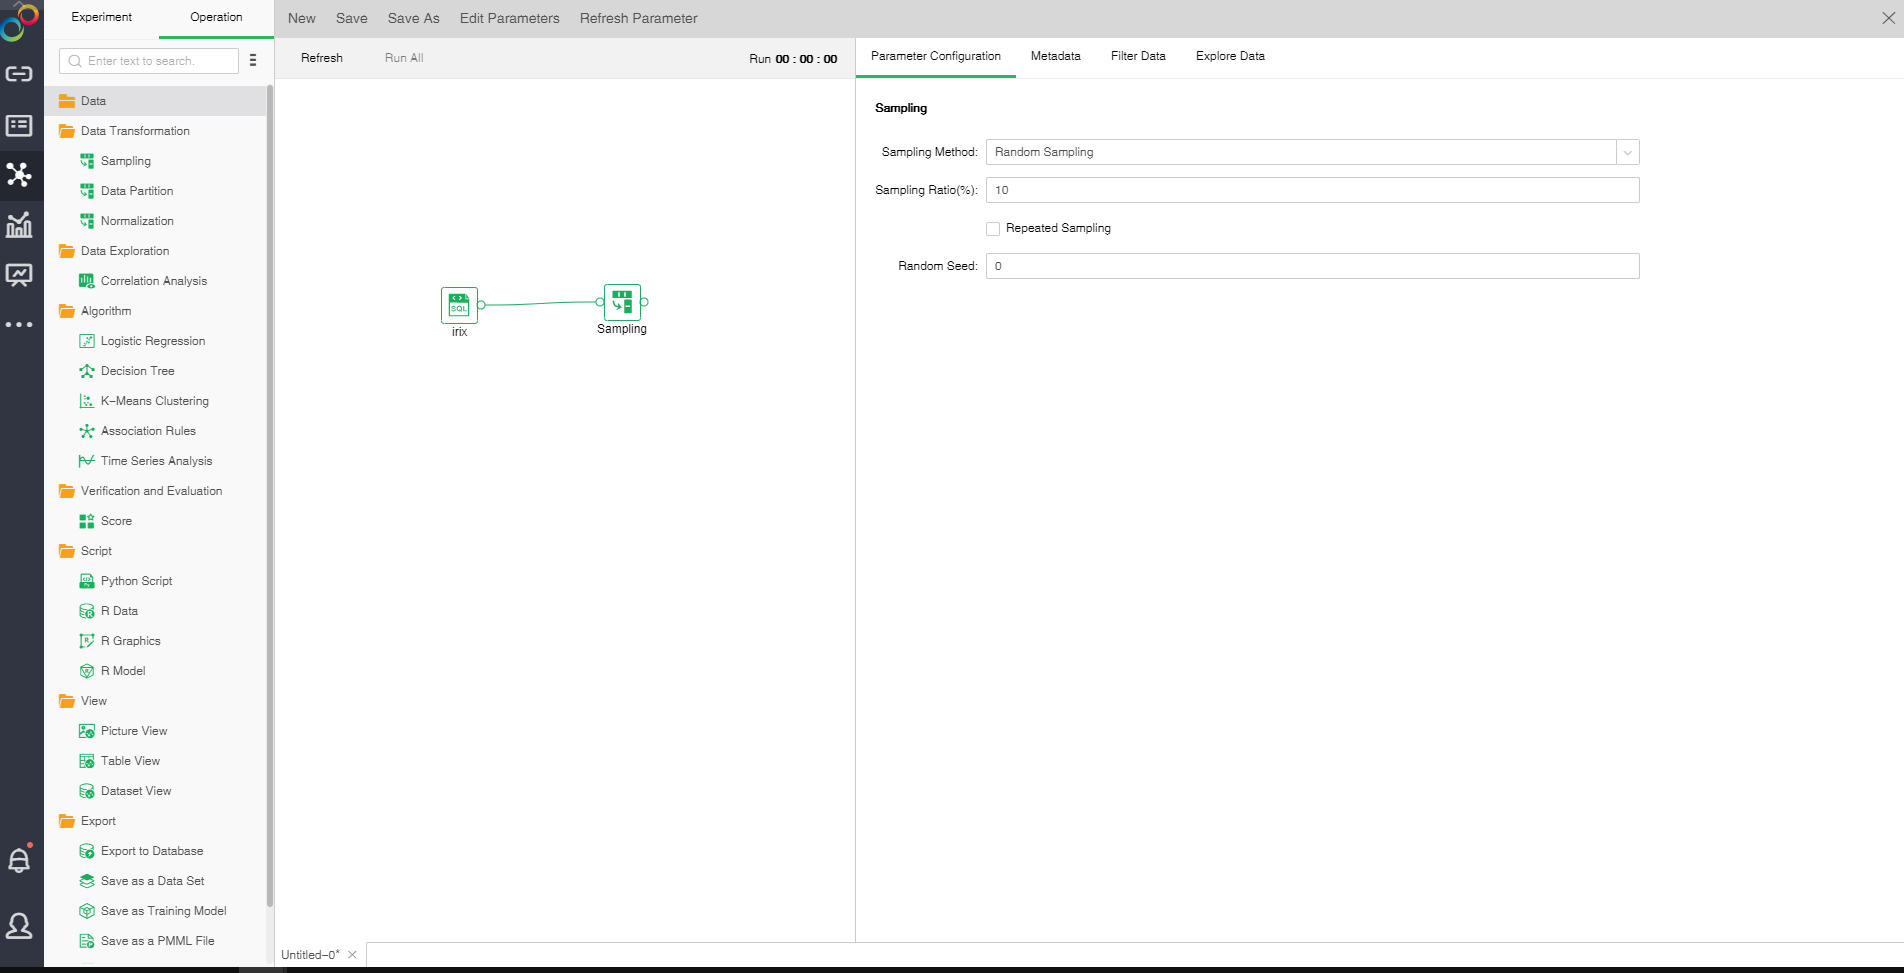
Drag a data set and a sample node to the edit area. Connect the data set and the sampling node. Selected sampling node settings and display area includes four tab pages, namely "Parameter Configuration", "Metadata", "Filter Data", and "Explore Data."
oParameter Configuration
There are three sampling modes: Random Sampling, Sequential Sampling and Stratified Sampling.
Random Sampling:
Random Sampling follows random principle. Namely ensure that every object in the population has a known and non-zero probability being selected as the object of the study. Extract sample number of rows of sampling rate from data set node to ensure the representativeness of the sample.
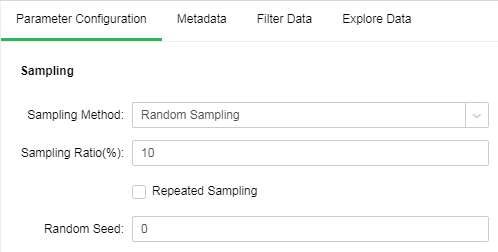
[Sampling Ratio(%)] Sampling rate extracted.
[Repeated Sampling] When it is not selected, each selected item will be immediately deleted from all the objects that make up the statistical population. When it is selected, the objects will not be deleted from the population when it is selected. In case of repeated sampling, the same object may be extracted for multiple times. It is default as not selected.
[Random Seed] Generate random number seed. The default value is 0.
Sequential Sampling:
Sequential Sampling takes the first N rows of data set as the result set.
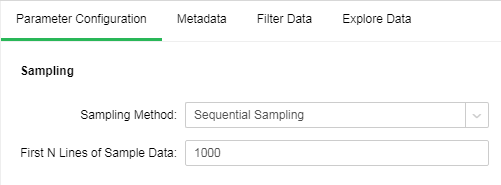
[First N Lines of Sample Data] the number of rows to be sampled in Sequential Sampling The default value is 1000.
Stratified Sampling:
Stratified Sampling starts sampling from predefined groups (namely different values of the selected column). Each group is sampled at the sampling rate.
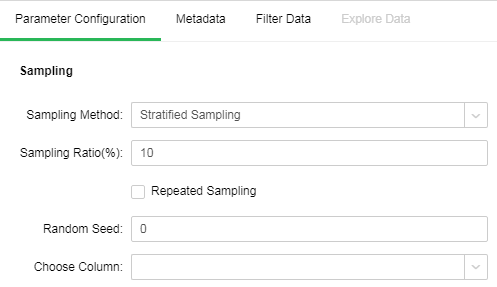
[Choose Column] Layered column. Extract sample rows according to sampling rate by take different values of group.
Other parameters please refer to the Random Sampling.
oMetadata
See Data for details.
oFilter Data
See Data for details.
oExploration Data
All data of the sampling node is the number of samples to be extracted. See Data Node for other details.
•Data Partition
Generally, when perform predictive analysis, the data will be divided into two parts. One part is training data, which is used to build the model. And the other part is test data which is used for model testing. Data Partition is to divide the data in data set to validation set and training set.
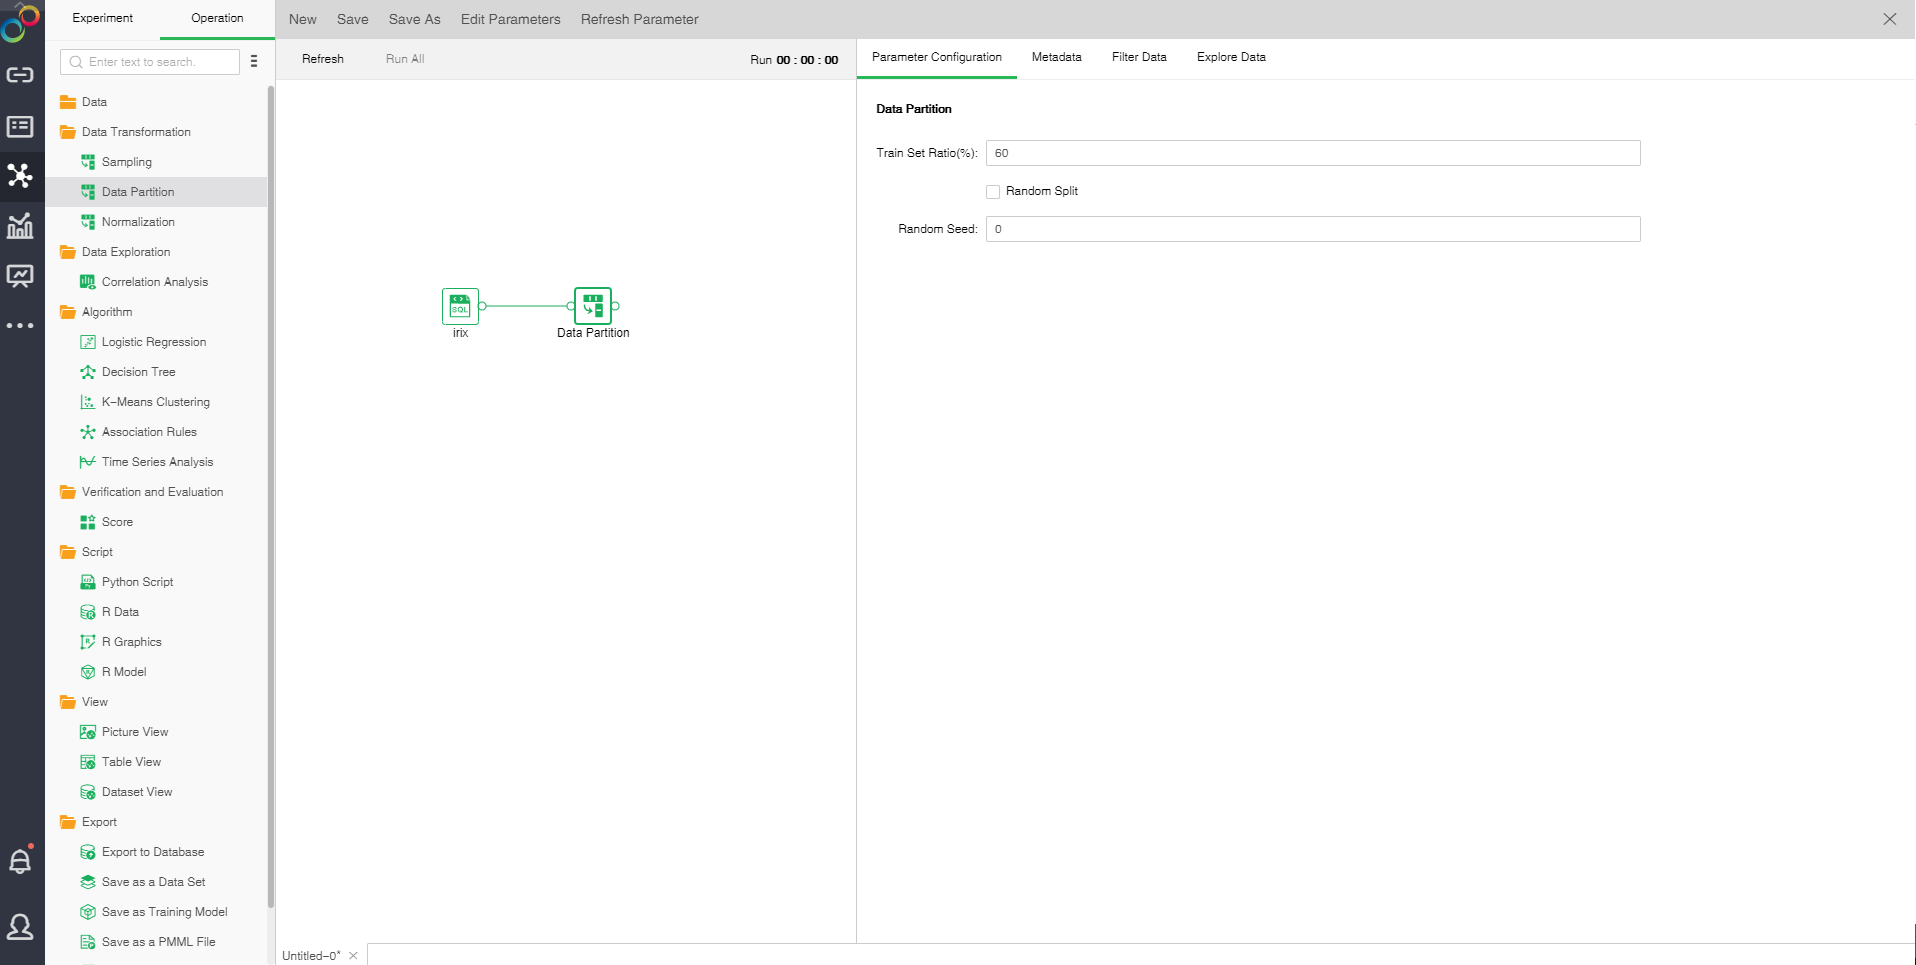
Drag a data set and a Data Partition node to the edit area. Connect the data set and Data Partition node. The selected Data Partition node setting and display area contains four pages: Parameter Configuration, Metadata, Filter Data and Explore Data.
oParameter Configuration
[Train Set Ratio(%)] proportion of train sets to total samples. The default value is 60.
[Random Split] When it is not selected, extract the training set in order. Randomly selected training sets when selected. It is default as not selected.
[Random Seed] Generate random number seed. The default value is 0.
oMetadata
See Data for details.
oFilter Data
See Data for details.
oExplore Data
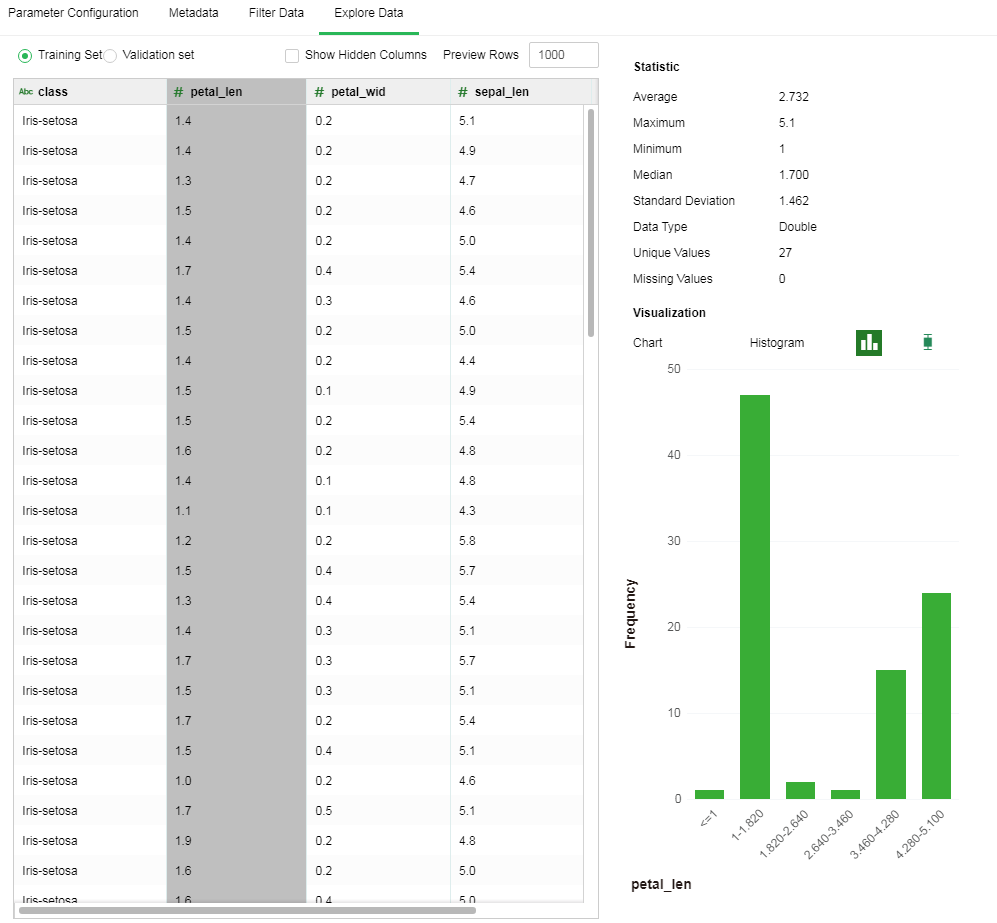
In the exploration data of Data Partition, data characteristics of training set and validation set can be viewed.See Data for other details.
•Normalization
Data normalization is to scale the data proportionally to make it fall into a small specific range. It is often used in some comparison and evaluation index processing. Remove unit limits of data. Convert it into a dimensionless pure number to facilitate the comparison and weighting of indexes of different units or orders of magnitude.
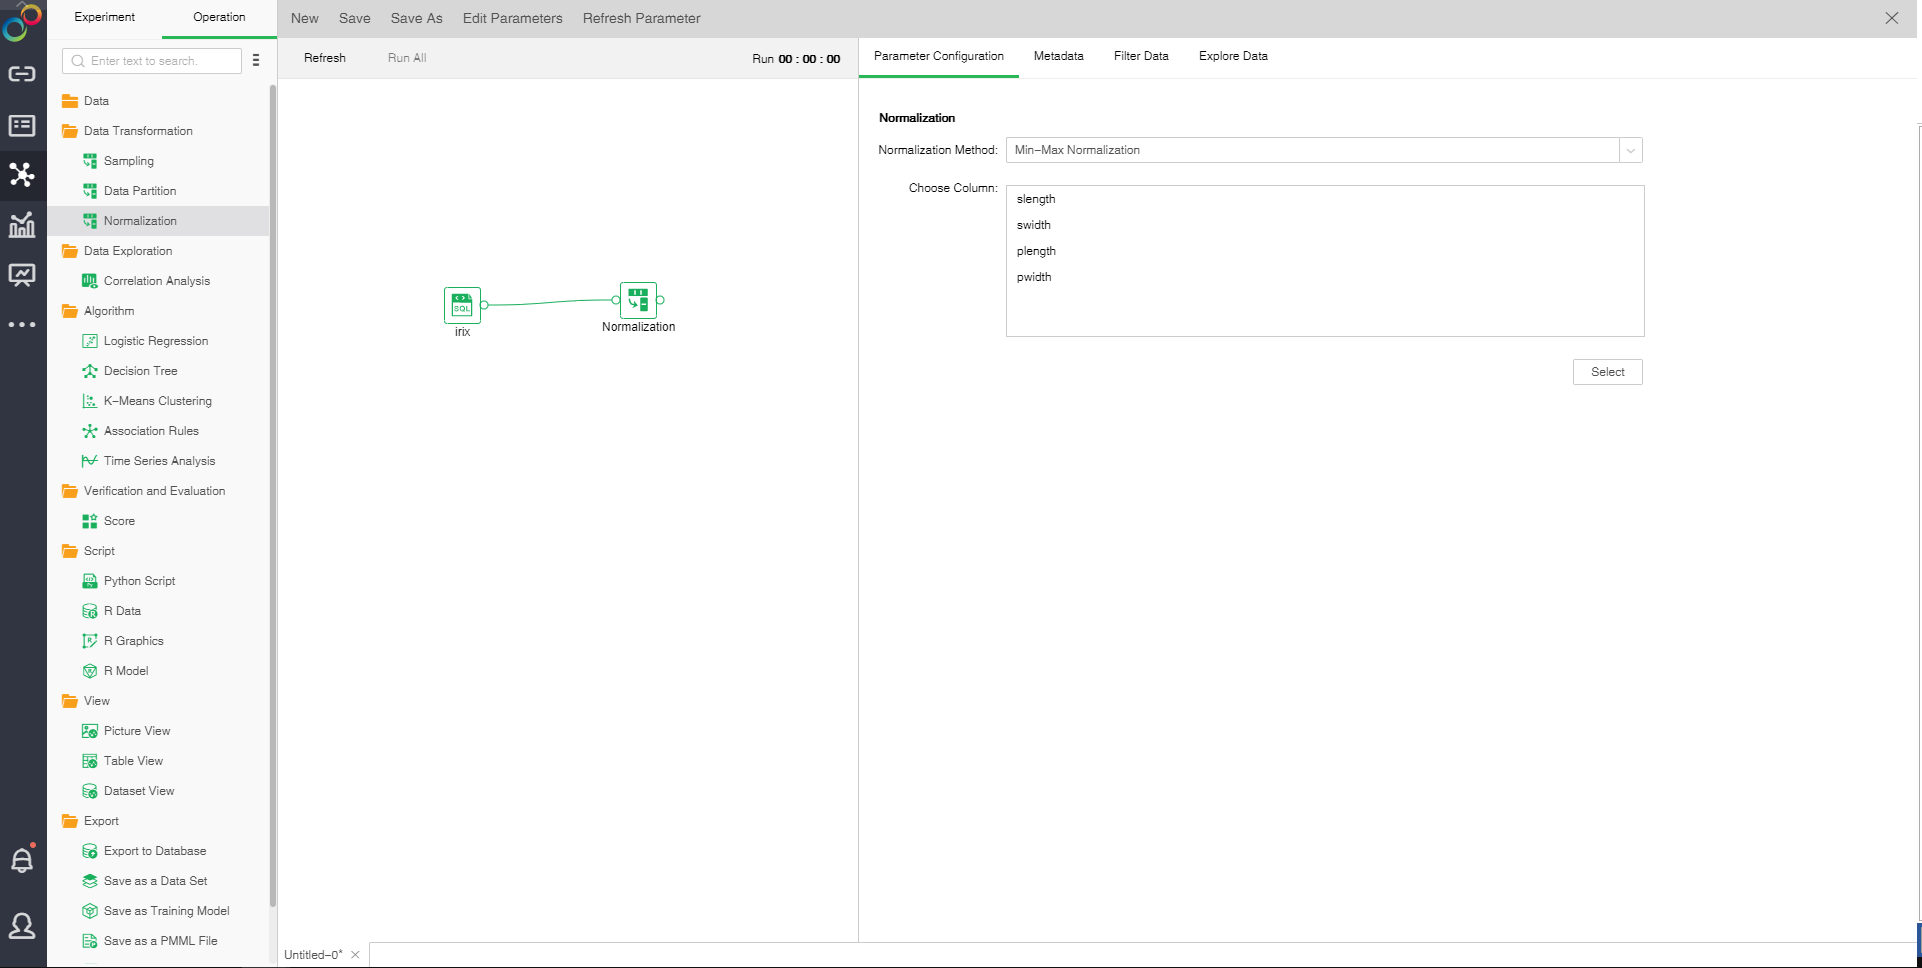
Drag a data set and normalization node to the edit area. Connect the data set and normalization node. The selected normalization node settings and display area includes four pages: Parameter Configuration, Metadata, Filter Data and Explore Data.
oParameter Configuration
[Normalization Method] There are two normalization methods: min-max normalization and Z-score normalization. Min-max normalization refers to linear transformation of original data to make the results fall into the range of [0,1]. The data treated by the Z-score normalization method conforms to standard normal distribution with zero mean of 0 and unit variance of 1.
[Choose Column] Data type column needs to be normalized.
oMetadata
See Data for details.
oFilter Data
See Data for details.
oExplore Data
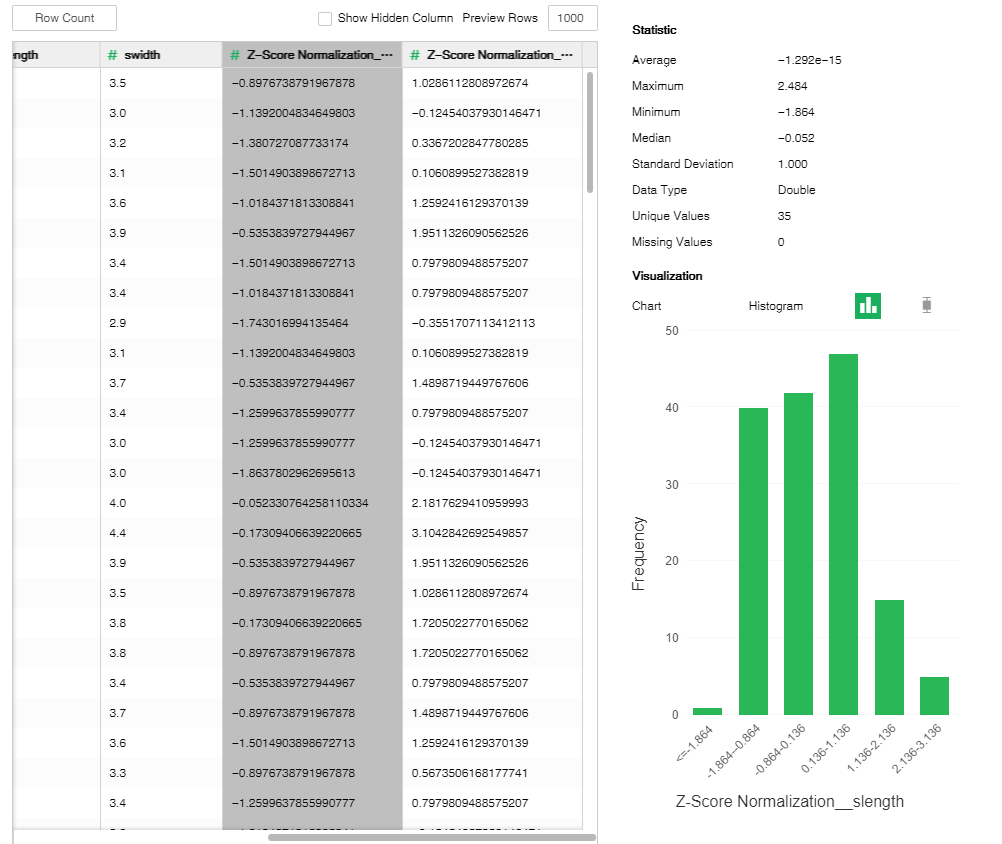
Increase and display the normalized columns in data preview area.See Data for other details.
