|
<< Click to Display Table of Contents >> Data |
  
|
|
<< Click to Display Table of Contents >> Data |
  
|
❖Data
The data contains all the data sets created in the data set module. Data set node is the input node of advanced analytics process. Drag a data set node to the edit area. The setting and display area contains three pages: metadata, filtering data, and exploration data.
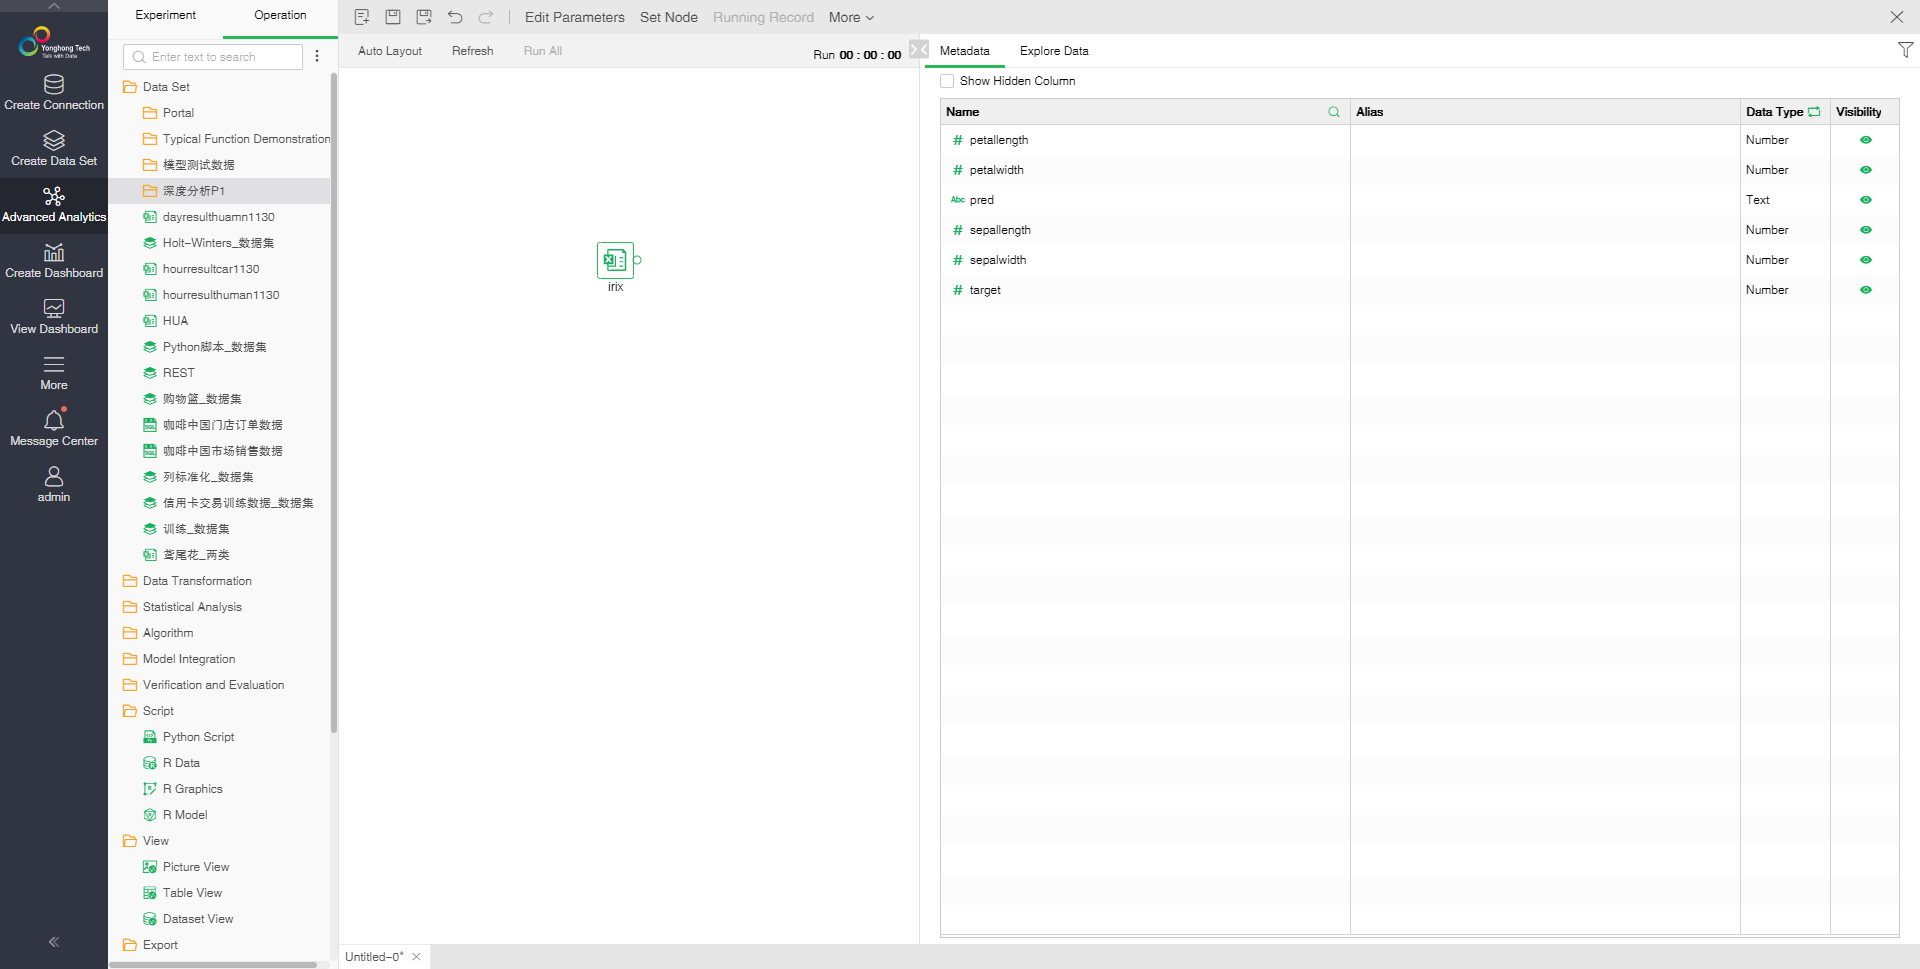
•Metadata
[Name] Name of the data set field.
[Alias] Another name can be set for newly established expression field. It is not allowed to set another name for original field of data set.
[Data Type] The data type of each field in the data set node cannot be modified.
[Visibility] Set display and hidden field on exploring data page.
[Expression] In the metadata area, you can click the right mouse button to create a JS expression and a numeric range, fill null values, create groups, split columns, remove white spaces, value aliases, and convert to a date column or number column. For details, see Data Types and Classification of "Create Data Set."。
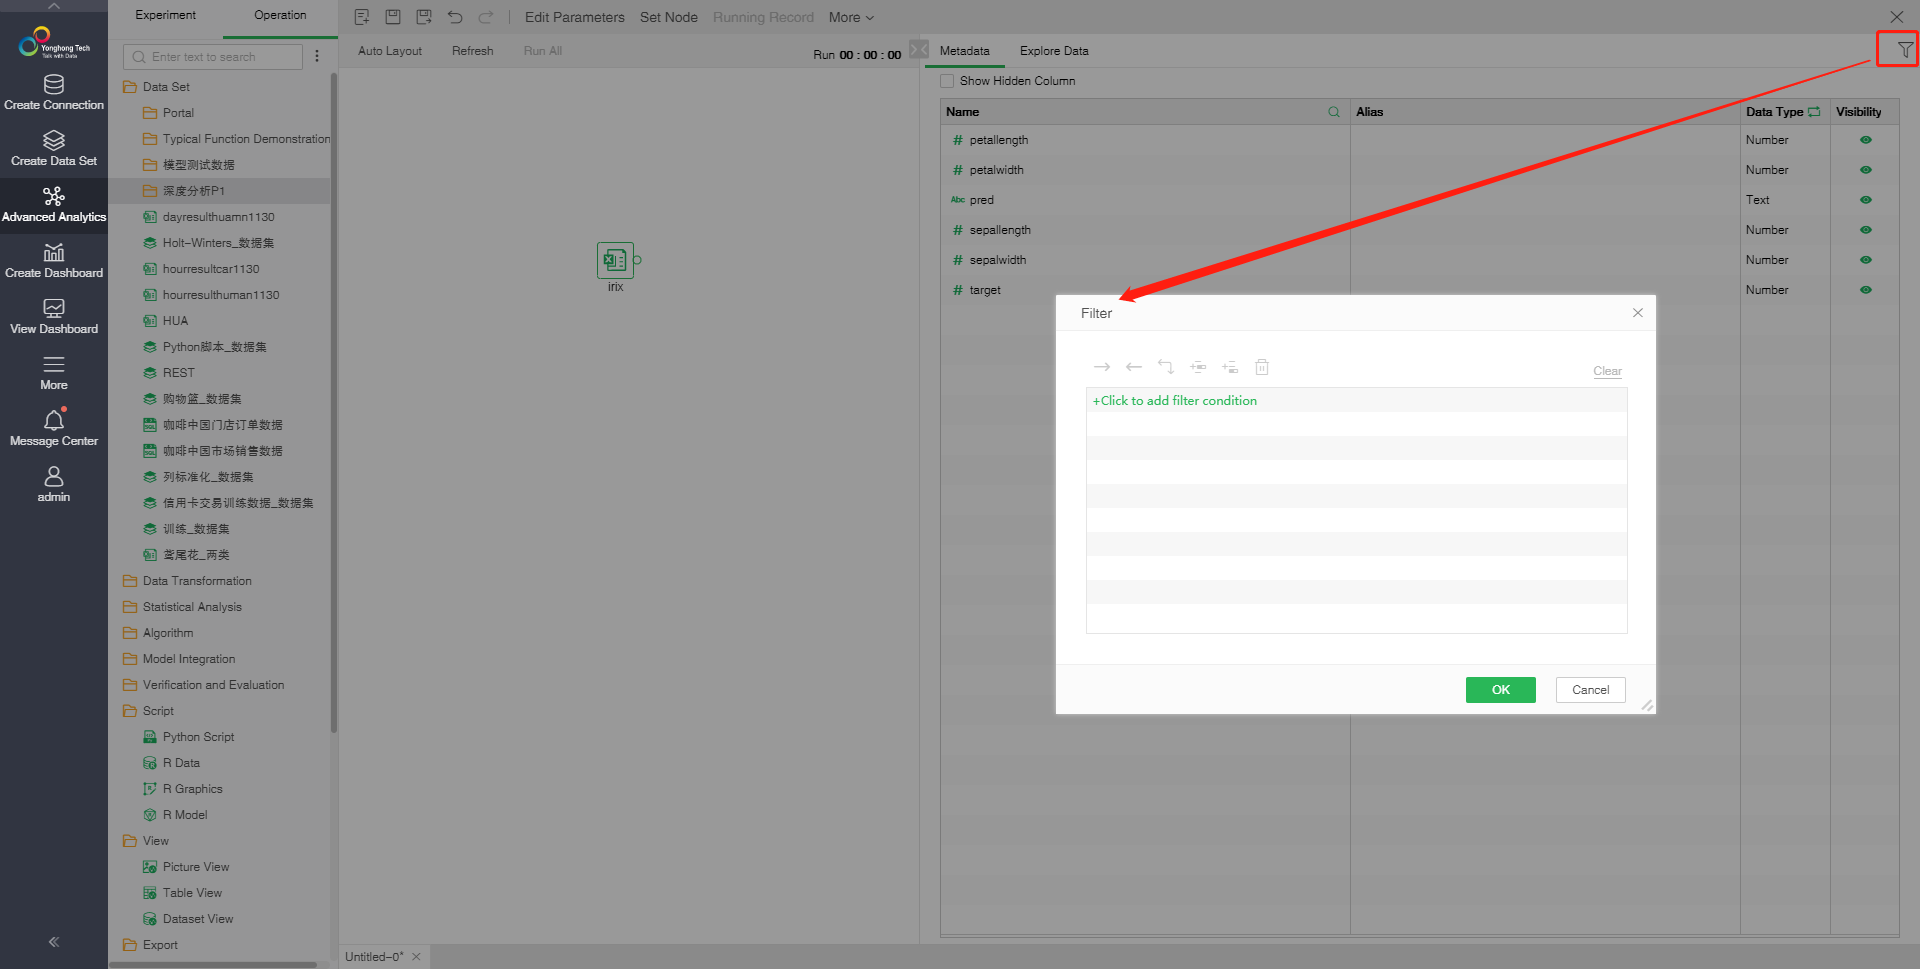
•Filter Data
The row data of a data set can be screened by adding a Filter. For details, see Filter in "Virtual Permission Control" of "Create Data Set."
•Explore Data
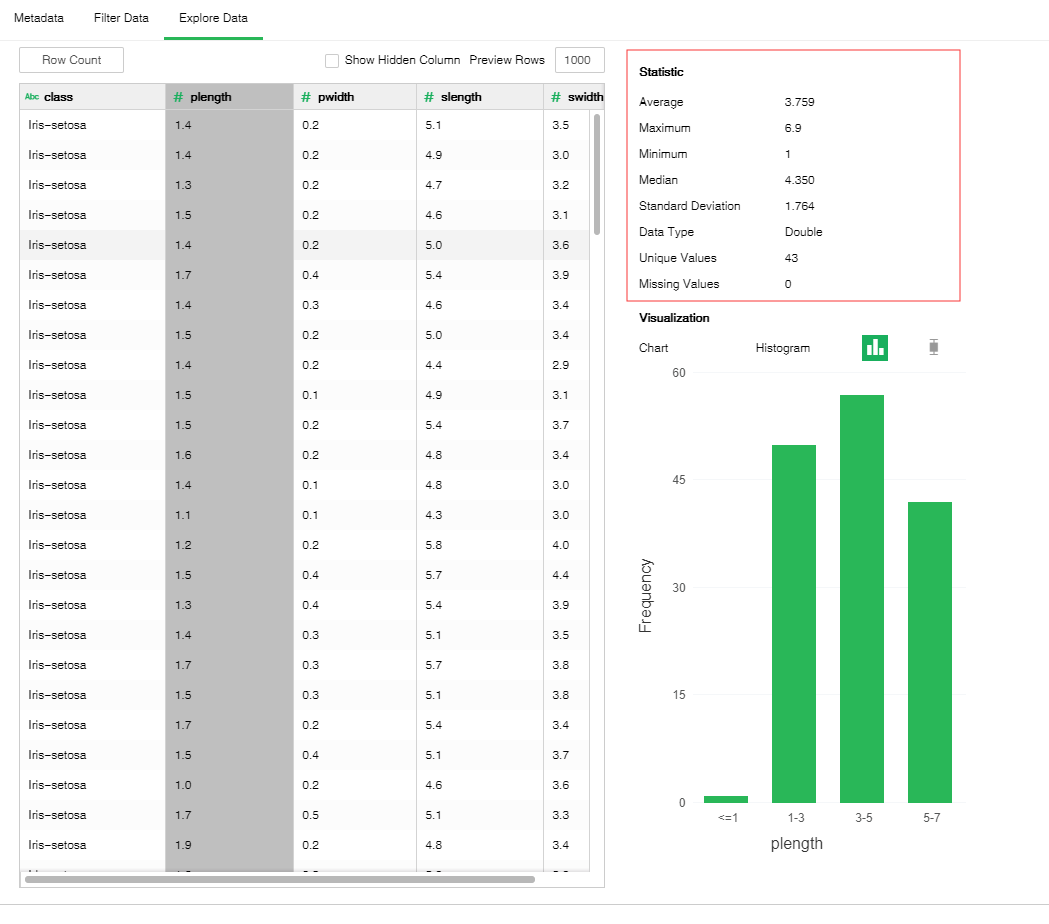
Carry out preliminary study in data exploration to better explain its special properties. It is helpful to select an appropriate data preprocessing and data analysis technique. t can even deal with problems that are usually solved by data mining. For example, the mode can be detected through visual inspection of data. In addition, visual interface is used in data exploration to better understand and explain data mining results. Data Explore interface is as shown below:
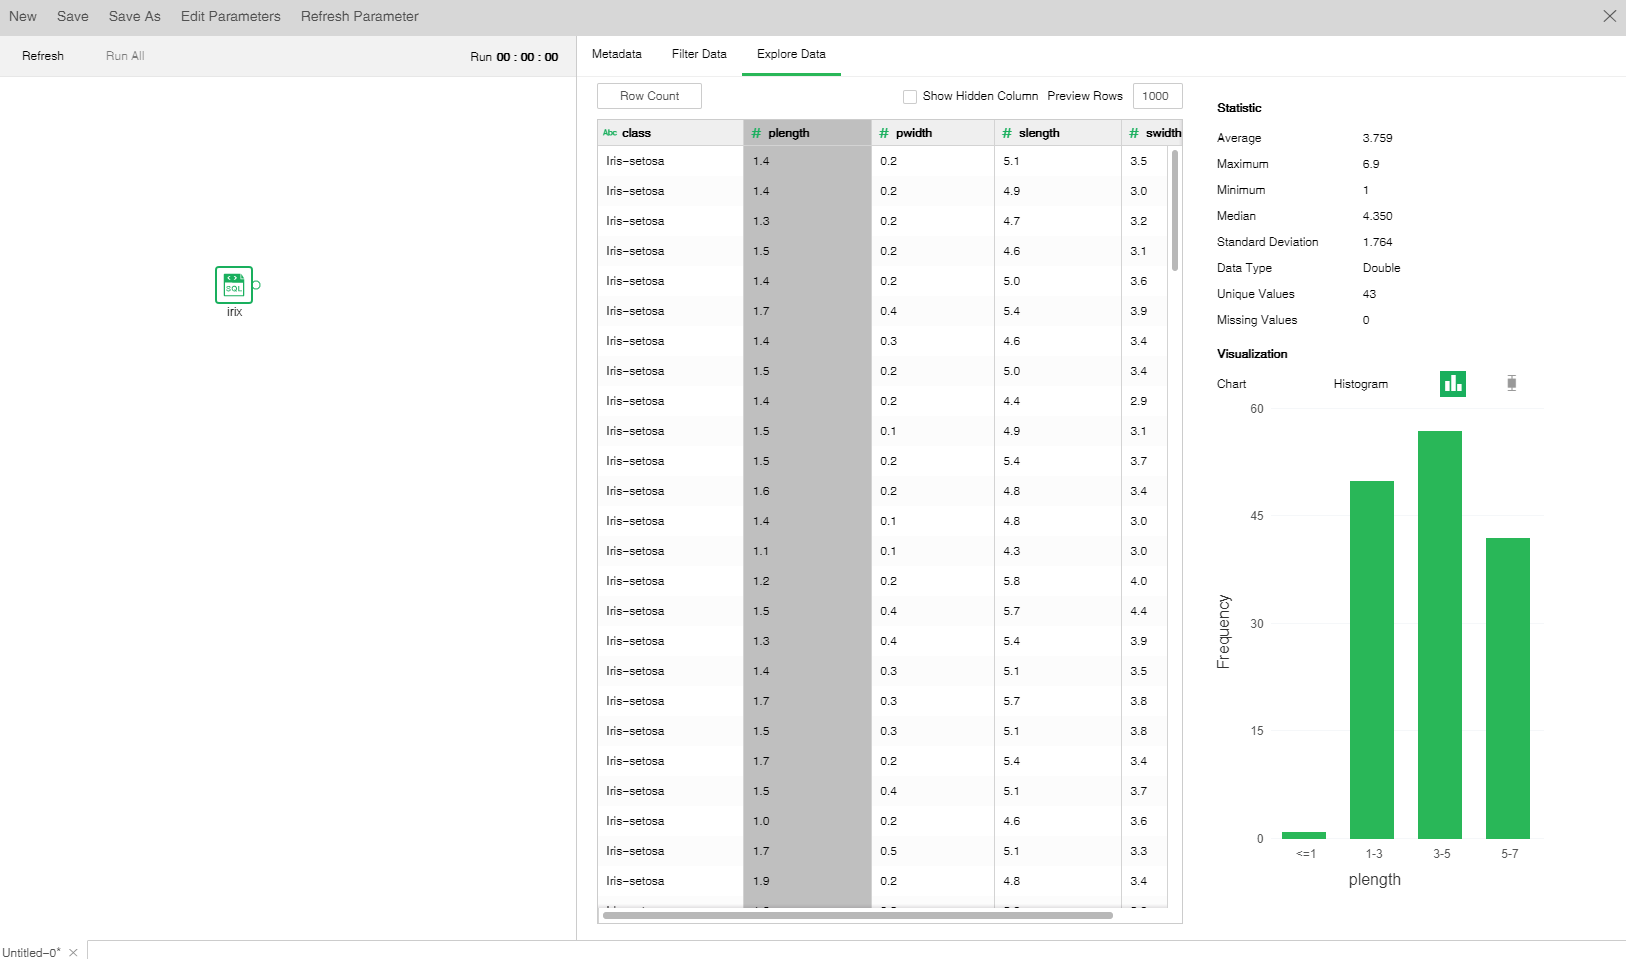
[Row Count] After click the button of "Display the total row number, total row number of preview data set node will be displayed behind the button.
[Preview Rows] Default display row number of data set node. The default value is 1000 rows. The number of preview rows can be modified. After the modification, click the blank to preview the changes of the number of preview rows.
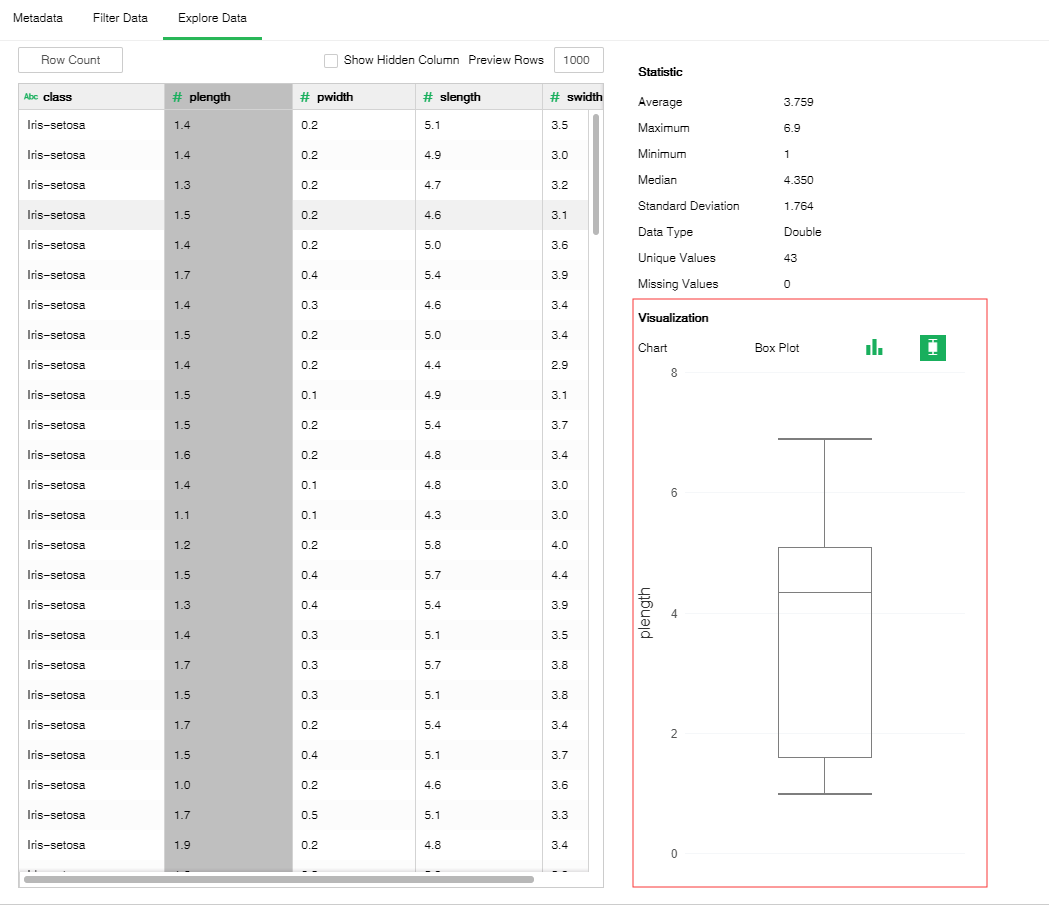
[Statistics] Statistical area displays the characteristic values of the selected columns. Select different columns to display the characteristic values of different columns in the left table.
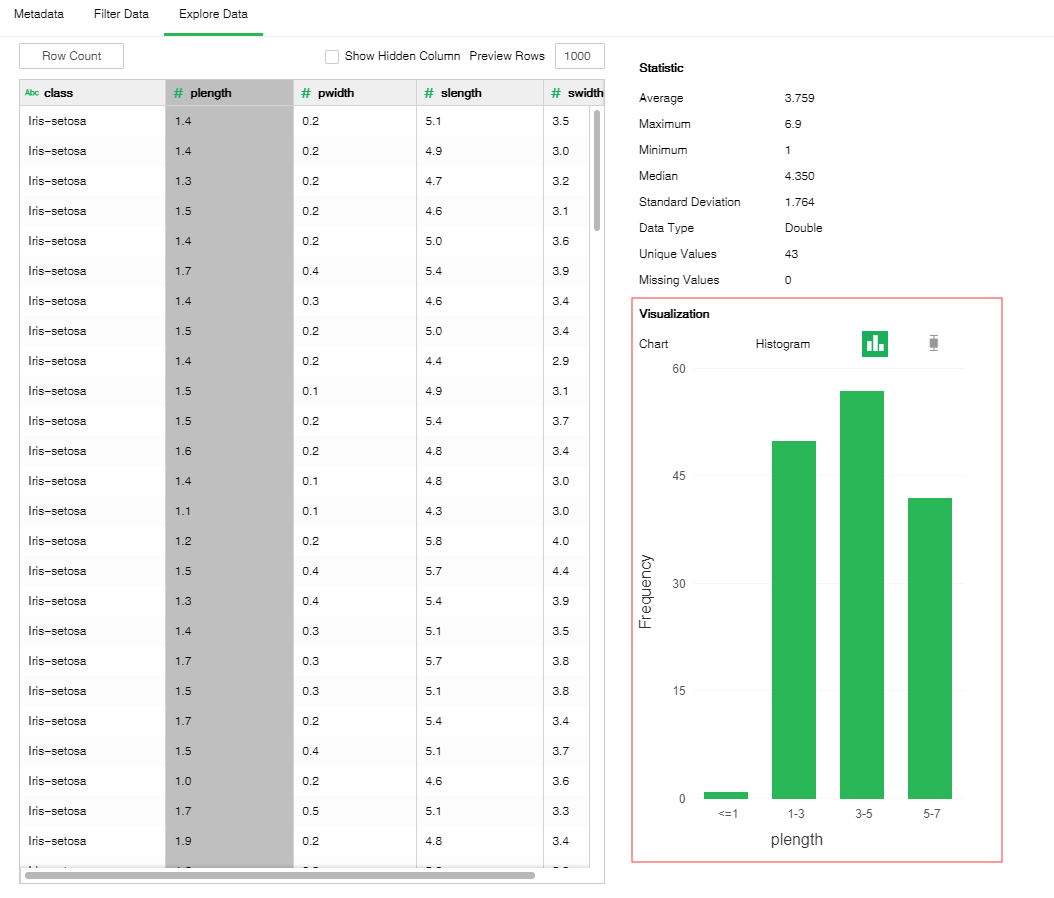
[Visualization] Visualization area displays the data analysis results of the selected columns via two types of charts: The histogram shows the data distribution of the selected columns; and box-and-whisker plot shows the data scope and exception data distribution of the selected columns. If the columns selected are non-data type, no chart will be drawn.
Histogram:
Box Plot:
