|
<< Click to Display Table of Contents >> K-Means Clustering |
  
|
|
<< Click to Display Table of Contents >> K-Means Clustering |
  
|
❖Demission Rate Analysis
By establishing a K-Means Clustering analysis model, an enterprise classifies employees and identifies potential demission employees as early as possible. Take relevant measures specifically to reduce the loss of employees by demission.
•Data Preparation and Correlation Analysis
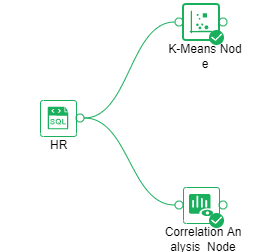
Drag the "HR" data set node to the edit area, and add Correlated Analysis nodes to connect to the data set node.

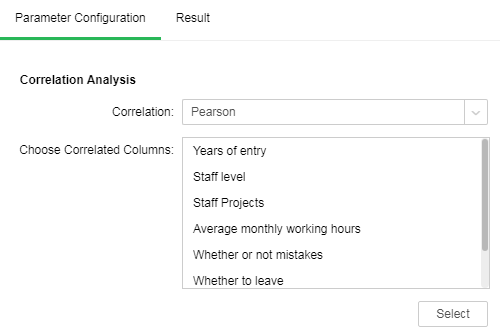
Configure correlation analysis nodes. Set "Correlation" to "Pearson", and add Years of entry, Staff level, Staff Projects, average monthly working hours, Whether or not mistakes, Whether to leave, Has it been promoted in the last five years and satisfaction to "Choose Correlated Columns."
Click "Result." The correlation coefficient between Whether to leave and satisfaction is -0.388, the correlation coefficient between Staff level and Staff Projects is 0.349, and the correlation coefficient between Staff Projects and average monthly working hours is 0.417, which are all within the range of low correlation.
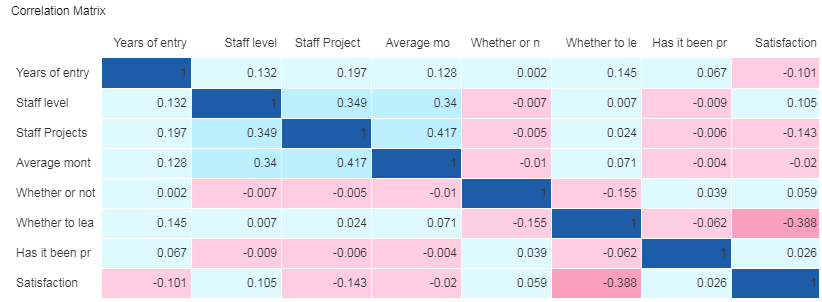
➢The size of correlation coefficient indicates that: |r|>0.95 significantly correlated; |r|≥0.8 highly correlated; 0.5≤|r|<0.8 moderately correlated; 0.3≤|r|<0.5 lowly correlated; |r|<0.3 extremely low correlation which is deemed as non-correlated
•K-Means Clustering
oConfiguration items
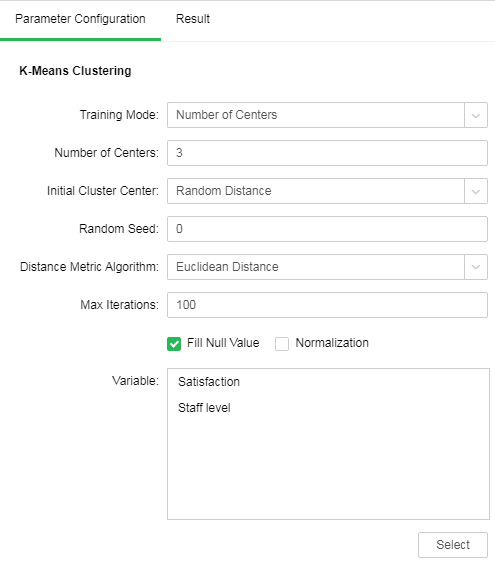
Add a K-Means Clustering node and connect data set nodes. Set "Number of Centers" to "3", "Initial Cluster Center" to "Random Distance", "Random Seed" to "0", and "Distance Metric Algorithm" to "Euclidean Distance." It choose missing data filling by default instead of normalization; add satisfaction and Staff level as independent variable.
oRunning
After parameter configuration, the K-Means Clustering node is under not running state.
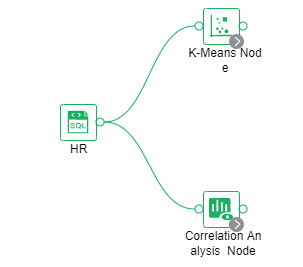
Right-click "K-Means Clustering" and choose "Run" from the context menu. After the operation succeeds, the nodes are displayed as follows:
oResult display
Click "Result." The result shows that employees are classified into three types based on satisfaction and Staff level, as shown in the following figure.
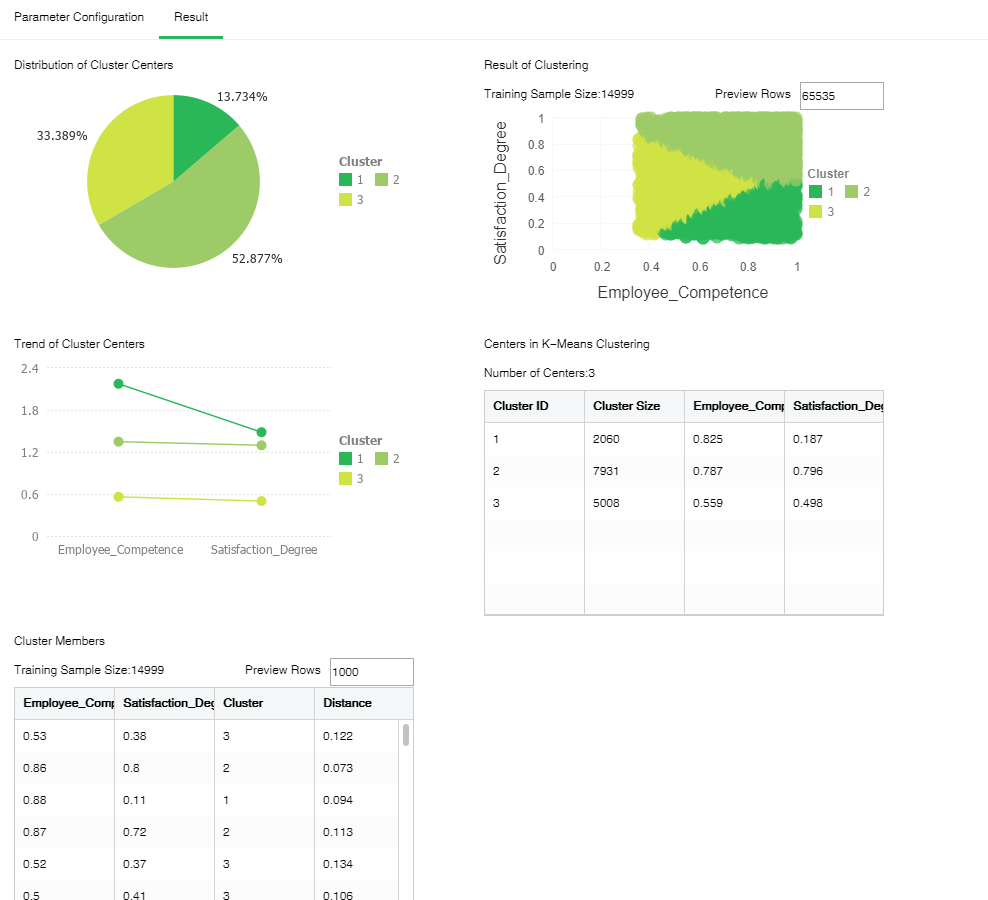
The "Centers in K-Means Clustering" table lists the specific values of the three clustering centers and the total sample number in each cluster. The "Cluster Members" table lists the detailed data of the samples in each cluster and the distance to the clustering center.
•Model Application
oApplication of the model in the dashboard
Select the "K-Means Clustering" node and save it as a training model. The saved model can be applied on the data set bound to the components of the dashboard in "Create Dashboard."
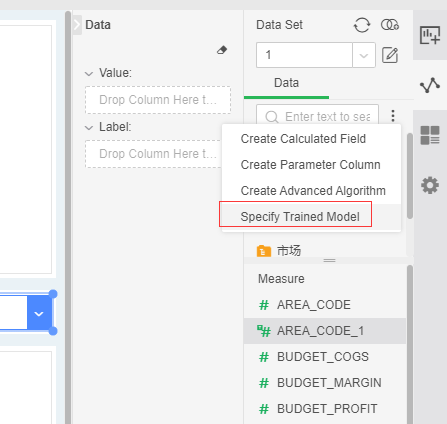
1.On the "Create Dashboard" page, select a data set to create a dashboard. Click the right mouse button and then choose "Apply Trained Model" from the context menu. Select the application training model by clicking the right button on the data set:
2.Open the "Specify Trained Model" dialog which displays only the models that can be applied to the bound data set.
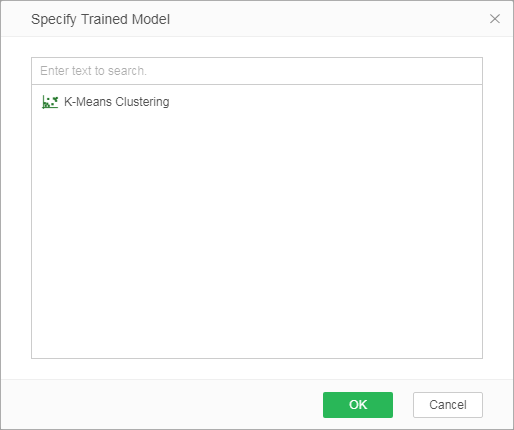
3. Select the saved training model "K-Means Clustering" and click "OK" to generate 2 columns, namely "Cluster" and "Distance." Cluster: Results of clustering classification; Distance: the distance between the point and clustering center.
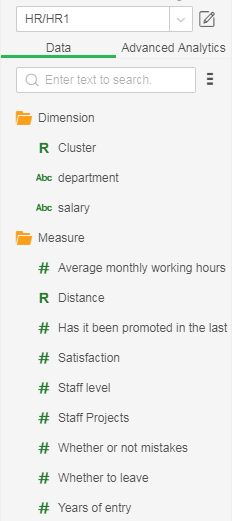
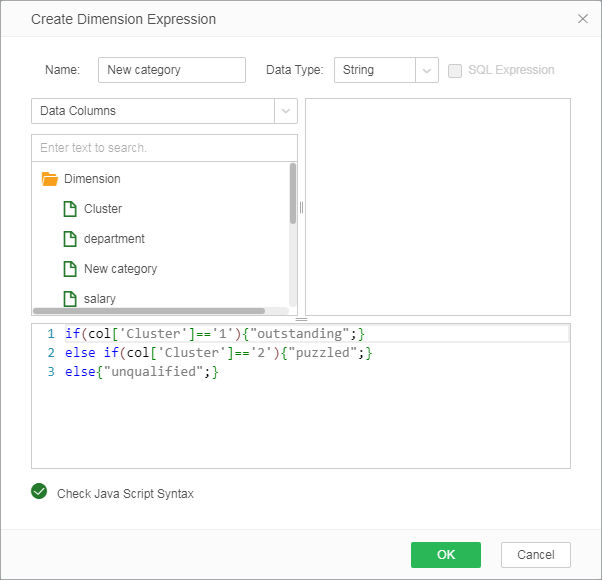
4. Create a dimension expression based on the application model result, and rename the three types as follows.
5. Bind the data to the chart component as follows, and select the line chart.
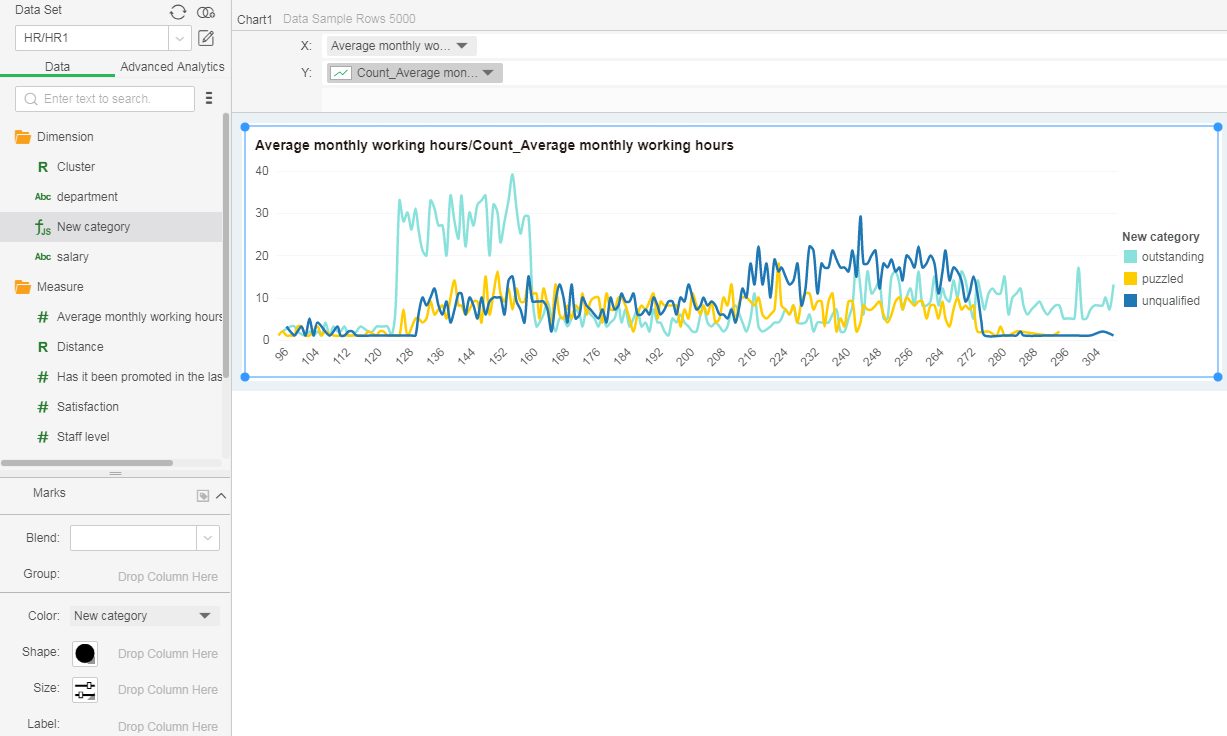
6. Set up a dynamic calculator on the fields of axis y: Summarize the percentage; get rid of the points on the mark and modify the size to get the following results. The above figure shows that the monthly working hours of the non-qualified people are concentrated on the left (lower). The working hour of confused workers is the longest followed by the excellent workers.

oScore
For details, see Logistic Regression of "Experiment and Application of Advanced Analytics."