|
<< Click to Display Table of Contents >> Logistic Regression |
  
|
|
<< Click to Display Table of Contents >> Logistic Regression |
  
|
❖Telecom Customer Churn
Telecom operator is able to identify the customers with a high probability of loss through the logistic regression model, in order to save the customers by more custom service.
•Data preparation
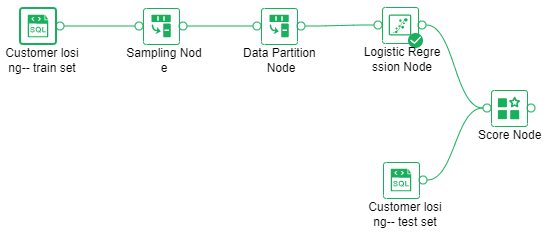
Drag the data set node "Customer losing-- train set” to the edit area. Add the "Sampling" and "Data Partition" nodes. Connect the "Sampling" node to the data set and "Data Partition" node to the "Sampling" node.

Sampling and data partitioning node configuration items are as follows:

•Logistic Regression
oConfiguration items
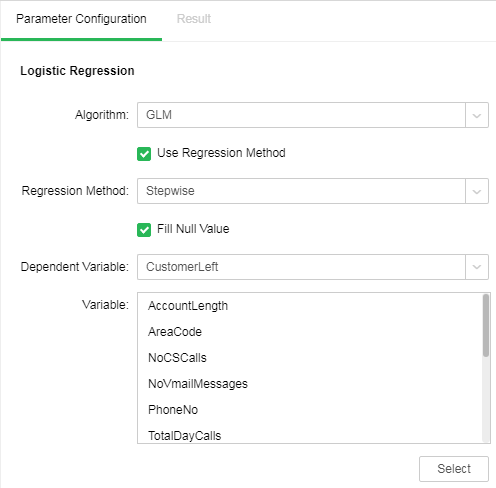
Add a "Logistic Regression" node and connect it to the "Data Partition" node. Set "Algorithm" to "GLM", select "Use Regression Method", set "Regression Method" to "Stepwise", select "Fill Null Value", and set "Dependent Variable" to "CustomerLeft" and "Independent Variable" to other columns.

oRunning
After parameter configuration, logistic regression node is under not running state.

Click the right button of logistic regression node for running. After successful running, the nodes are displayed as follows:

oResult display
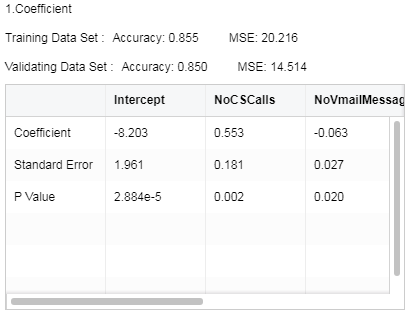
Coefficient of logistic regression equation can be obtained via model coefficient, including intercept term, coefficient and P value of each independent variable, and standard error. Accuracy and mean square error of validation set of model training set can be seen. All P values are small. The smaller P value, the better result will be.

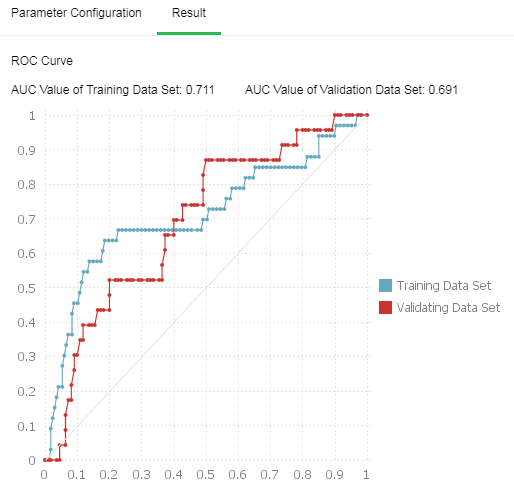
The ROC curve shows that the AUC value of training set is 0.711; that of validation set is 0.691. The larger AUC value, the better effect of model classification will be.

•Model Application
oSave as Trained Model
Select logistic regression node and save as a training model. The saved model can be applied on the data set bound to the components of the dashboard in Edit Dashboard. Use the model according to the actual analysis demands. The usage is similar to that described in "Logistic Regression" chapter in Modeling.
oScore
Add the data set node "Customer losing-- test set” and "Score" node. Connect the "Score" node to the "Logistic Regression" and "Customer losing-- test set" nodes.

Select the "Score" node. The "Explore Data" page shows the result that the trained logistic regression model applies to the data set "Customer losing-- test set", as shown in the following figure.
