|
<< Click to Display Table of Contents >> HoltWinters Time Series Analysis |
  
|
|
<< Click to Display Table of Contents >> HoltWinters Time Series Analysis |
  
|
❖HoltWinters Time Series Analysis
HoltWinters Time Series Analysis the sample data at regular time intervals within a certain period of time by considering the horizontal trend and seasonal trend to predict the data at a certain period of time in the future. That is, predict the future data based on the known historical data.
[Time Column] Select time field. Automatically calculate the time interval according to the selected time field data.
[Data Columns] Selected data field Establish an analysis algorithm on the data set binding to dashboard component. Or when use fast analysis algorithm for charts, an aggregate function needs to be selected for grouping of time column. Perform data column aggregation. Carry out time series analysis for data after grouping aggregation.
[Period] Integer multiples of the time interval are required. Calculate the frequency depending on the period and time interval (period/time interval), namely the number of observations per unit time. The system will automatically fill in a reasonable value to a circle according to the time interval. The value can be manually modified.
[Prediction Period] Backward prediction span needs to fill in integral multiples of time interval. After select the time column, the system will automatically fill in a reasonable value which can be manually modified.
[Trend (beta)] Indicates whether longitudinal trend is considered or not. It is clicked by default which indicates fitting according to longitudinal trend.
[Output value]: When the predicted value is clicked, it means that a fitting value field will be obtained. When the confidence interval is clicked, it means that a upper limit and lower limit field will be obtained.
[Seasonal (gamma)] Indicates whether seasonal trend is considered or not. If it is not selected, non-seasonal model fitting is enabled. If it is set as clicking, carry out seasonal model fitting. A seasonal pattern can be additive or multiplicative. Additive is clicked by default which indicates growth according to the trend of seasonal additive. When multiplicative is clicked, it shows seasonal multiplication trend growth. In case of seasonal model fitting, there should be at least two data points within a period. That is, the frequency is equal to or greater than 2, and the time series contains at least two periods.
[Output value] [Predicted Values]: When they are clicked, a fitting value field will be obtained. The results are based on the obtained model. Predict the predicted time span and calculate the predicted value.
[Output] [Confidence Bands]: If "Confidence Bands" is selected, calculate the upper limit and lower limit of the estimated value based on Level. The default Level is 95%.
•For example
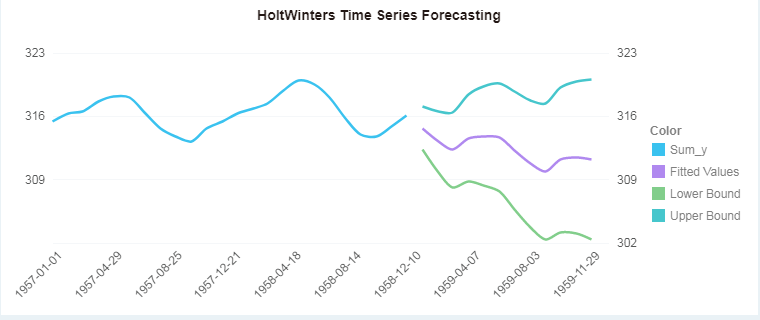
Assume that the data is from January 1957 to December 1958 keeping a time interval of 1 month. Set "Period" to six months and "Prediction Period" to 12 months while carrying out HoltWinters Time Series Analysis .
If "Trend (beta)" is set to "No" and "Seasonal (gamma)" is not selected:
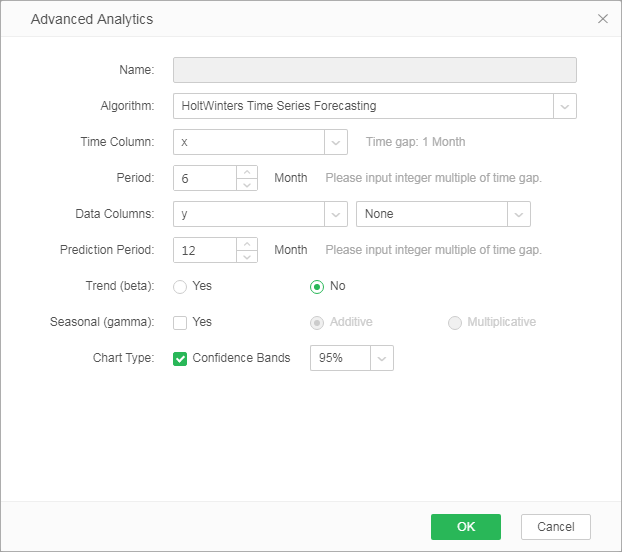
The predicting outcome is as shown in the figure:
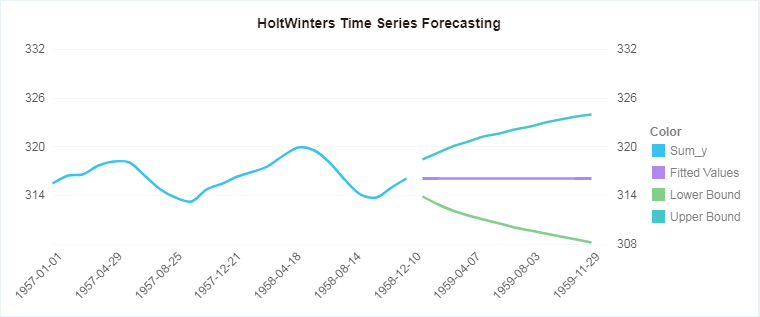
If "Trend (beta)" is set to "Yes" and "Seasonal (gamma)" is not selected:
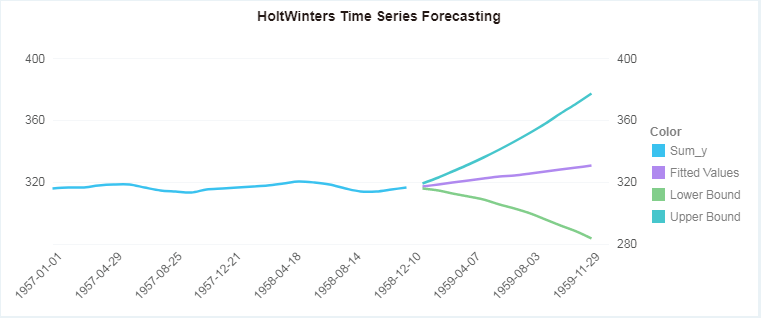
If "Trend (beta)" is set to "No" and "Seasonal (gamma)" is set to "Additive":
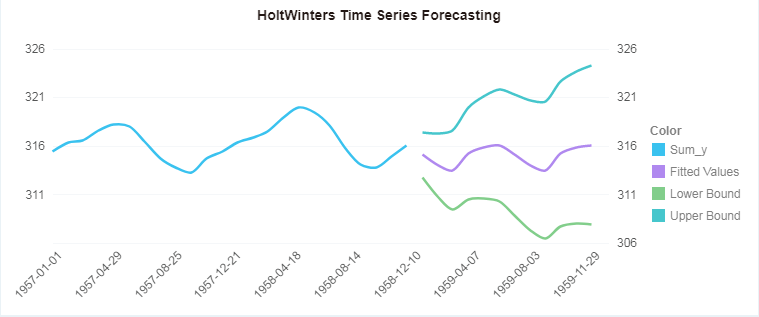
If "Trend (beta)" is set to "Yes" and "Seasonal (gamma)" is set to "Multiplicative":
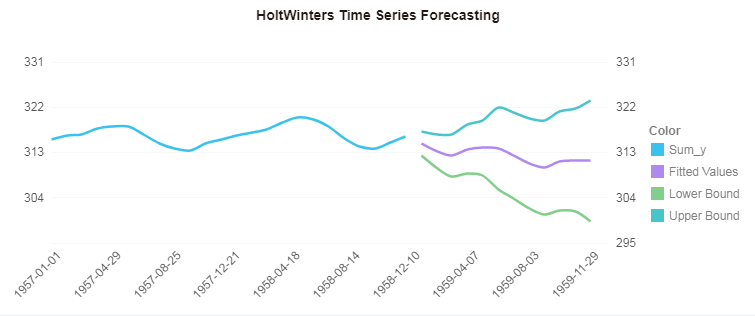
If "Trend (beta)" is set to "Yes" and "Seasonal (gamma)" is set to "Additive":
