|
<< Click to Display Table of Contents >> Script |
  
|
|
<< Click to Display Table of Contents >> Script |
  
|
Script include Python Script,R Data,R Graphics,R Model.
❖Python Script
Python script nodes can connect to data nodes, input scripts for modeling, or connect to Python scripts for validation.
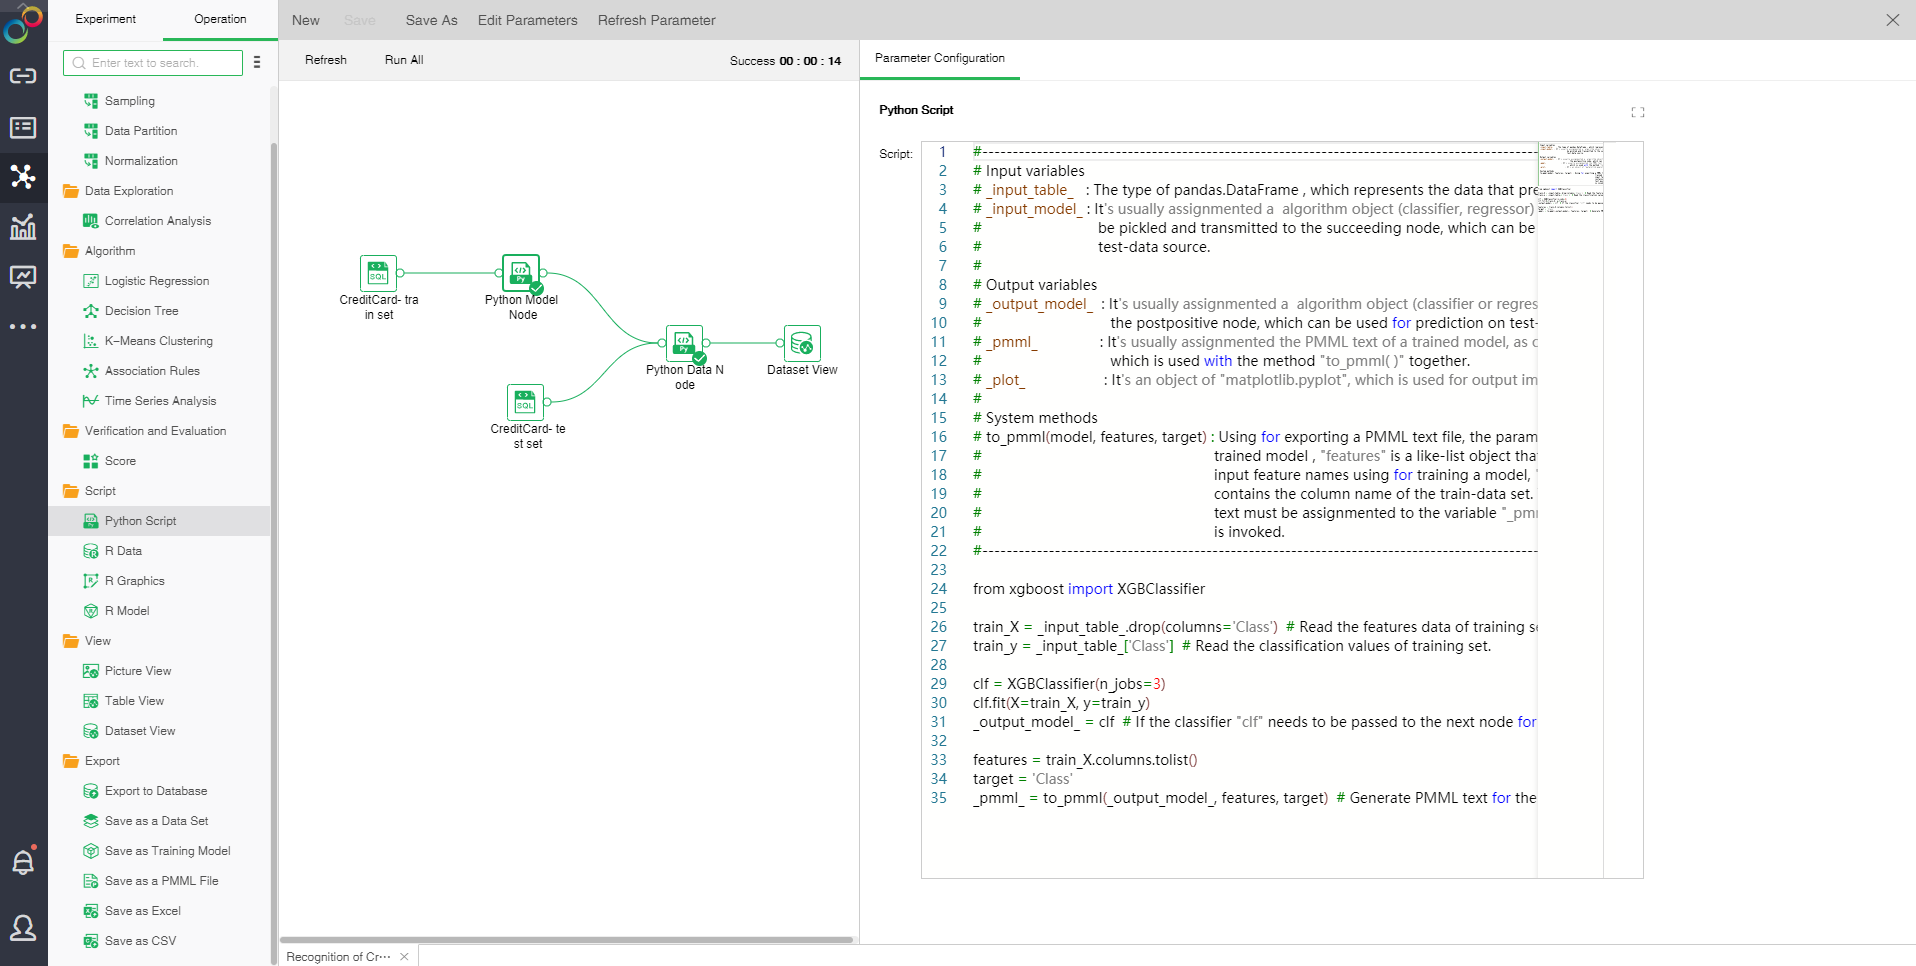
Drag and drop a dataset to connect to a Python script node. Select Python script node settings and display area with only one page: configuration item.
❖Configuration of Python script
•8.5-9.0 interface
Python script node has Input variables,Output variables,System methods.
Input variables
_input_table_ : The type of pandas.DataFrame , which represents the data that prepositive node outputs.
_input_model_ : It's usually assignmented a algorithm object (classifier, regressor) or any other object can be pickled and transmitted to the succeeding node, which can be used for prediction ontest-data source.
Output variables
_output_model_ : It's usually assignmented a algorithm object (classifier or regressor) and transmitted to the postpositive node, which can be used for prediction on test-data source.
_pmml_ : It's usually assignmented the PMML text of a trained model, as one of the node outputs,which is used with the method "to_pmml( )" together.
_plot_ : It's an object of "matplotlib.pyplot", which is used for output image data.
System methods
to_pmml(model, features, target) : Using for exporting a PMML text file, the paramenter "model" is your trained model , "features" is a like-list object that contains all ordered input feature names using for training a model, "target" is a string that contains the column name of the train-data set. The generated PMML text must be assignmented to the variable "_pmml_" when the method is invoked.
•9.1 New interface
Changes to the Python script node:
(1) The 8.5-9.0 interface is still compatible. Only experiments created in the old version can still run normally when imported to 9.1. However, since it cannot support multiple data set input, do not use 9.0 and 9.0 in experiments newly created in version 9.1. Previous interface;
(2) The new API is used with DM-Engine_v1.2 from product 9.1, and scripts can be written offline using python SDK v0.2;
yonghong.script.port is a sub-toolkit for writing custom python scripts, including two tool classes: EntryPoint: The input and output ports of the current script node Input: The data input of this node, to access certain data of a pre-node can be like this: entry.input['Data Set Node 1'][ResourceType.DATAFRAME] means Obtain the output data set of "Data Set Node 1"; output: the data output of this node; dataset: the dataset to be output model: the model to be output pmml: pmml to be output images: The png image data to be output, how to use images.put_image_from_plot("Picture Name 1", plot) ResourceType: the enumerated type of input and output data, DATAFRAME means data set, MODEL means model |
❖R Data
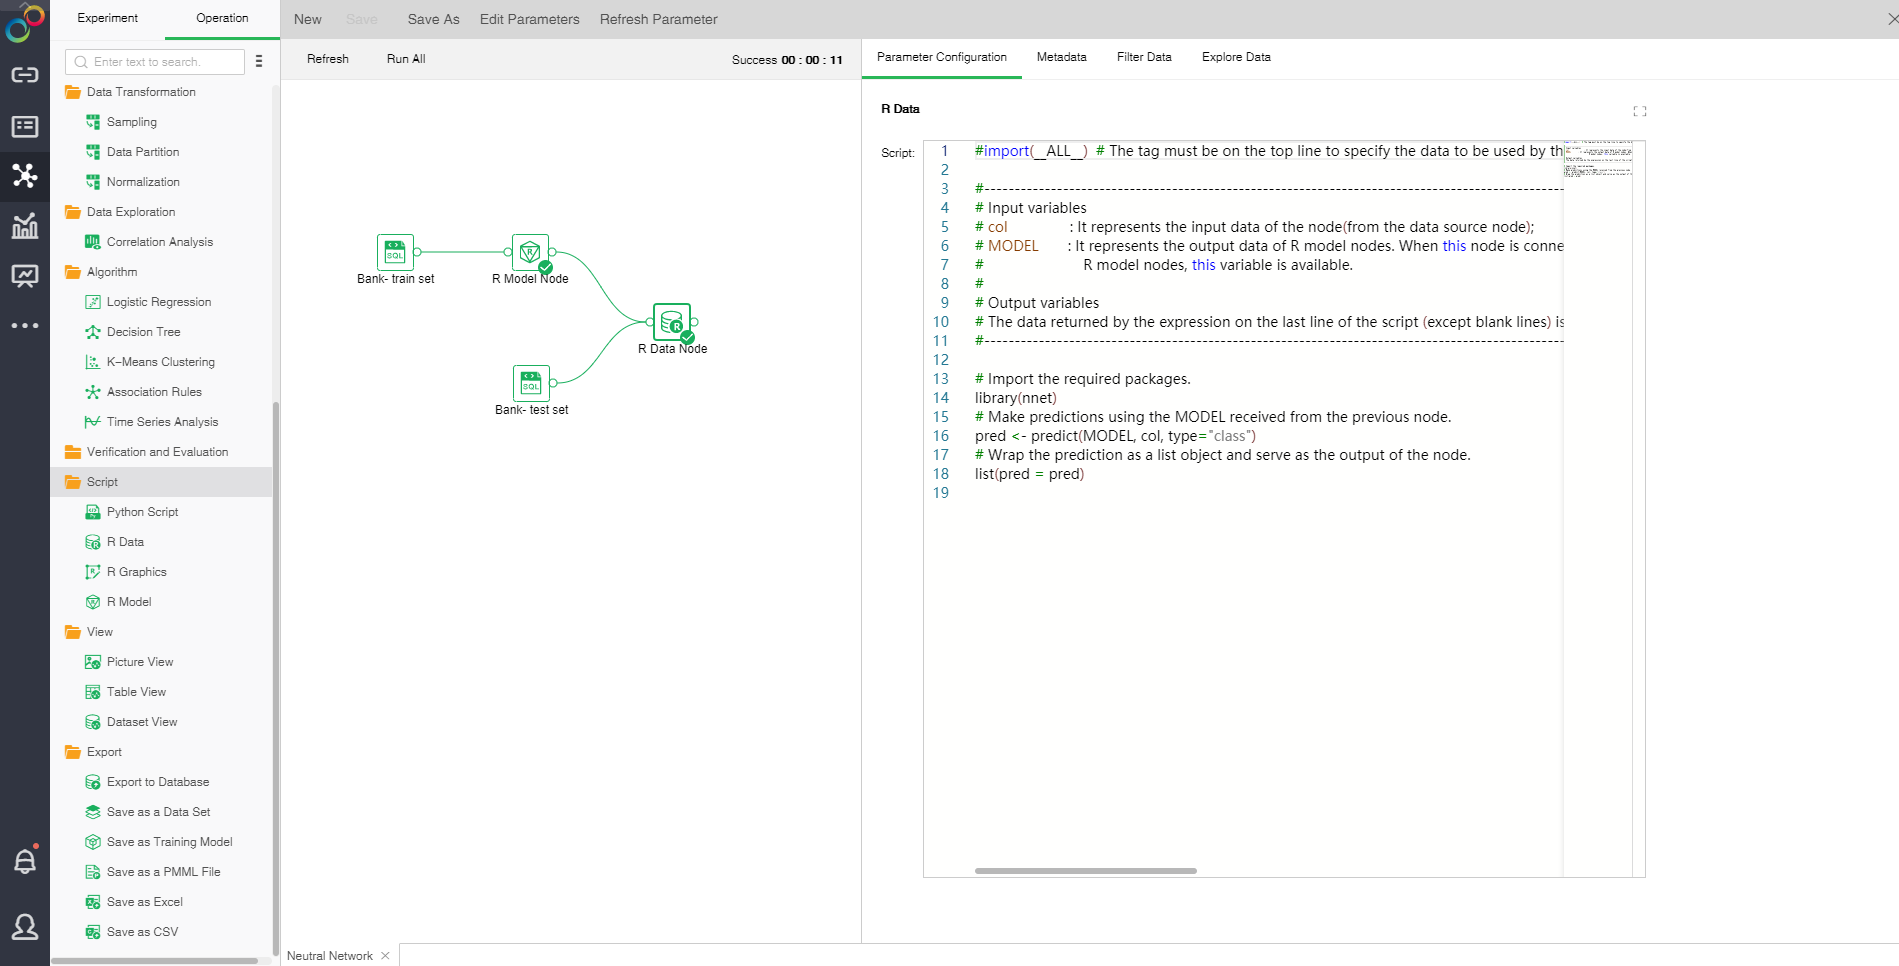
The "R Data" node can only connect to the "R Model" node. The input script represents the data of an R model in the form of a table.
Connect an R model node. Input the script and select "R Data." The display area contains four tab pages, namely "Parameter Configuration", "Metadata", "Filter Data", and "Explore Data."
oParameter Configuration
R data can directly reference MODEL variables. The value of corresponding column in a data set can be imported via col[[“xxx”]] where xxx is a column name; the parameter value can be imported via param[[“xxx”]] where xxx is a parameter name. For custom scripts, R takes the finally executed code line results as the returned value. Yonghong Z-Suite requires that the returned value must be a list object containing several returned value columns. For example, list(out1=a, out2=b), where out1, out2 are the names of returned value columns and a and b are values of corresponding returned value columns. They can be a constant or vector.
oMetadata
See Data for details
oFilter Data
See Data for details
oExploration Data
See Data for details
❖R Graphics
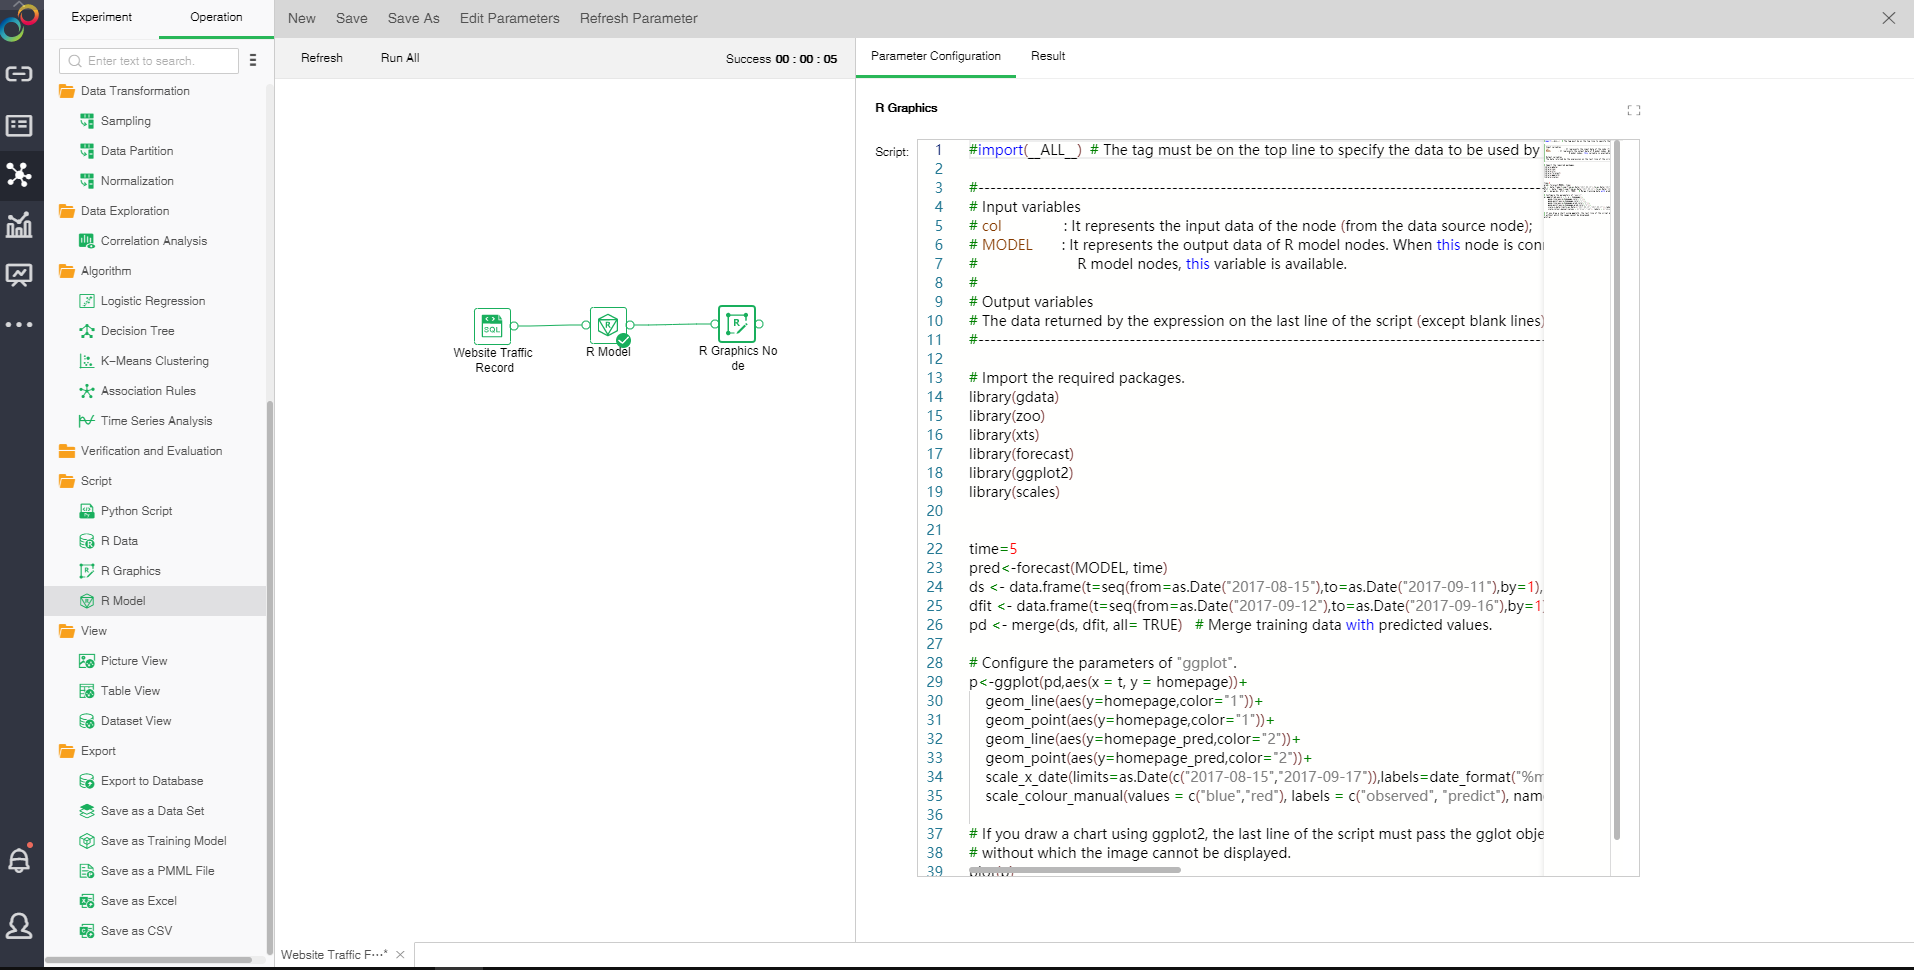
The "R Graphics" node can only connect to the "R Model" node. The input script represents the data of an R model in the form of a graphic.
Connect an R model node. Input the script and select "R Graphics." The display area contains two tab pages, namely "Parameter Configuration" and "Result."
oParameter Configuration
Input script to reference an R model. R graphics can directly reference MODEL variables. and can reference R Scripts for Drawing.
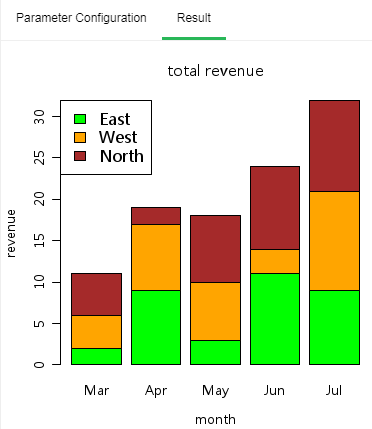
oResult
The result of R model is shown in the form of a graphic.
❖R Model
You can use the R model node to reference any R package to connect R data or R drawing for analysis.
Drag a data set and a R model node to the edit area. Connect the data set and R model node. Select "R Model." The display area contains only one tab page, "Parameter Configuration."
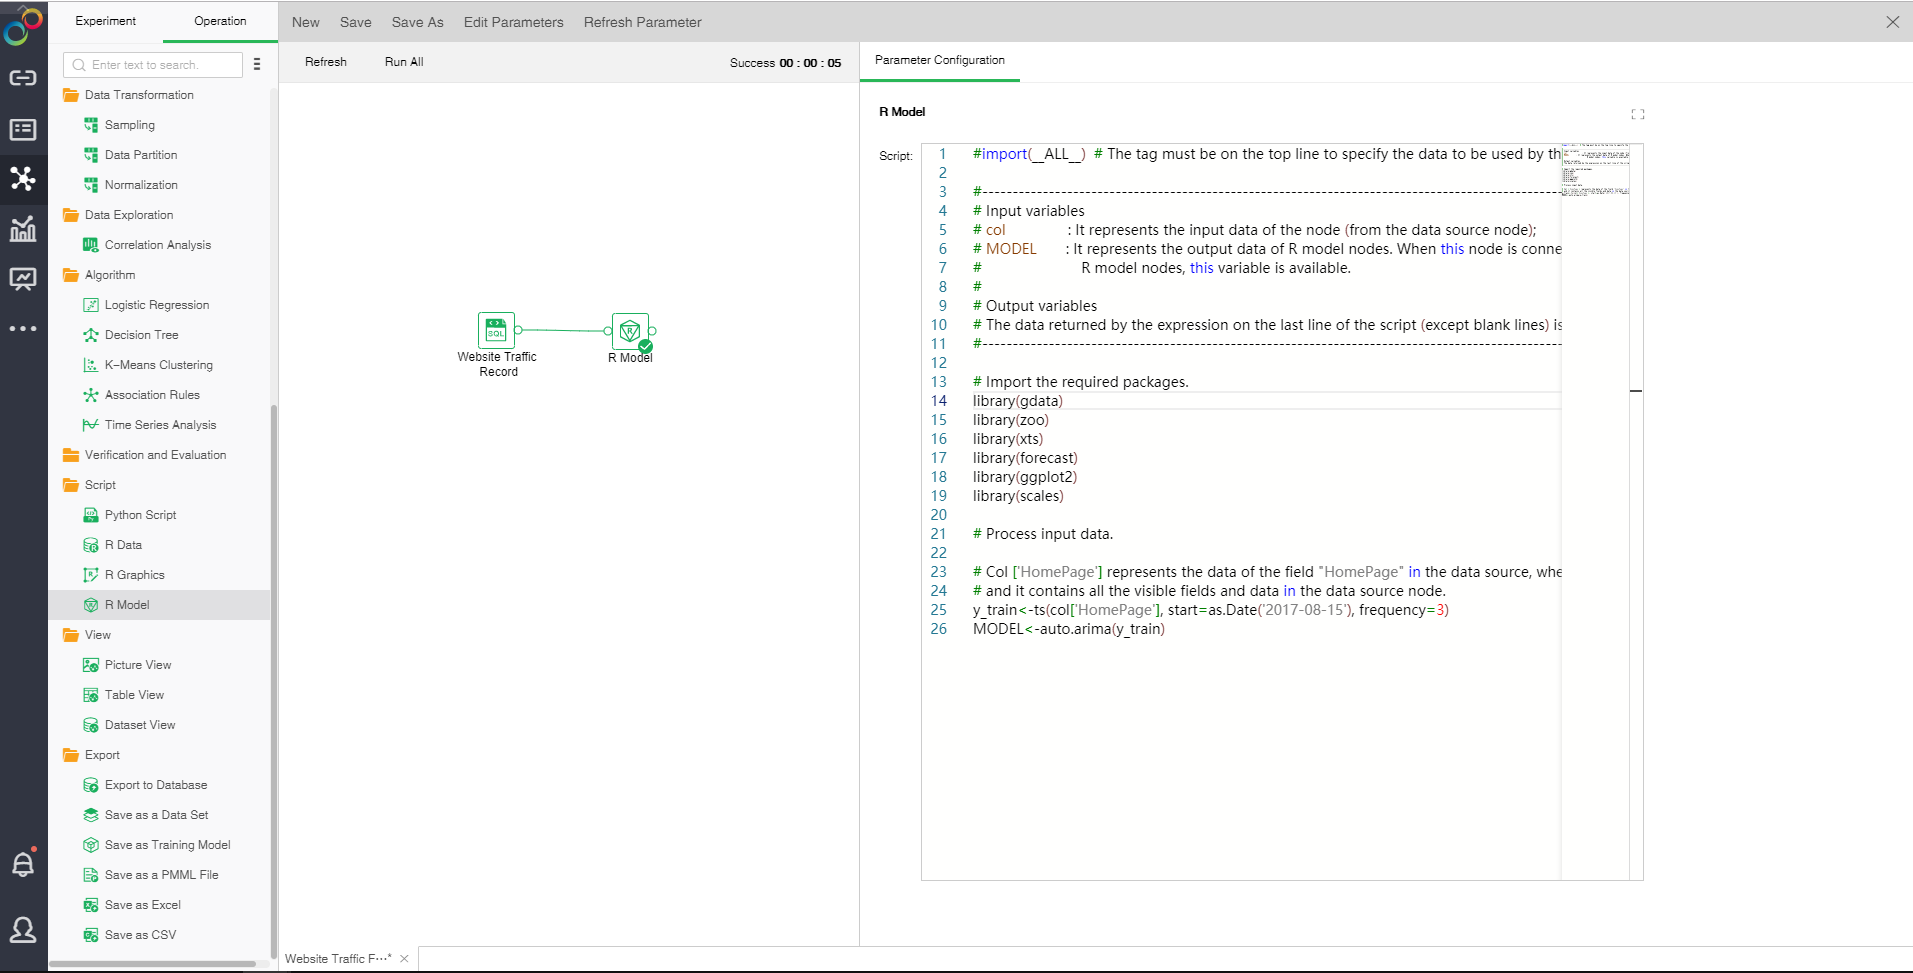
oParameter Configuration
[Script] Reference R package script. The final results must be stored to MODEL variable as a returned value.
Click the upper right button. A script input box will pop up to make input easier.R Model
You can use the R model node to reference any R package to connect R data or R drawing for analysis.
Drag a data set and a R model node to the edit area. Connect the data set and R model node. Select "R Model." The display area contains only one tab page, "Parameter Configuration."

oParameter Configuration
[Script] Reference R package script. The final results must be stored to MODEL variable as a returned value.
Click the upper right button. A script input box will pop up to make input easier.