|
<< Click to Display Table of Contents >> Statistical Analysis |
  
|
|
<< Click to Display Table of Contents >> Statistical Analysis |
  
|
❖Statistical Analysis
This statistical analysis refers to the plug-in operator of Y-AI, including four operators: t test, analysis of variance, chi-square test and correlation analysis.
•T-test
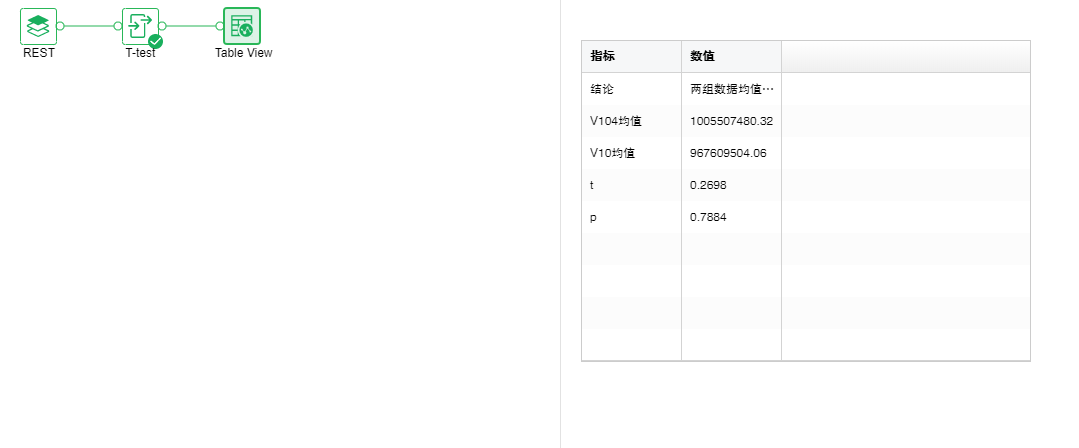
The data is subjected to T-test, which is mainly used for normal distribution with small sample size and unknown population standard deviation. The T-test uses the t distribution theory to infer the probability of the difference, so as to compare whether the difference between two averages is significant.
Parameter list: Modify various calculation methods of t test by changing parameters.
Output list: The conclusion can be viewed through the connection table view.

•Analysis of Variance
Determine whether one or more categorical factors have a significant impact on the experimental results.
Parameter list: set the p value. If the P value of the factor is less than the preset value, the factor has a significant impact on the result, otherwise there is no significant impact.
Output list: conclusions and variance analysis results can be viewed through the connected table view.

•Chi-square Test
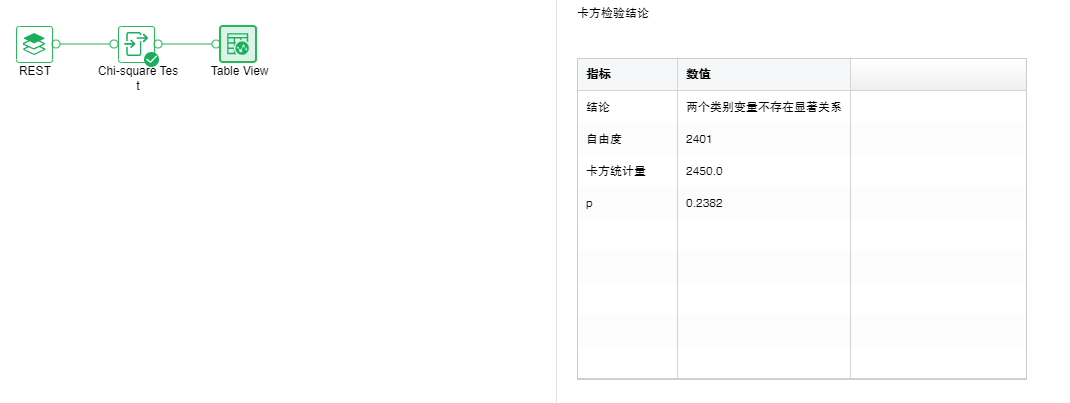
Analyze whether the relationship between two categorical variables is significant
Parameter list: Whether to enable Yates continuity correction.
Output list: The conclusion can be viewed through the connection table view.

•Analysis of Correlation
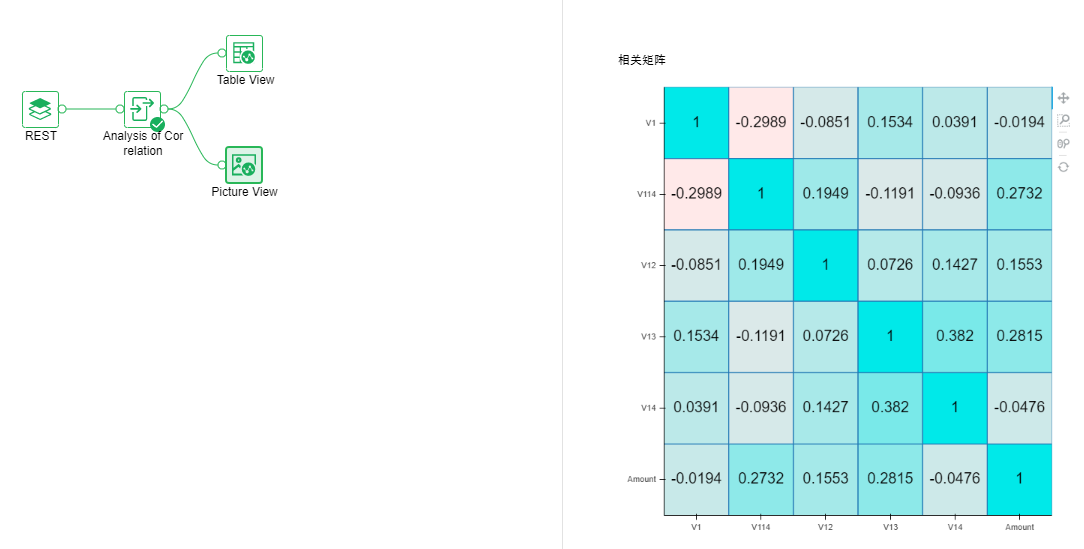
Analysis of Correlation (correlation analysis) is to study whether there is a certain dependency between phenomena, and to explore the relevant direction and degree of the specific dependent phenomena, and it is a statistical method to study the correlation between random variables. There are three calculation methods for correlation measurement: Pearson, Kendall, Spearman.
Parameter list: select the calculation method.
Output list: correlation analysis matrix. It can be viewed by connecting table view and picture view.
