|
<< Click to Display Table of Contents >> General Toolbar |
  
|
|
<< Click to Display Table of Contents >> General Toolbar |
  
|
The Yonghong Z-Suite toolbar (General) provides a control bar for displaying the bitmap button row associated with dashboard creation. By operating the bitmap button, the user can create an architecture of the dashboard, design the layout of each display module, and provide a platform for subsequent data content operations.
[New] Click the New button to create a new dashboard in the dashboard edit area.
[Save] When the user saves the newly created dashboard, the Save As dialog box will pop up. The user can set the save path and the name of the dashboard. When the user opens an existing dashboard, modify the dashboard and click the Save button to save it.
[Save As] also saves the opened dashboard.
[Undo/Redo] Undo or redo the edit operation on the dashboard.
[Report Settings] Setting Report Layout and Advanced Properties
1. Layout
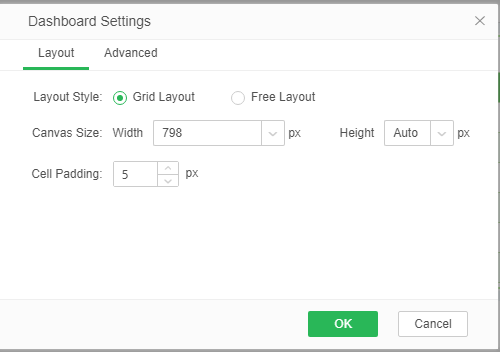
1.Layout method: The dashboard editor contains two layout methods: smart layout and free layout, where the default is smart layout. Smart layouts can be switched to free layouts, but free layouts cannot be switched back to smart layouts.
2.Canvas size: The width of the instrument panel can be customized. Smart layout, the default width: 1024px, high: automatic, free layout, the default width and height are automatic.
3.Intra-gap spacing: Under the smart layout, set the inner spacing of components and grids. This option is not supported under free layout.
2. Advanced
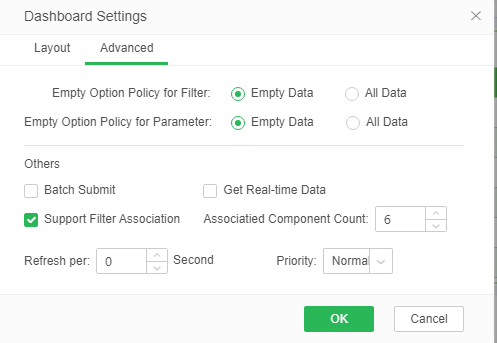
1. Empty option strategy of parameter component: When all the parameter components and custom parameters are unchecked or the filter value is entered, the empty data set or all data is displayed when the preview mode is entered. The default is an empty data set.
2. The empty option policy of the filter component: When all filter components are not checked with the filter value, the empty data set or all data will be displayed when the preview mode is entered. The default is the empty data set.
3. Batch submission: Batch submission check indicates that the data in multiple selection lists is checked and submitted together in the component.
4. Get real-time data: Get real-time data Check to indicate that the components in the current dashboard can get the latest data.
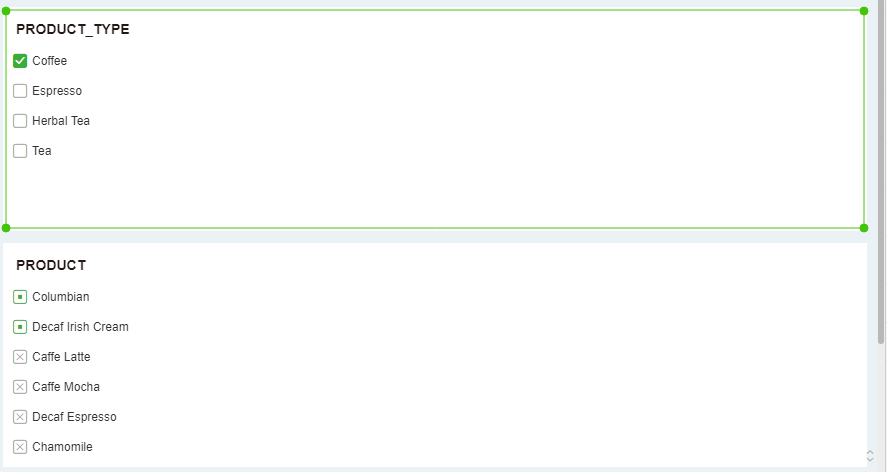
5. Whether the filtering components are related to each other: whether the filtering components are related to each other indicates that the filtering components in the current dashboard are related to each other. By default, the filtering component is selected and the default associated component value is 6. As shown below
6.Refresh interval: set a time, such as 10s, the page will refresh every 10s.
7.Priority: Sets the priority for the dashboard, optional: Lowest, Lower, Medium, High, Highest, Default is Medium. When the behavior of competing resources occurs in the system, for the execution of the dashboard, the user with the highest priority executes first. If the user's priorities are the same, then the priority of the dashboard is used to determine who is performing the priority.
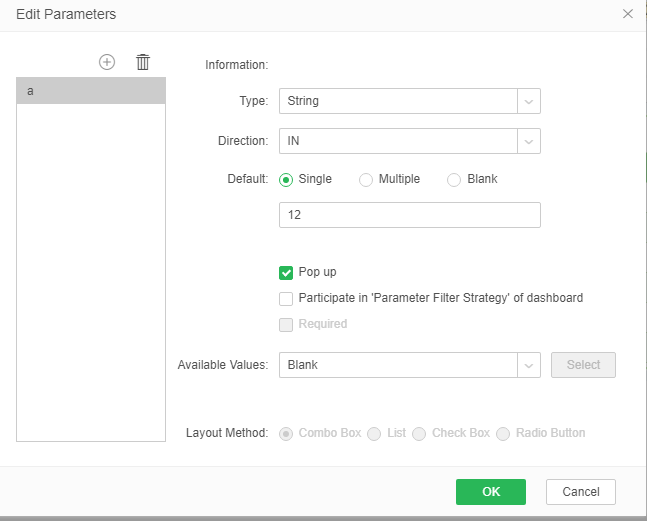
[Edit parameters] can add parameters to the current dashboard, delete parameters and collect the parameters used in the dashboard, edit the parameters dialog box as shown below.
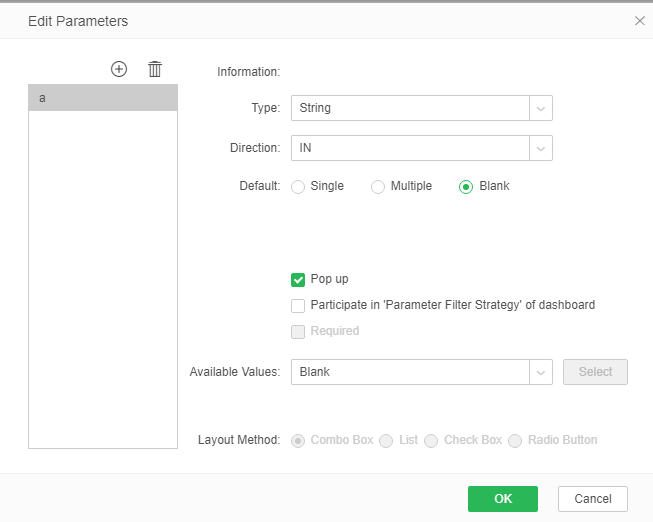
[Add/Delete] When the user clicks the Add button, a name edit dialog box appears. The user can set the name of the parameter. After setting the parameters, it is not supported to rename this parameter. In the case of a collected parameter, this parameter cannot be deleted in this dialog, but this parameter can be edited. When the collected parameter is deleted, the parameter can be deleted in the parameter dialog box.
[Information] shows where the parameter is referenced.
[Type] The user sets the data type of the current parameter.
[Default] User can set the default value of the parameter. Users can set individual values, multiple values, or null values. When the user selects multiple values, the parameters need to be separated by commas.
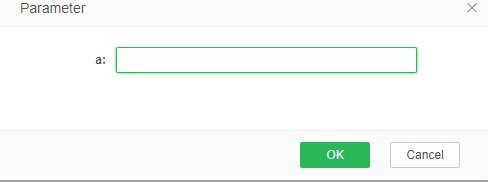
[Eject] When this item is checked, when the user clicks the refresh parameter button or opens the dashboard again in the editor, the parameter value input dialog box will pop up as shown in the figure below. There is a set default value in this dialog box.
[Participate in the "Parameter Filtering" filtering policy] This option is only available for custom parameters. After checking the filter policy of “Parameter Filter” in the report, the customized parameters will be controlled by the unselected value strategy of the parameter in the dashboard. Custom parameters are optional by default.
[Mandatory] After checking the [Filtering policy for "Parameter filtering" in the report], you must select it. After selection, the parameter must be entered in the report, otherwise the dashboard data is empty.
[Optional value] The user can select a data set in the existing data set, select one data segment as the label, and one data segment as the value. If the parameter does not check “popup”, the corresponding value of this dataset is directly passed to this parameter. If the parameter is marked as “popup”, the data will be displayed in the specified manner when the parameter value input dialog box pops up. This product provides four display modes, select list, list, check box, and check box.
Assume that the user sets the parameter value input box in the form of a selection box. When the user clicks the refresh parameter button and opens the dashboard again in the editor, the default data set value is displayed in the parameter value input dialog box, as shown in the following figure. .

[Refresh Parameter] Re-enter the parameter value for the parameter with the pop-up status set. If there is a parameter a, it is in the popup state, and there is a default value of 12, as shown in the figure below.
When the user clicks the refresh parameter button, the default value of this parameter will also be brushed out, as shown in the following figure.
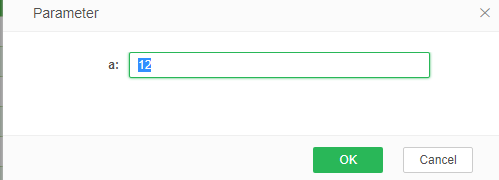
When the user clicks the refresh parameter button, the default value of this parameter will also be brushed out, as shown in the following figure.
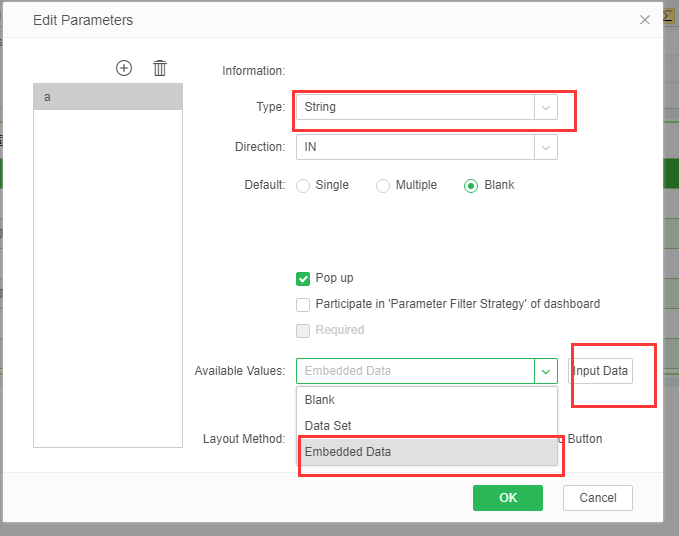
In the Edit Parameters dialog box:
[Type] Users can set the data type of the current parameter.
[Optional value] Select the embedded data in the selectable value, and the right button will display the input data. Click the input data to enter the input data dialog box. as the picture shows:
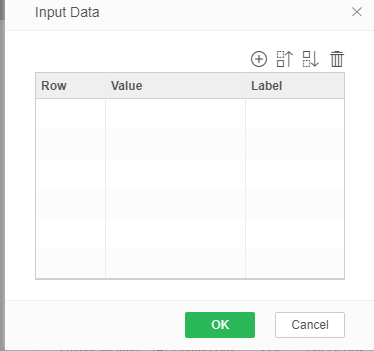
[Add] Click the "Add" button on the right, and enter the data in the Value and Tab fields.
[Delete] Select the data line and click the “Delete” button to delete the input data.
[Up/Down] Select the data line and click Move Up or Move Down to change the position of the data.
[OK] Click "OK" to confirm the entered data.
[Cancel] Cancels the entry of data.
[Application] The input data application is displayed on the component.
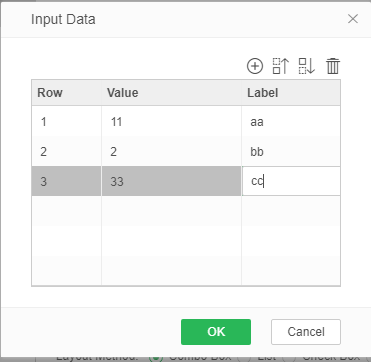
Enter data in the dialog box, where the value is not allowed to be empty and the label is allowed to be empty as shown in the figure:
Suppose the user sets the parameter value input box in the form of a list. When the user clicks the refresh parameter button and opens the dashboard again in the production report, the entered data is displayed in the parameter value input dialog box, as shown in the following figure:
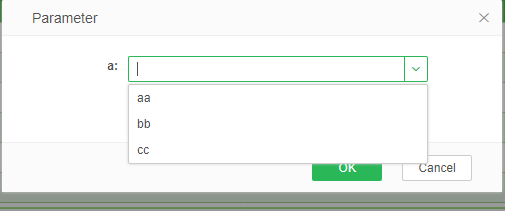
If a tag is entered, the tag is displayed; if no tag is entered, the value is displayed.
[Inline Parameters] In order to meet the various needs of users, the product provides some embedded parameters for users to use, as detailed in the following table:
Parameter Name |
Parameter Type |
Description |
|---|---|---|
_REFRESH_ |
Boolean |
Set whether the dashboard acquires real-time data. The default value is "false" and is not obtained in real time. When set to true, get real-time data. |
_M_REFRESH_ |
Boolean |
Set whether the dashboard acquires market data. The default value is "false", and the market data is obtained. When set to "True", data is not obtained from the market. |
_EXCEL_EXPORT_TYPE_ |
Integer |
Set whether the dashboard acquires market data. The default value is "false", and the market data is obtained. When set to "True", data is not obtained from the market.... |
_EXCEL_EXPORT_SHEETNAME_ |
String |
Set the name of the Dashboard's Sheet page when exporting Excel |
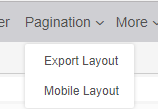
[Page Setup] When the page setup button is clicked, a drop-down box will be displayed, and the output layout will be selected. The toolbar will pop up, as shown in the figure below. The user can adjust the position of the components in the current dashboard and set the pages of the exported file. In page setup mode, the user can move components and adjust the size of the components.

![]() When this button is clicked, a right-click dialog box appears as shown in the figure below.
When this button is clicked, a right-click dialog box appears as shown in the figure below.

[Recipient] is empty by default. You can enter the email address. When the user in the system configures the mailbox information, you can also add recipients by using the Add button on the right side of the input box to open the Select Addresses dialog box. Users, groups, and roles can be directly added to the recipient list as added items. The corresponding user name, group name, and role name are displayed here. At the same time, the mailbox can only be sent to the mailbox of a certain domain. By configuring the domain in the bi.properties: local.mail.domin, such as when local.mail.domin = yonghongtech.com, the mailbox 12345@qq.com is not valid. To the mail, copy the same recipient.
[Executive Report with Recipient Privilege] By checking this attribute, users in the system can only receive their own information. If the recipient is not in the user of Yonghong System, the information received by the report performer is received.
[Cc] You can enter the recipient's email address. You can also add a copy person by using the Add button on the right side of the input box. When a user is selected, the user name is displayed here.
[Sender] The user enters his/her mailbox in bi.properties. The specific method for setting the mailbox in bi.properties is described in the "System Properties Configuration" section.
【Subject】Enter the subject of the email.
[File Type] Set the format of the export file, including PDF and Excel formats.
[message] Default configuration format "This message is from: ? {_USER_}", users can also enter other message content.
Description: Support parameters for topics, messages, and file names: ?{_TO_USER_},?{_THIS_YEAR_}, ?{_THIS_MONTH_}, ?{_THIS_DAY_}, {_THIS_FULL_DAY_}. {_TO_USER_} displays the username; ?{_THIS_YEAR_}, ?{_THIS_MONTH_}, ?{_THIS_DAY_}, {_THIS_FULL_DAY_} displays the current time.
![]() Export button, click this button to choose to export the current dashboard in PDF, Excel, Word, PNG or CSV format according to the set page.
Export button, click this button to choose to export the current dashboard in PDF, Excel, Word, PNG or CSV format according to the set page.
![]() Page layout, click this button to pop up the page layout dialog box, as shown below.
Page layout, click this button to pop up the page layout dialog box, as shown below.
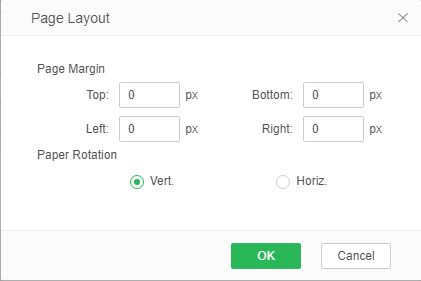
[Margin] Users can set the margin of the exported PDF file. Note that the sum of the top and bottom margins cannot exceed half the height, and the sum of the right and left margins cannot exceed half the width.
[Paper Orientation] When the user switches from portrait to landscape, the right margin becomes the top margin, the left margin becomes the bottom margin, the top margin becomes the left margin, and the bottom margin becomes the right margin, means the page rotates counterclockwise 90 degrees.
[matching layout] default "checked". When checked, all component data will not be expanded. Unchecking “Check” will expand according to the data. For example, a table with a scroll bar will display all the data.
[Adaptive Size] Default "Checked". When the adaptive size is not checked, the user can select the type of paper, or customize the width and height of the paper. When the adaptive size is checked, the output PDF page will automatically resize, and the paper type, width and height are all inactive and cannot be modified. As shown below:

【More】
1. Viewer settings
Settings
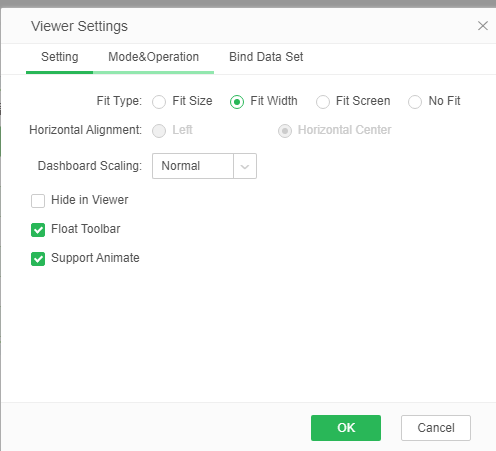
[Adaptive Type] Sets whether the page of the dashboard adapts to the screen size in viewing reports. By default, Wide adaptive is selected.
Equal-scale adaptive: The entire dashboard adapts to the screen display based on horizontal and vertical orientations, with no scroll bars in landscape and portrait orientation, and does not necessarily fill the entire screen.
Widely adaptive: The dashboard page only accommodates wide, horizontal scroll bars do not appear. When wide adaptive, horizontal alignment is not supported.
Not adaptive: Displays according to the original size of the dashboard.
Full-screen self-adaptation: The pages of the dashboard adapt to width and height so that the content of the report is displayed in full screen according to the browser or screen ratio. When the screen is fully adaptive, horizontal mode alignment is not supported.
[Horizontal Alignment] When viewing the report to open this dashboard, the page is displayed left or center, and ‘Centered’ is selected by default.
[Report Scaling] After setting the zoom ratio of the dashboard, the current dashboard content in the viewing report will be scaled by the corresponding multiple. The proportions that can be set: standard, 2x, 3x, and user-defined multiples. “Standard” is the default option, ie it is not zoomed and the original scale is maintained. Report scaling can only be set to a multiple of greater than 1.
[Hide in view report] By default, it is not checked. If you hide the check box in the view report, the current dashboard is hidden in the view report.
[Floating toolbar] is suspended by default. When viewing DB, the toolbar will be suspended. If you uncheck it, the toolbar is fixed.
[Animation] Supports animation effects in charts, including five animation effects: growth effects, vertical expansion from the center of the graph, shallow to deep points, diffusion from the center to the periphery, and rotation and expansion from the center. Animation'.
Mode & operation
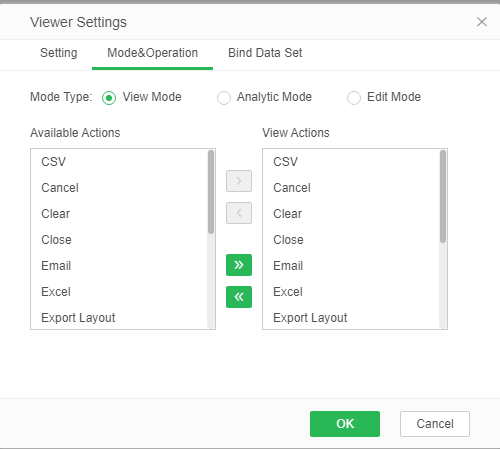
[Mode Type] is divided into viewing, analysis, and edit modes of operation and does not conflict with each other.
[Configurable operation] drag and drop, add, delete buttons, etc. to achieve the configuration and deletion of DB operations
Specify the data set
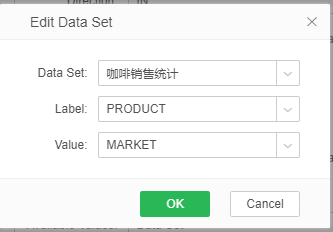
[Specify Data Set] Specify a data set for the current dashboard. When you enter the view report in edit mode, you create a new component and enter bound mode. The component can only bind to the data set specified by the current dashboard. The specified data set dialog box displays only the existing data set. The interface is as shown below:
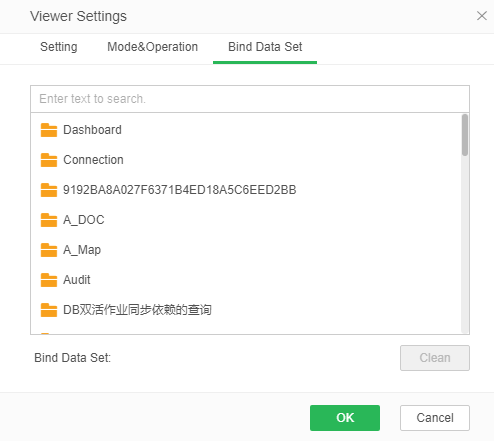
➢E.g:
1.Create a new dashboard, specify a data set “Coffee Sales Statistics” and save it as “Test”.
2.Enter the view report in edit mode, open “Test”, create a new form component, and enter binding mode. The form can only be bound to the specified data set. As shown below:
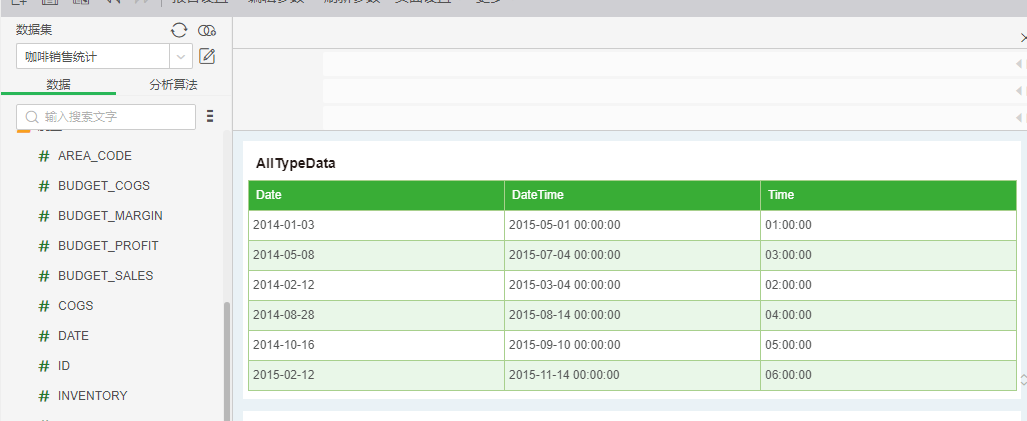
2. Script

[Script] The user can control the entire dashboard through a script, for example, to periodically refresh the dashboard through a script. The overall control of each component can also be achieved through the dashboard script. Dashboard scripts are divided into scripts that run when loaded and scripts that run when they are changed. The execution conditions of the two types of scripts are different. The scripts that are run when loading are run when the dashboard is opened, and the scripts that are run when the changes are in the component. Run when there is a change. For a detailed description of the Dashboard script, please refer to the “Dashboard Script” chapter in “The Everlasting Scripts Manual”.
3. Dashboard style
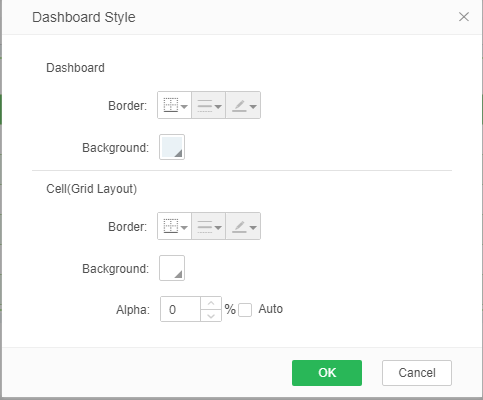
[Report border] can set the DB's border style, line style and line color
[Report Background] You can set the background color of the DB. You can also add a gradient effect or set the background of the image.Note:Yonghong X-Suite, Y-Reporting does not support dynamic background.
[plaid] Smart layout can be edited. You can set the border style, line style, and line color of the grid
[Grid Background] You can set the background color of the grid, you can also add a gradient effect or set the background of the picture
[Grid background] can set the transparency of the entire grid area
4. Dashboard theme
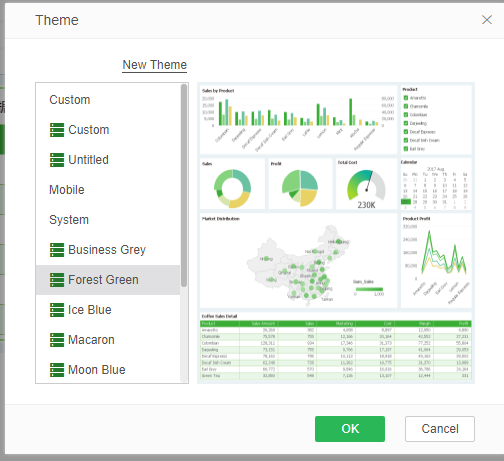
[Left list] shows user-defined topics and the ten topics that the system brings. After selecting, click OK to switch topics
[Right Preview Area] After clicking the topic of the left list, the preview area on the right shows the preview effect of the theme.
【New theme】Click to enter the dashboard theme module, not repeat here
5. Replace the data set
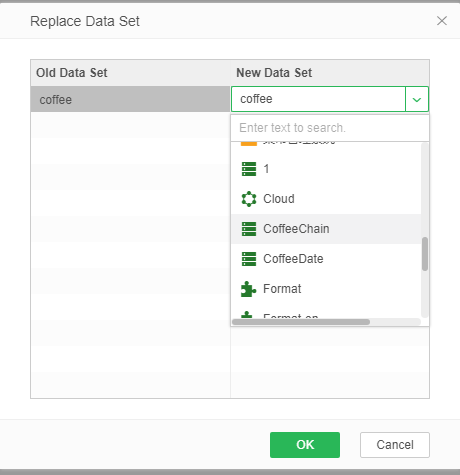
[Replace datasets] When you create a report, you can directly switch between different data sources. If the fields used in the report are the same as the new data source, the data will be switched seamlessly instead of through tasks and programs. In the Replace Data Sets interface, change the data set by selecting a new data set, as shown in the following figure:
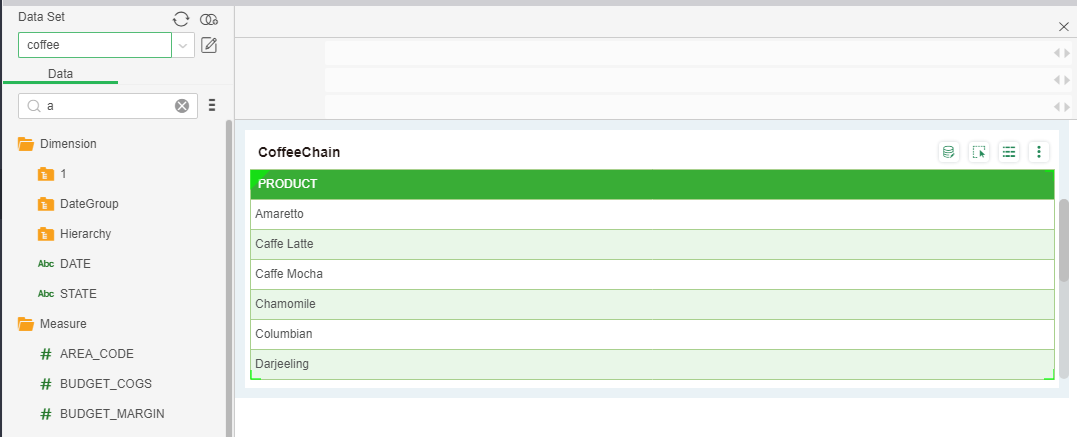
If there is the same field in the new data set as the original data set, the original field is directly replaced, as shown in the following figure:
Before replacement:
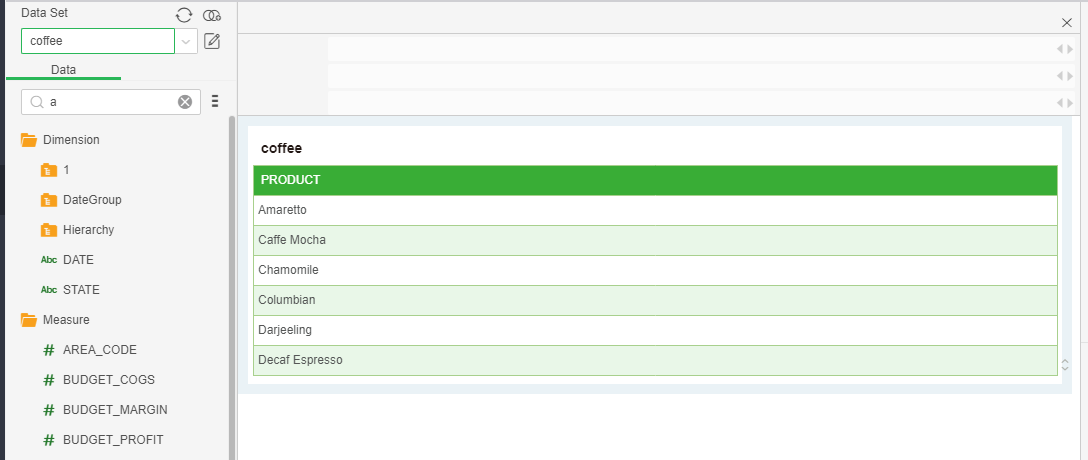
After replacement
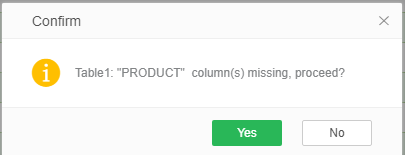
If the new data set does not have the same fields as the original data set, the data column does not exist, as shown in the following figure:
6. Sharing filtering
[Sharing filtering] Different parameters in the production report When the input components have the same filtering parameters, the filtering parameters can affect different dashboards in the user customization at the same time through sharing filtering; when there are different filtering components in the production report, they are shared through Filtering, the selection of filter components can affect different dashboards in the user customization.
7. Metadata model
[Metadata Mode] After clicking this item, all the components in the dashboard will enter its metadata mode.
Suppose there is data in the table below.

The metadata schema corresponding to each data type in the above table is shown in the following table.

The metadata schema corresponding to each data type in the above table is shown in the following table.
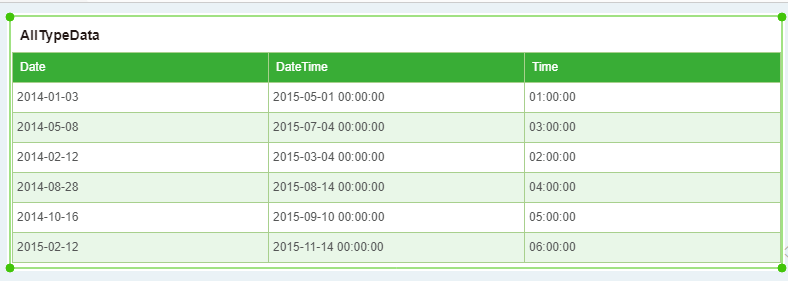
The metadata mode corresponding to each data type in the above table is shown in the following table, and the current time is collected.

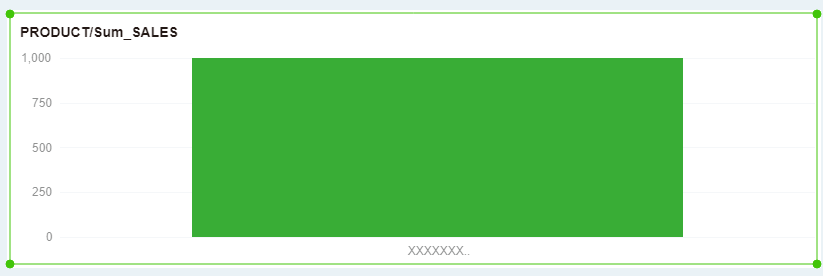
If the graph's Row axis is bound to numeric data, it is displayed in the metadata mode as 0-1000, as shown in the following figure.
Initial data:

Metadata mode:
8. Form parameter
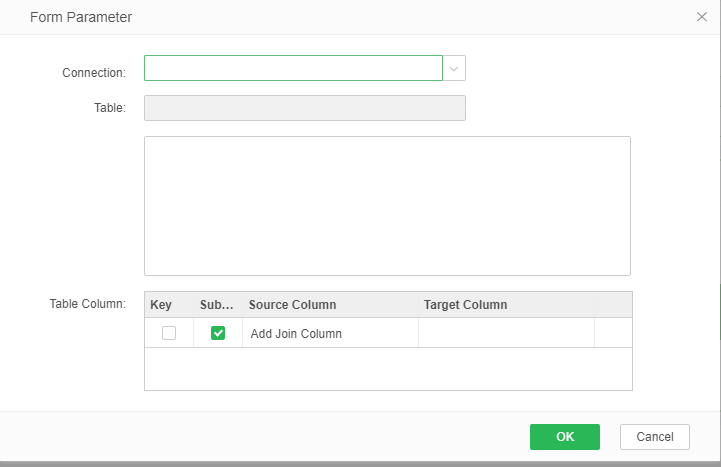
The fill-in parameter is used to submit data to the database table in the DB. The specific fields are as follows:
[Data Source] The data source that the user wants to fill in. The drop-down list can select various data sources added in the product.
[Select target table] You can select a data table in the list to fill in the database
[Field] Set the field that the user needs to submit and the target field to fill in
[Cancel] When a certain operation does not respond for a long time, it will pop up Cancel & loading. Click this button to cancel the current operation. As shown below

[Preview] Preview the current dashboard in the new dashboard. Preview mode does not support saving the preview dashboard.
[Close] Closes the current dashboard. If the user has not saved the changes to the current dashboard, a dialog box will pop up.