|
<< Click to Display Table of Contents >> How to Drill Through Data |
  
|
|
<< Click to Display Table of Contents >> How to Drill Through Data |
  
|
Drilling down means that the data of a specific group is further subdivided and displayed according to the second dimension. The rolling up is the reverse process of drilling down, that is, putting away detailed data and displaying the upper-level summary data. Take the time level as an example to show you how to implement the roll-up and drill-down in the time dimension.
1.Set Data Hierarchy
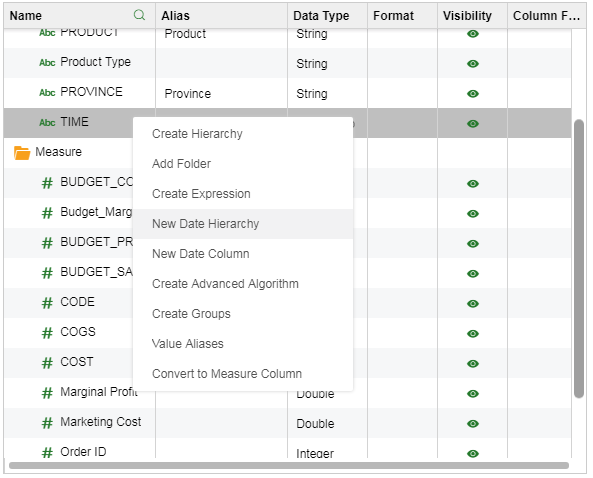
1)In the metadata area, select [New Date Hierarchy] in the More menu;

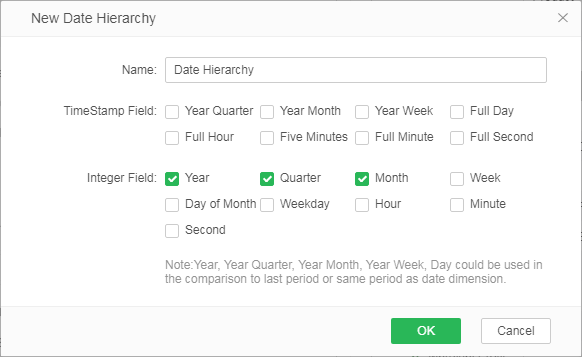
2)Check the format of the date hierarchies that need to be created, such as “Year,” “Quarter,” “Month,” and click [OK].

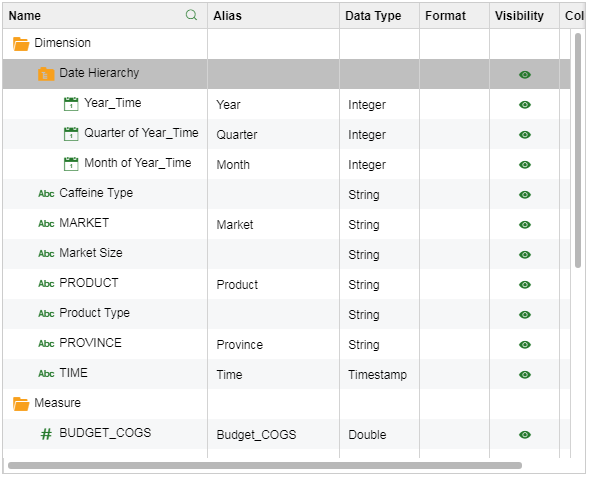
3)The Metadata Area generates a "Date Hierarchy" folder, which stores the established layers.

➢Note: The order of the data segments in the hierarchy folder determines the level relationship among the data segments. The default is the top data segment with the higher levle.
2.Drill Through Data:
1)From the right Component pane, drag the table component ![]() to the editing area.
to the editing area.
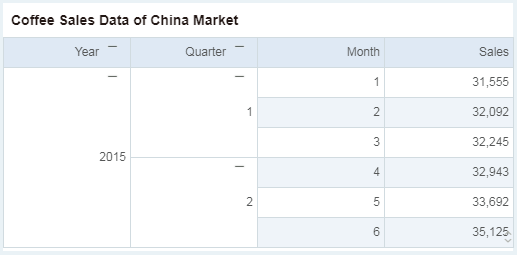
2)In the list of data on the left, drag the dimension “Year" in the Date Hierarchy folder and the measure “Sales” to the binding area. Finally get the following table.

3)Click [+] in the binding area or table area to drill down to view the next level of detailed data; click [-] to scroll up and view the summary data at the higher level.