|
<< Click to Display Table of Contents >> Correlation |
  
|
|
<< Click to Display Table of Contents >> Correlation |
  
|
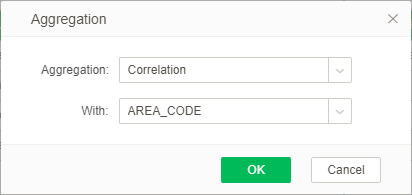
Users can select measure-more in the pull-down menu in the binding panel, open the aggregation dialog, and select the correlation in the aggregation mode. As shown in the following figure, when the correlation is selected, “With” will become optional. That is, the relevant column to be selected. This option is mandatory. The measure column of all numeric types of the currently bound query of the component will be loaded, and similar descriptions will not be repeated here.

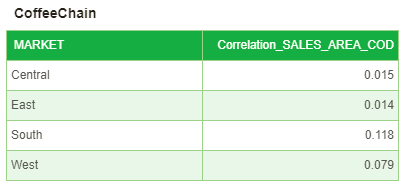
For example, bind 2 columns "MARKET" and "SALES" to the table component, set the aggregation mode of column "SALES" as the correlation coefficient, and select the column "AREA_CODE" as the second column "With". The result is shown in the following figure.
