|
<< Click to Display Table of Contents >> Set Heat Effect |
  
|
|
<< Click to Display Table of Contents >> Set Heat Effect |
  
|
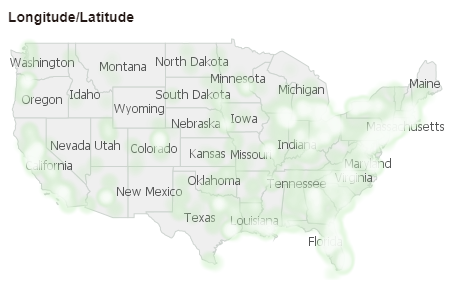
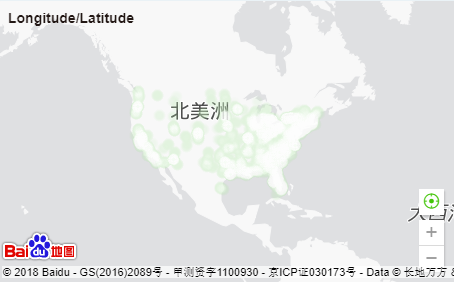
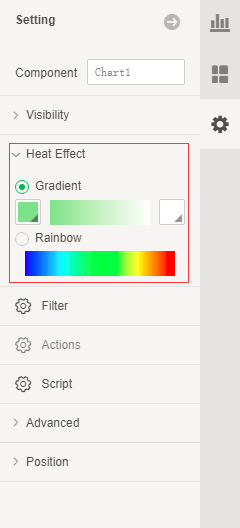
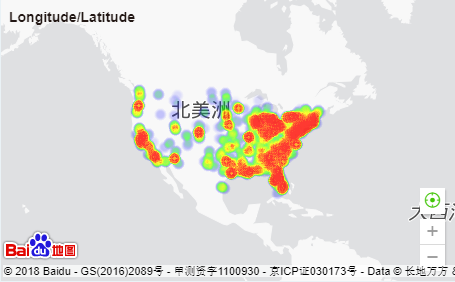
The product provides two kinds of heat effect display forms for heat maps: rainbow heat display and custom gradient heat display. Select the heat map and open the pull-down menu of the heat effect in the right panel - Setting. Users can set the desired heat display effect according to their own needs.
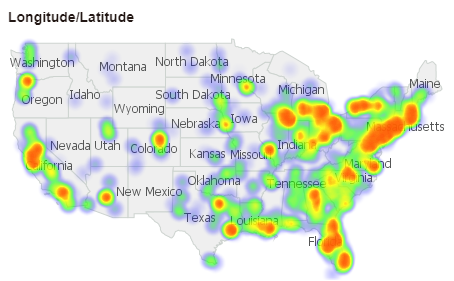
Rainbow Heat Effect Show:
Custom gradient heat display (set the color gradient from green to blue):
