|
<< Click to Display Table of Contents >> Dynamic Calculator |
  
|
|
<< Click to Display Table of Contents >> Dynamic Calculator |
  
|
Dynamic calculator is unique to table, pivot, freestyletable and chart component. It is to calculate the numerical changes between grids. For example, calculate the year-on-year, month-on-month, annual percentage, total percentage, etc. Such calculator can only be kept in a single component and cannot be reused by other components.
Dynamic calculator refers that the value of each grid is calculated dynamically. It is also known as grid-to-grid calculation. It is mainly to calculate the value dynamically along specific direction in the table. There are two factors, namely calculation direction and calculation method (or function).
The calculation direction is related to table structure. To calculate the month-on-month of product quarterly increment, grouping of product fields and quarterly fields is required. Calculate along the quarterly fields. We call grouping as Partition. The direction is known as Addressing.
The calculation functions include difference, percentage, difference percentage, percent of total, running total, moving calculation, ranking calculation, and percentile calculation. Each calculation function has some special attributes and parameters.
The interface provides some built-in calculation functions and calculation directions. And the user can customize the calculation function and calculation direction as required. For custom calculation functions, quadratic calculated attributes can be used. Namely, current dynamic calculation can use the results of other dynamic calculations for quadratic calculation.
❖Add dynamic calculator
1.Select the "Add Dynamic Calculator" from the pull-down list of the binding measure data. Select the calculator to be added from the expanded sublist: Difference From, Percent From, Percentage Difference, Percent of Total, Running Total, Moving Calculation, and Rank Calculation. After adding, it can be edited from the pull-down list of data field.
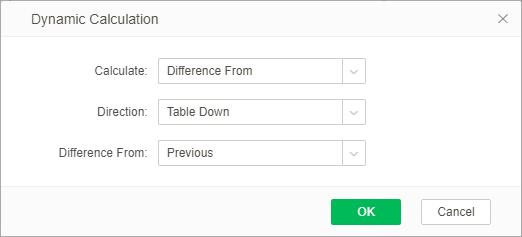
2.Click "Add Dynamic Calculator" from the pull-down list of the binding measure data, The dynamic calculator dialog will pop up. There are three options, "calculate", "direction" and "difference from", are in the dialog . Among them, the contents of "direction" in different components are different.
❖Partition and Addressing
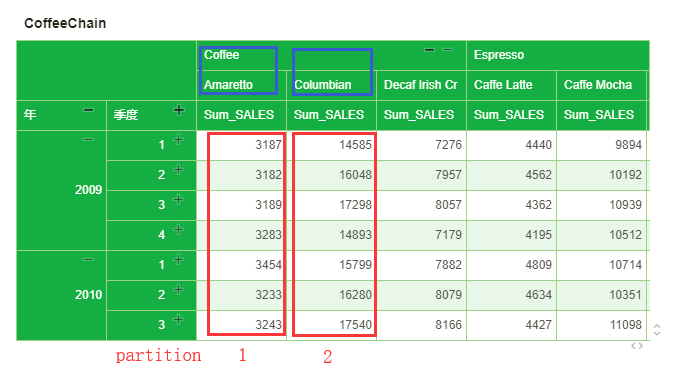
Grouping refers to data grouping in components. Direction determines the order of dynamic calculation. For example, the data in table I are as shown in the figure below.
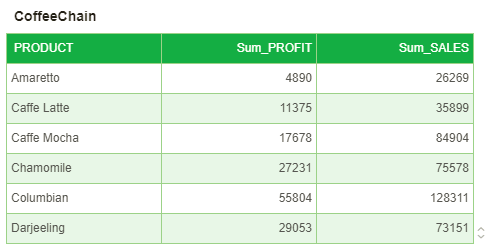
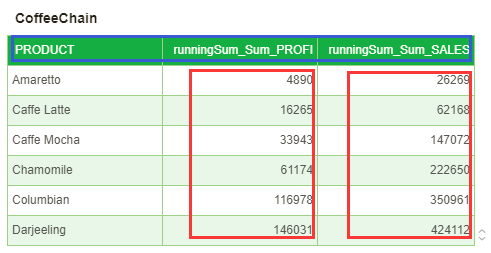
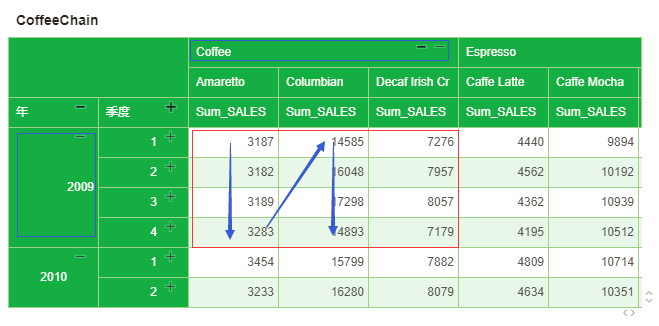
Grouping the tables by column. The calculation direction is vertical. The calculation function is cumulative statistics, namely cumulative sum. The results are as shown in the table below. Group according to the fields in the blue box. The data in the red box indicates calculating direction.
The user-defined calculation directions include table across, table down, table across then down, table down then across, pane across, pane down, pane across then down,pane down then across, cell and advanced.
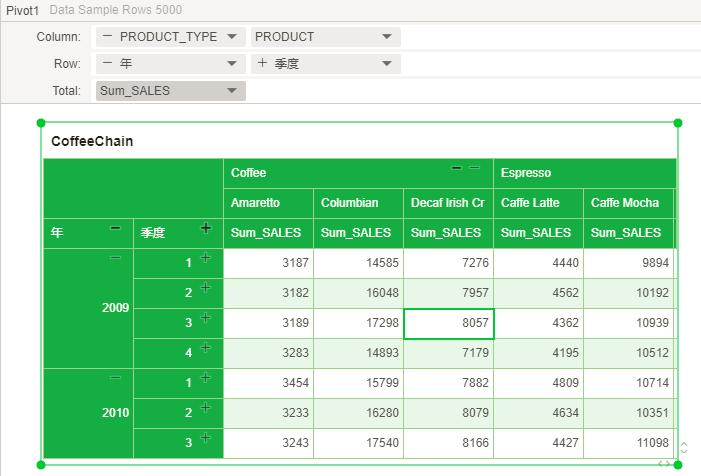
Assume that the row header of a pivot is bound to the "年" and "季度". The column header is bound to the "PRODUCT_TYPE" and the "PRODUCT" field, and the summary row binding "SALES" field, as shown in the following figure. This pivot will be used more than once in the following.
•Table across
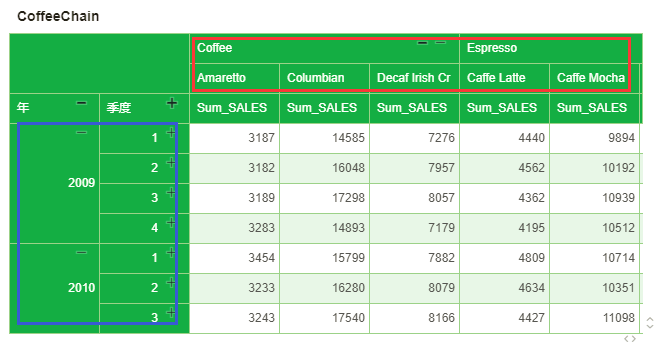
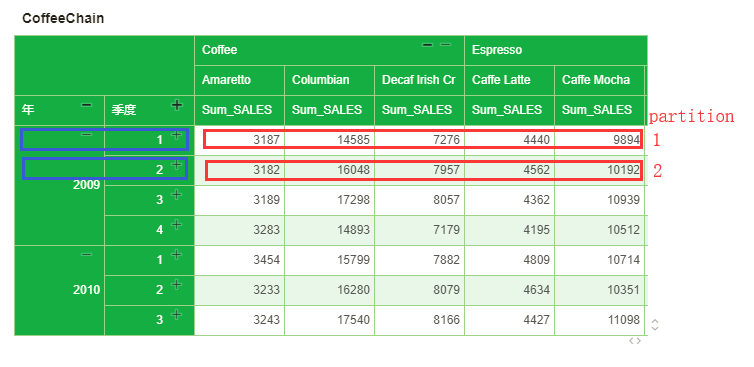
Calculate horizontally within each group. As shown in the figure below, sales of quarterly products, when the Addressing selection form is horizontal, The column "季度" and "年" are Partition, and the "PRODUCT_TYPE" and "PRODUCT" is Addressing.
The partition situation is as shown in the figure below:
•Table down
Calculate along vertical direction within each group. The figure below shows quarterly product sales state. When Addressing selects Down, "PRODUCT" and "PRODUCT_TYPE" are Partition. "年" and "季度" data are Addressing.
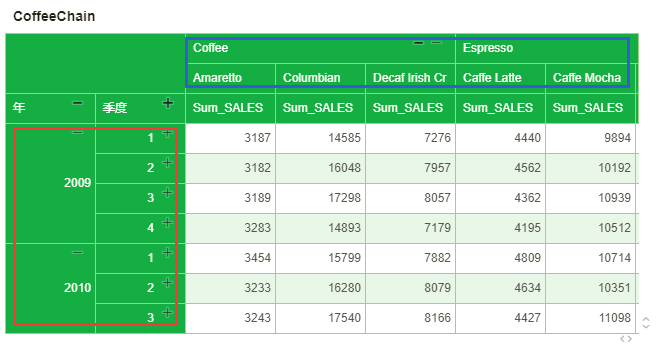
The partition situation is as shown in the figure below:
•Table across then down
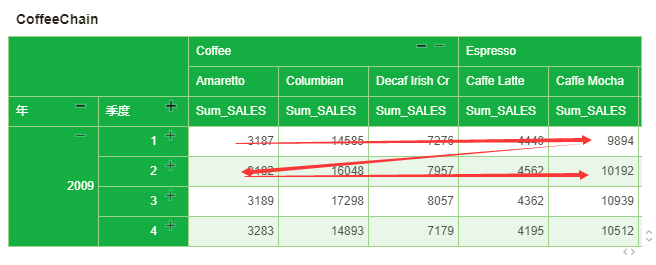
Calculate along across direction and then down direction within each group. The figure below shows quarterly product sales state. When Addressing selects Across then Down, all fields are Partition and Addressing as well.
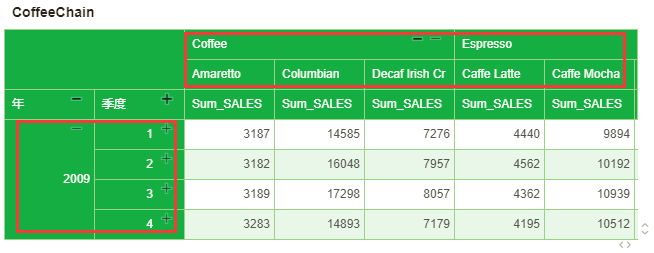
All fields are used for grouping. The calculation method is table across and then calculate to the next row. Continue the calculation along table across.
•Table down then across
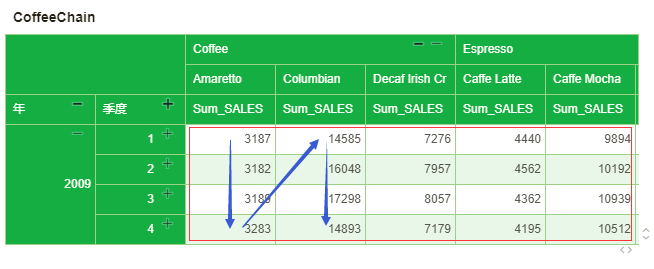
Calculate along across direction and then down direction within each group. The figure below shows quarterly product sales state. When Addressing selects down then across, all fields are Partition and Addressing as well.

All fields are used for grouping. The calculation method is table down and then calculate to the next column. Continue the calculation along table down.
•Pane across
Calculate along across direction within each pane. Note that pane is determined by the bound next-to-last dimension field.
The figure below shows the sales of product quarterly. When Addressing adopts Pane across, "季度" and "年" data are Partition."PRODUCT" is Addressing.
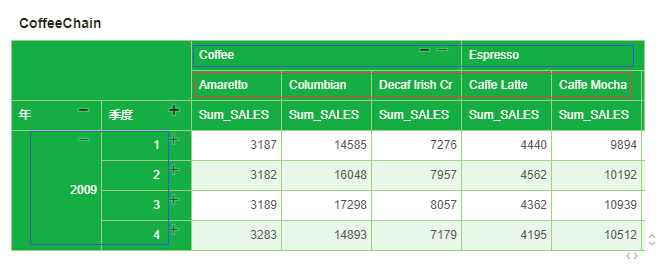
The partition situation is as shown in the figure below:
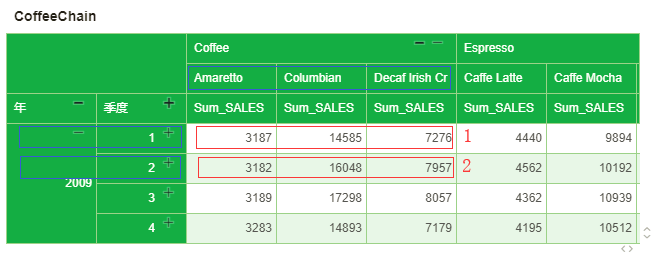
•Pane down
Calculate along vertical direction within each group. The figure below shows the sales of product quarterly. When Addressing adopts Pane Down, yearly, product category, and product data are Partition. Quarterly is Addressing.

The partition situation is as shown in the figure below:

•Pane across then down
Calculate along across direction and then down direction within each group. The figure below shows the sales of product quarterly. When Addressing adopts Pane across then down, “年” and "PRODUCT_TYPE" are Partition. "季度" and "PRODUCT" are Addressing.
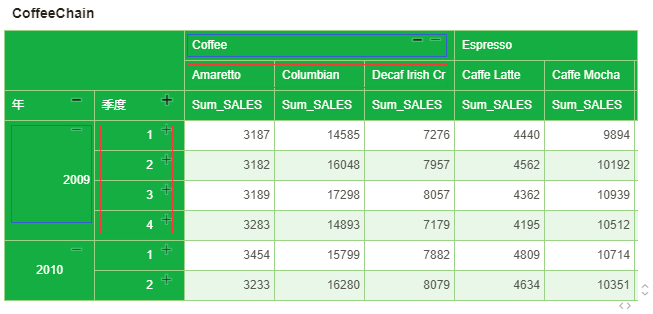
The partition situation is as shown in the figure below,The calculation is Pane across and then to the next row. And then continue calculation along the pane.
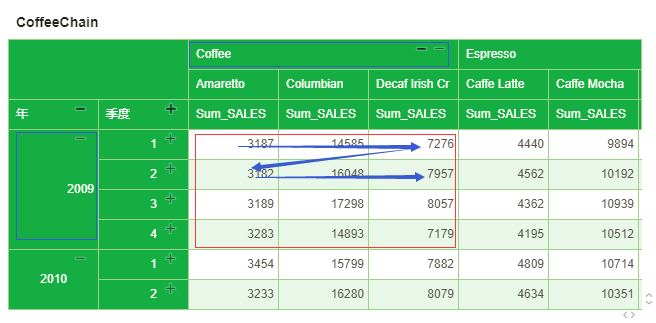
•Pane down then across
Calculate along across direction and then down direction within each group. The figure below shows the sales of product quarterly. When Addressing adopts Pane across then down, "年" and "PRODUCT_TYPE" are Partition. "季度" and "PRODUCT" are Addressing.

The partition situation is as shown in the figure below,The calculation is Pane down and then to the next column. And then continue calculation along the pane.
•Cell
Calculate based on each cell. At this point, all the fields are Partition. This is especially useful when calculating the percentage of the total.
•Advanced
When the user clicks the advanced option, custom pile dialog will pop up as shown in the figure below.
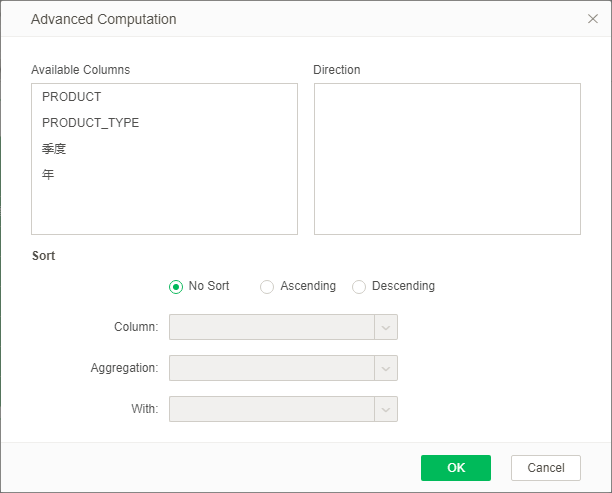
[Available Columns] Available column lists all dimension fields bound to current component, including dimension fields binding to the beautifying interface of chart.
[Direction] The user can set the calculation basis through dragging the mouse for grouping calculation of a certain data field
➢For Example: There is a diagram as shown below.
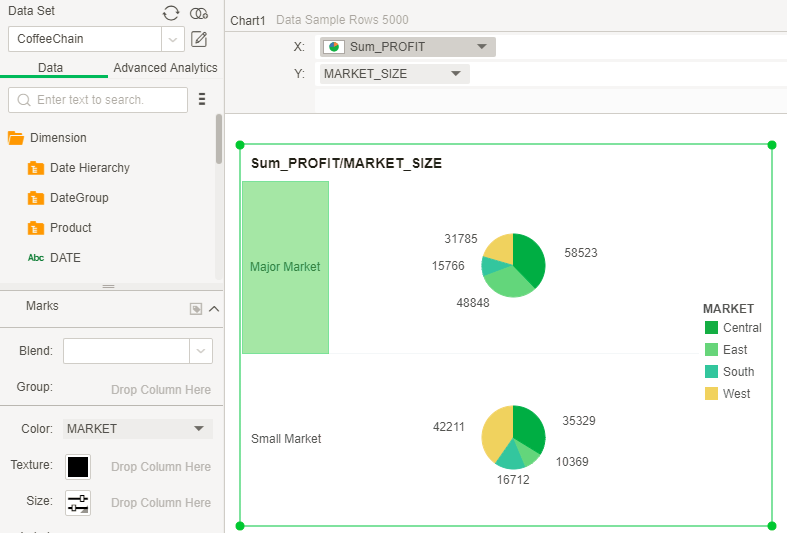
The user needs to calculate the profit proportion of each Market in Small Market and Major Market respectively.
The user needs to add the dynamic calculator option in the Sum_PROFIT drop-down list. Select percent of total as calculation item, Advanced as direction and aggregation as Sum function.

After select direction as advance, the custom pile dialog will pop up. The user needs to drag the MARKET field into the available columns list, and carry out grouping calculation according to the MARKET.

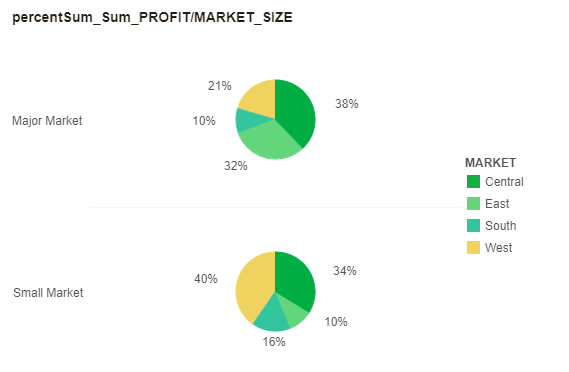
Click the OK button, select the chart, remove the hidden value tag from the Mark&Label on the right panel, and display the tag value. The result is shown in the following figure:
The user can also set the sorting of custom pile. If there is a as pivot, it will be shown in the figure below.
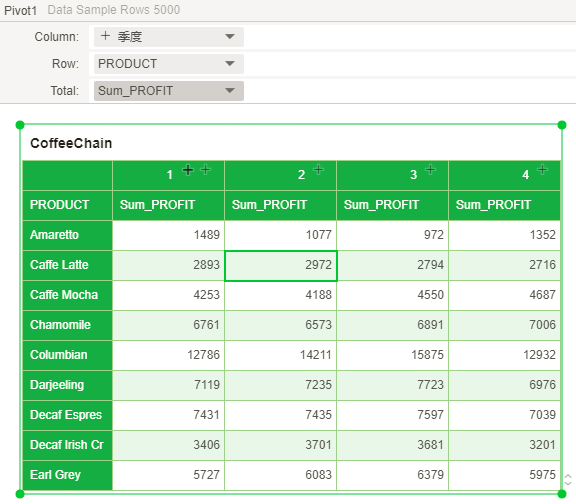
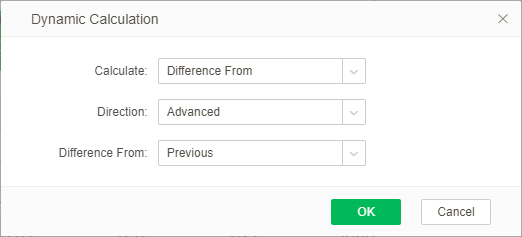
Select the Add Dynamic Calculator in the drop-down list of the "Sum_PROFIT" field. In the pop-up dynamic calculation dialog, calculate the selected difference from, direction the selected advanced, and select the previous difference, as shown in the following figure.
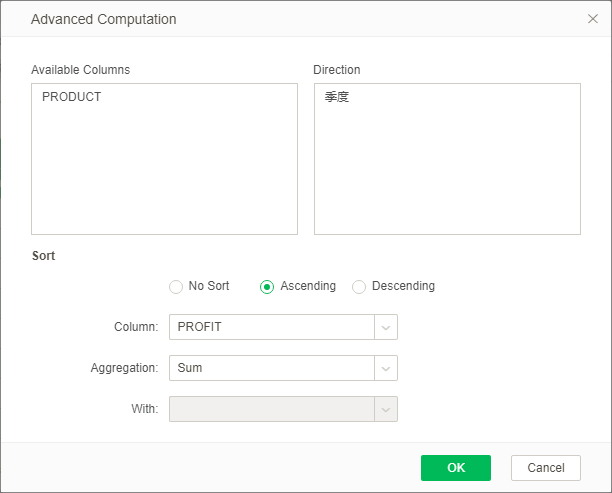
After the direction selection is advanced, a custom dialog is displayed. The user needs to drag the “季度” field to the direction list, that is, to perform grouping calculation according to the "季度".
Column select PROFIT, ascending order, sum of aggregation options.
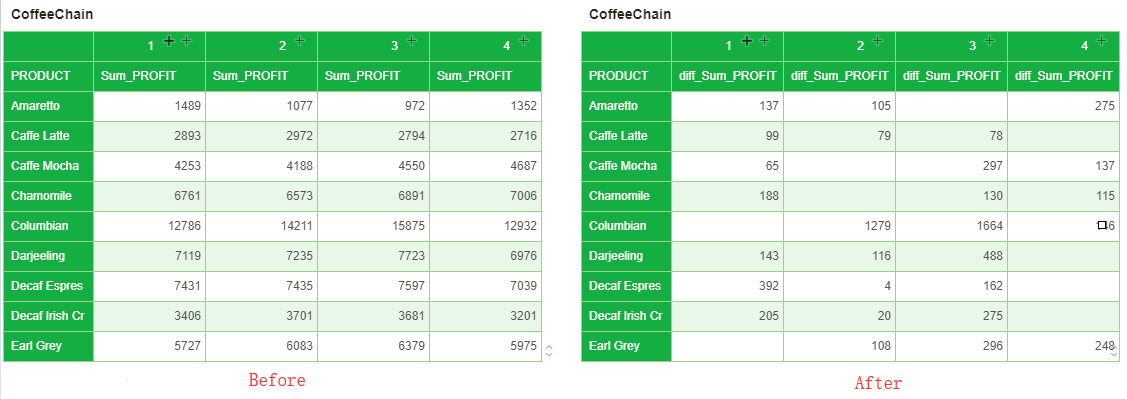
The status before and after the calculation is as shown in the figure below: The sorting sequence of the profits of the Amaretto of four quarters is as follows: quarter 3, quarter 2, quarter 4 and quarter 1. Since dynamic calculation is subject to ascending order calculation based on Sum_PROFIT, the dynamic calculation result in quarter 3 is null, that of quarter 2 is 1077.0-972.0=105.0, that of quarter 4 is 1352.0-1077.0=275.0, and that of quarter 1 is 1489.0-1352.0=137.0.
