|
<< Click to Display Table of Contents >> Configuration of Dashboard View |
  
|
|
<< Click to Display Table of Contents >> Configuration of Dashboard View |
  
|
❖View Type
For viewing report views, we provide two modes of tree display and icon display. It can be selected in the [Personal Center]-> [Preference]->[View Type], and the default is icon display.

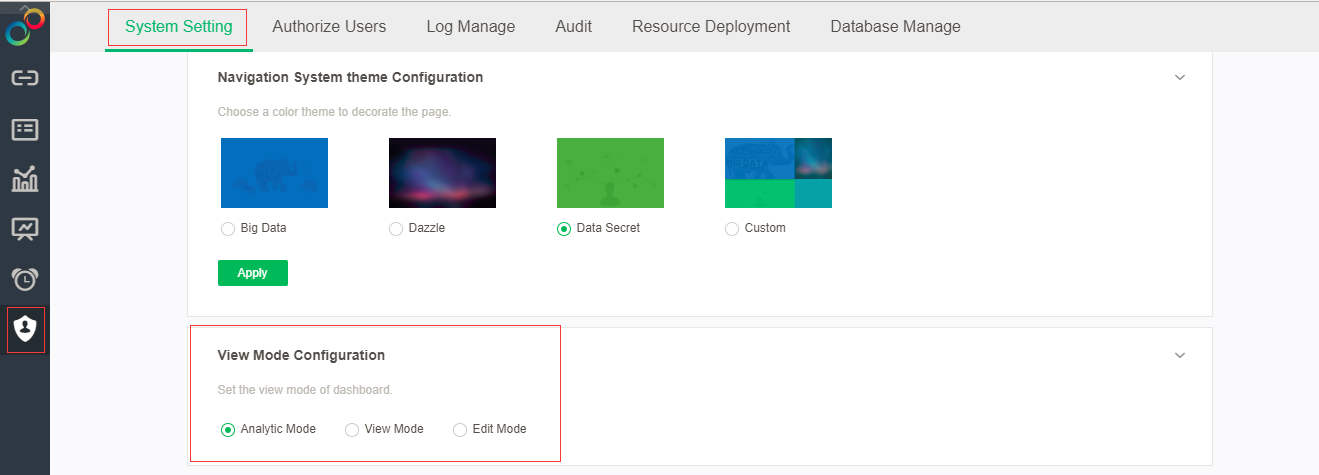
❖View Mode Configuration
Click on [Manage System]-[System Setting]-[View Mode Configuration].
It is used to configure different operations that users can do on reports, and the default is "view mode".
•View mode: users can only view when viewing reports.
•Analytic mode: users can use some functions of components when viewing reports.
•Edit mode: users can edit reports when viewing reports.
❖Fit type
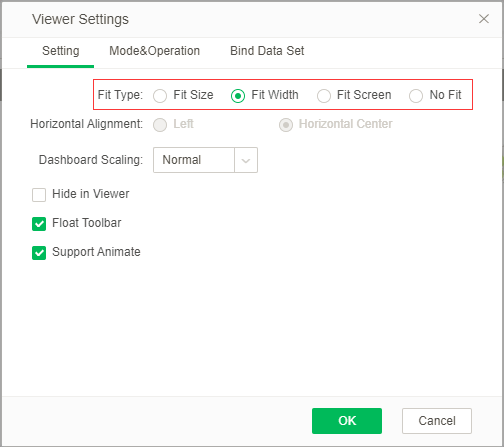
Set the page of the dashboard in the view report, whether it adaptable to screen size, and select "Fit Width" by default.
•Fit Size: the entire dashboard adapts to the screen according to the long direction in the transverse and longitudinal direction, and there is no scroll bar in the transverse and longitudinal direction, and it does not necessarily fill the whole screen.
•Fit Width: the page of the dashboard is only wide and no transverse scrollbar will appear. Wide adaptation does not support horizontal alignment.
•No Fit: according to the original size of the dashboard.
•Fit Screen : the page width of the dashboard is wide and high, so that the content of the report is displayed in full screen according to browser or screen proportion. Horizontal screen alignment is not supported when full screen is adaptive.
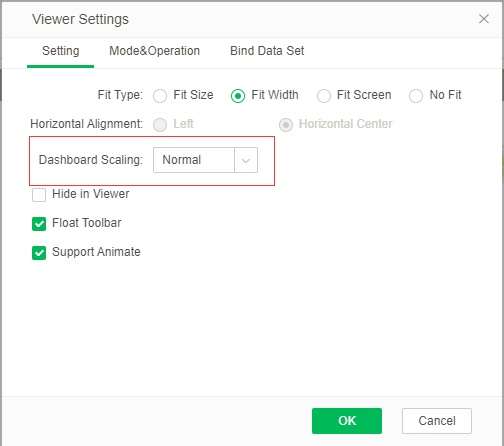
❖Dashboard Scaling
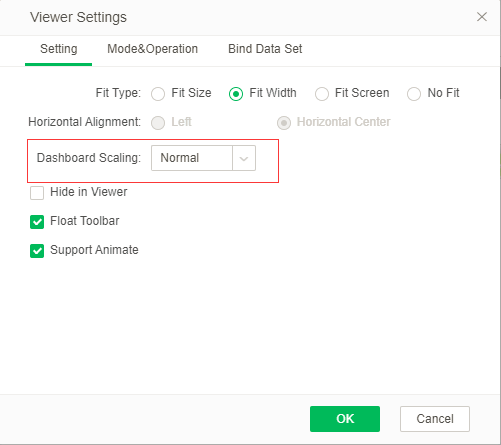
After setting the zoom ratio of the dashboard, the contents of the current instrument panel will zoom in at the corresponding multiple. The ratio can be set up: normal, 2 times, 3 times, and user defined multiple. "Normal" is the default option, that is, no scaling, keeping the original proportion. The scaling ratio of the report can only be set more than 1.
❖Horizontal alignment
Open the dashboard when you view the reports, display or center pages on the left, selected by default "Horizontal center".
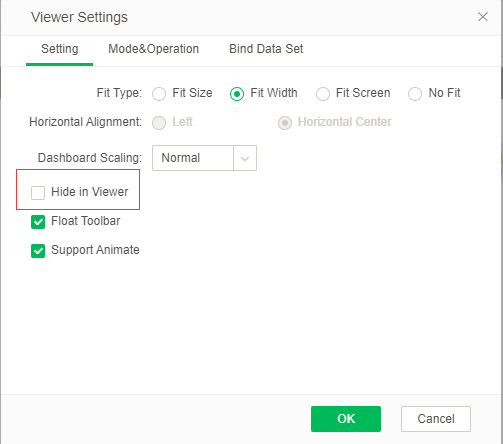
❖Hide in viewer
Hidden checks in view reports indicate that the dashboard is hidden in the view report.
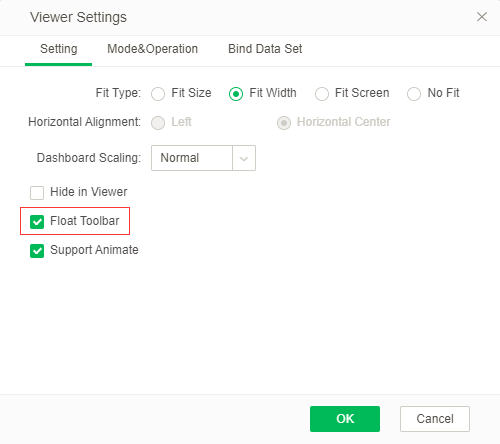
❖Float Toolbar
The suspension toolbar check indicates that the toolbar is suspended in the viewing report, and the suspension toolbar is selected by default.
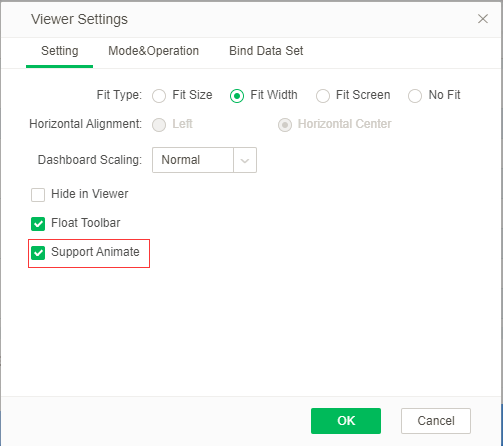
❖Support Animate
Graphic animation is selected to represent the animation effect in the representation chart, including five kinds of animation effects: growth effects, longitudinal expansion from the center of the chart, light to deep point, spread from the center to round and round and from the center, by default select 'support animate'.
