|
<< Click to Display Table of Contents >> Add Data |
  
|
|
<< Click to Display Table of Contents >> Add Data |
  
|
Before creating a Advanced Analytics experiment, you first need to add data to the experiment so that you can use this data to train the model.
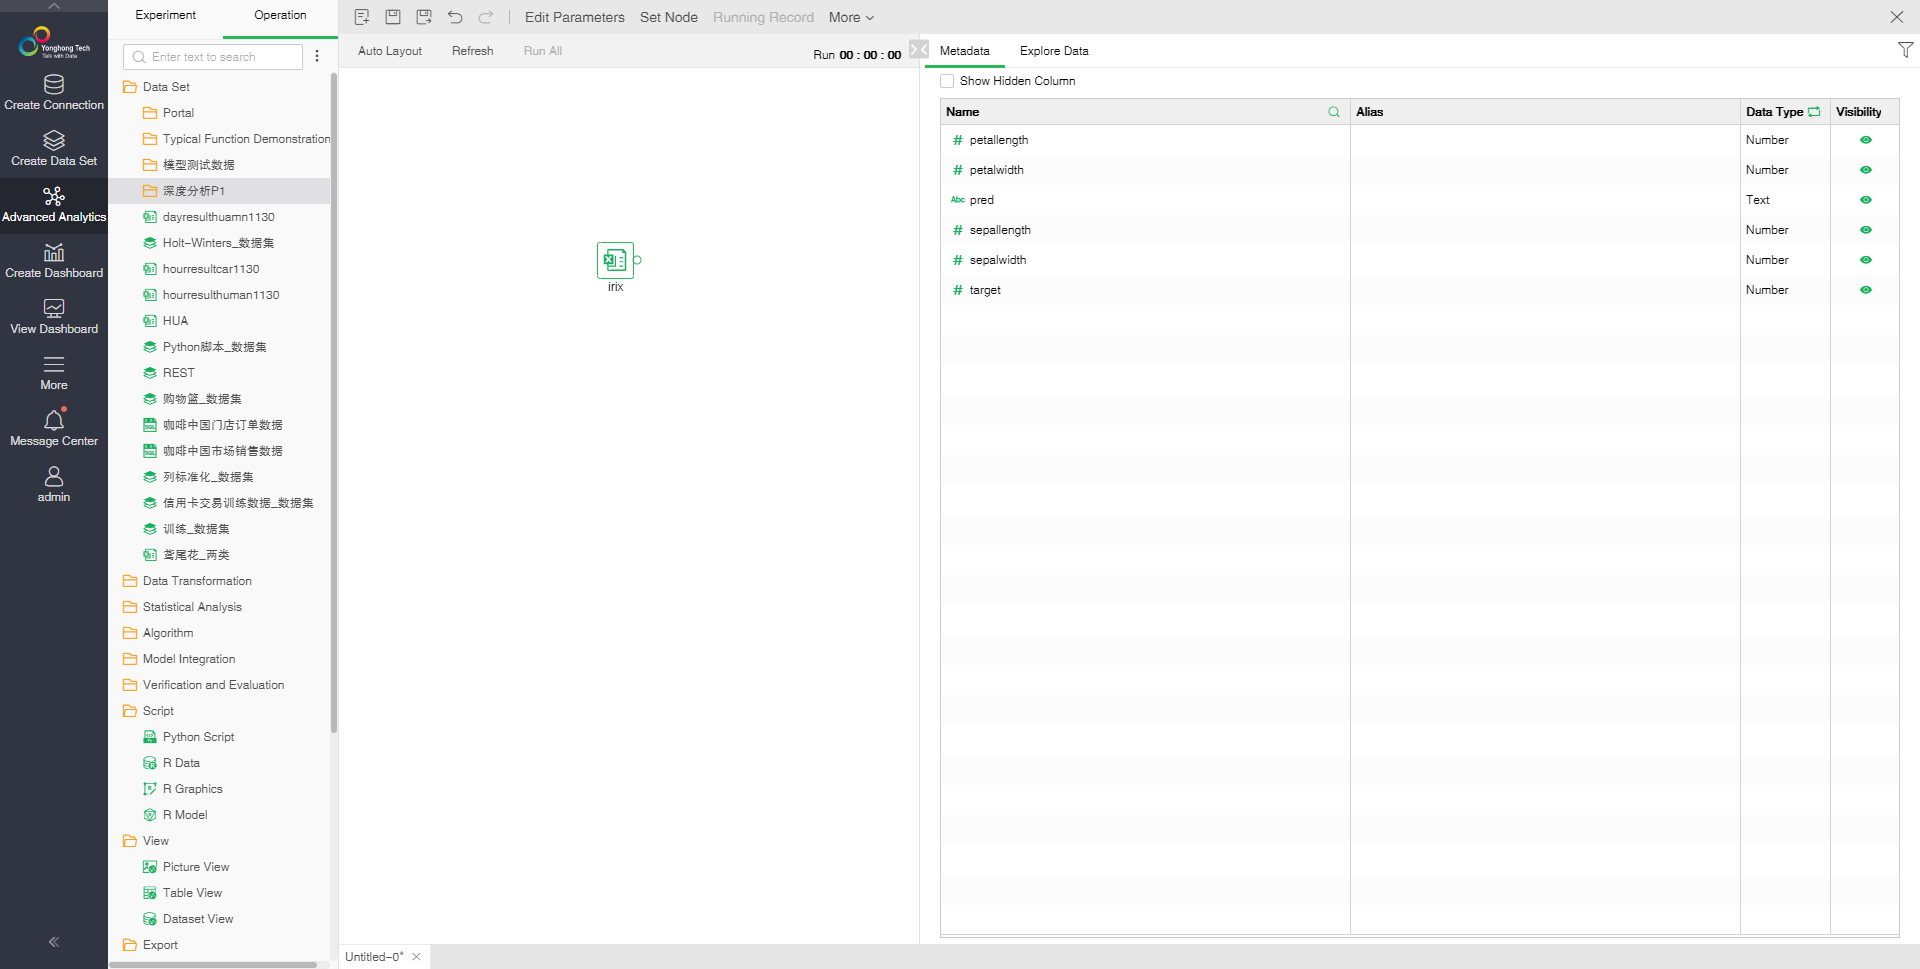
The data includes all data sets created in the data set module. The data set node is the input node of the Advanced Analytics process. Dragging a data set node to the edit area, you can edit the data node, look at the metadata contained in the data set, explore the characteristics of the data, and filter the data.
❖Data Governance
After the data is added to the experiment, the user can still manage the data. However, at this time, the user must select “Open Data Set” through the right-click menu of the data node to enter the Create Data Set module and process the data.
❖Set data Column Permission
In the data node's context menu, select Show/Hide All Columns to hide all the columns in the data node metadata. Instead, all the columns are displayed.
❖View Metadata
[Name] Dataset field name.
[Alias]Aliases can be set for newly created expression fields. The original fields in the data set do not allow aliasing.
[Data Type] The data type of each field in the dataset node cannot be modified.Visibility settings fields are displayed and hidden in the exploration data page. Set field display and hide in exploration data page
[Visibility] Set display and hidden column on exploring data page.
[Show Hidden Columns] When selecting Show Hidden Columns, the columns that set invisible will dispaly in gray in Metadata area. "Visibility" button will display a diagonal line to the right, indicating that this column is not visible, click this button again to set the column visible.
[Expression] Metadata area can be created by clicking the More icon to create a JS expression, create a new group, data range, missing value fills, split columns, go spaces, value mappings, convert to date columns, and convert to numeric columns. There is no over-introduction here. For detailed usage, please refer to Data Governance - Data Types and Classification section.
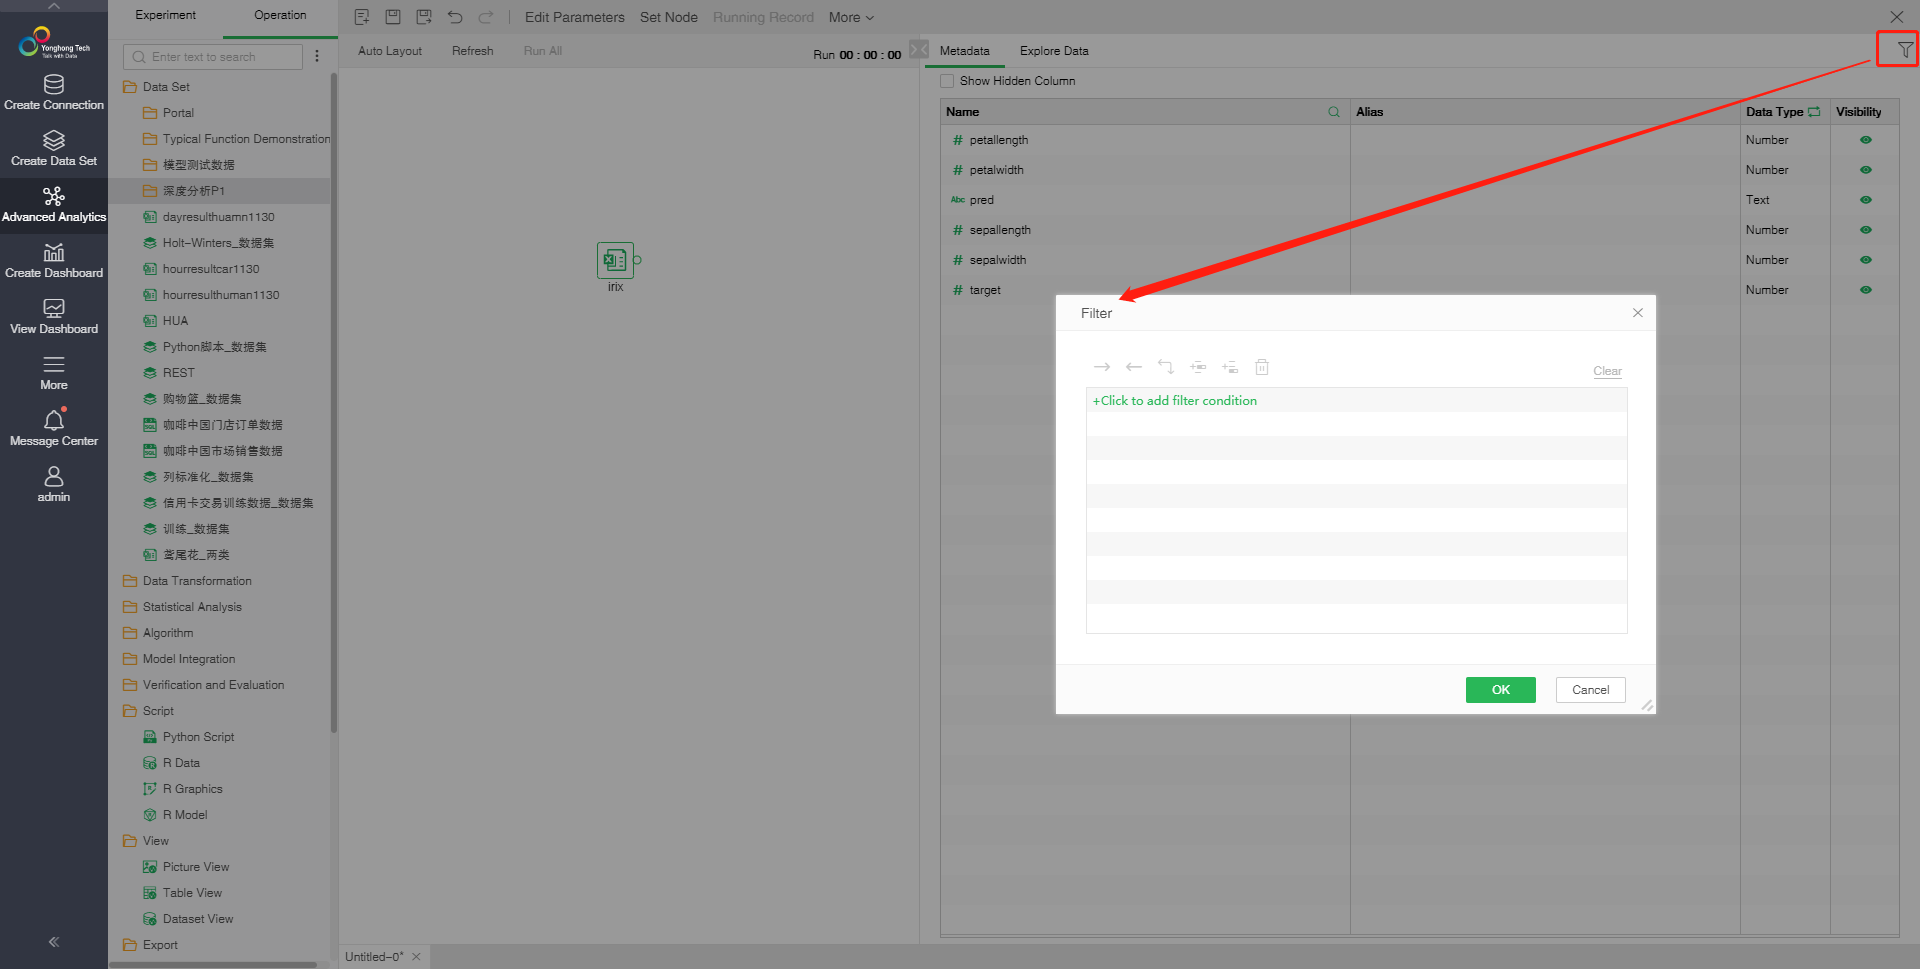
❖Filter Data
You can increase the Filter to filter the row data of the data set. For detailed usage, refer to the section Data Governance - Setting Data Permissions - Filter .
❖Explore Data
A preliminary study of the data in data exploration is conducted to better explain its special nature. Helps choose the right data preprocessing and data analysis techniques. It can even handle problems that are usually solved by data mining. For example, patterns can sometimes be discovered by visual inspection of the data. In addition, a visual interface is used in data exploration to better understand and interpret data mining results.
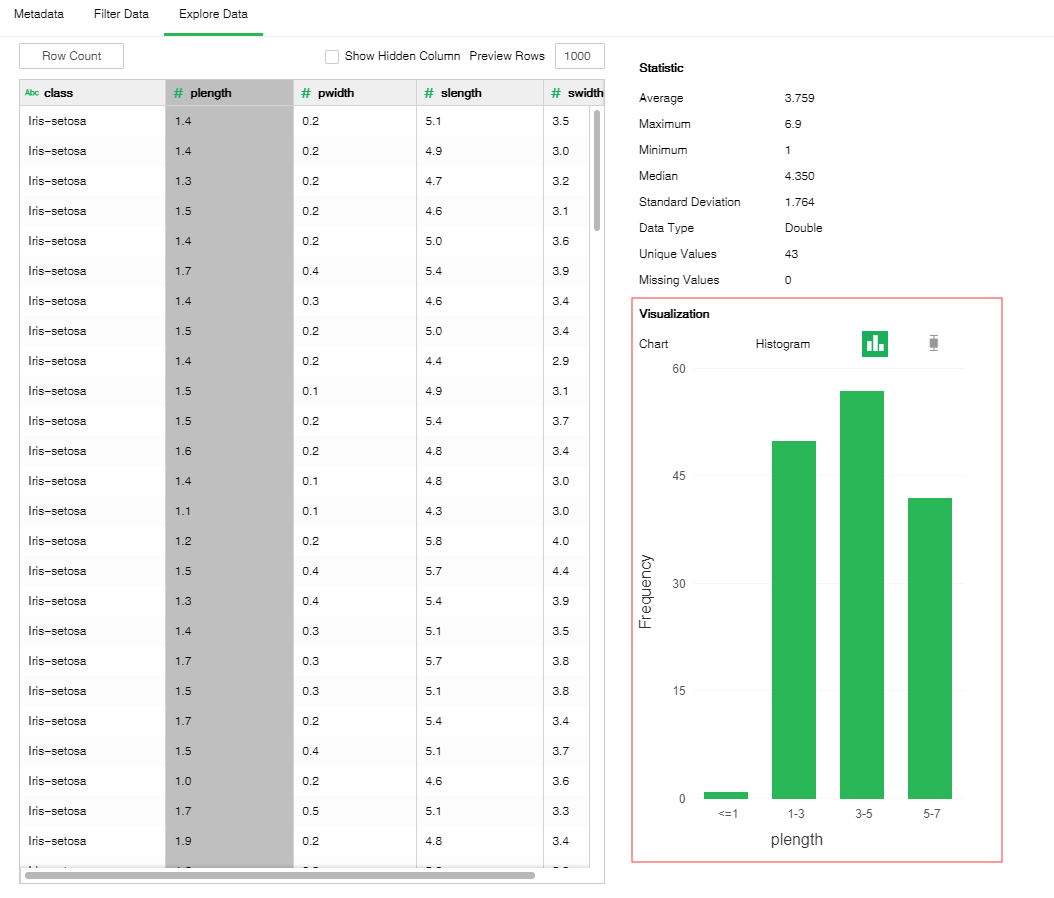
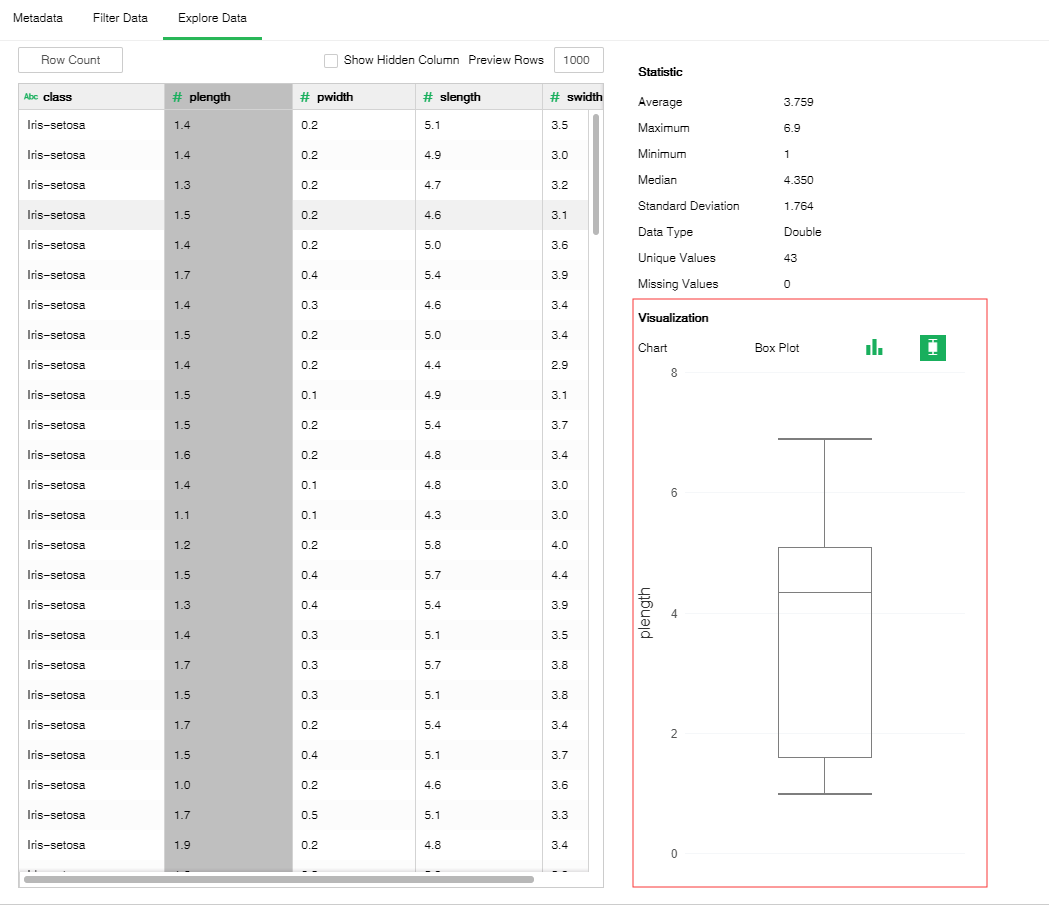
Data exploration interface is as follows:
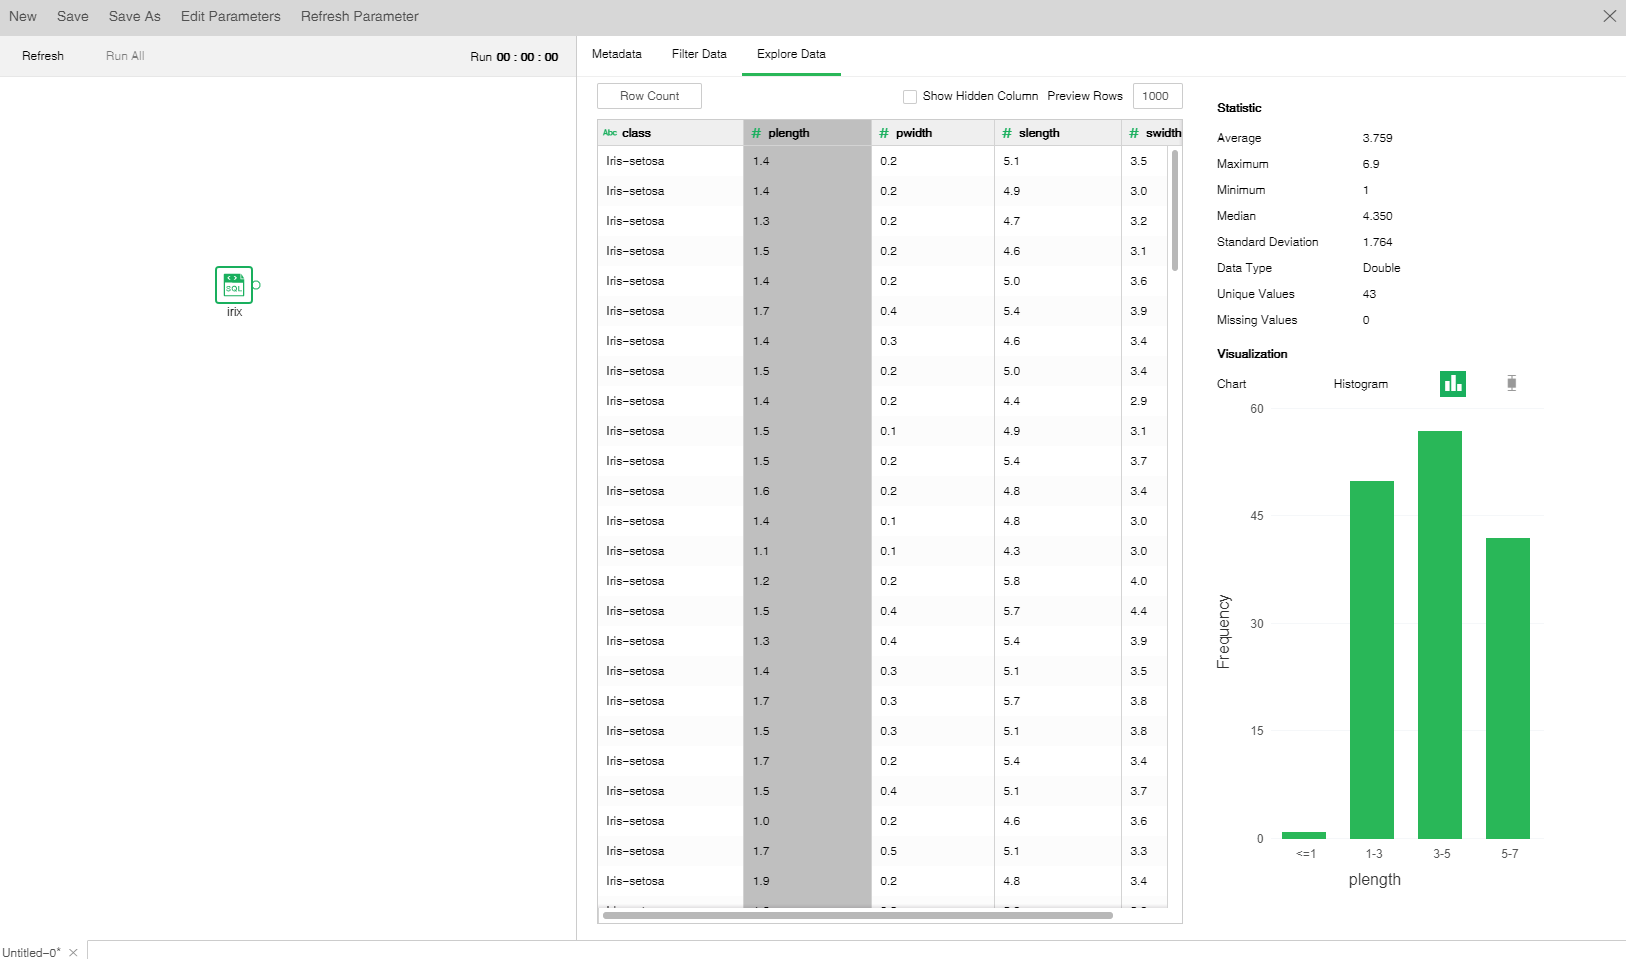
【Row Count】Clicking the "Row Count" button will display the total number of rows of the previewed data set node behind the button.
【Preview Rows】The default number of display rows for the dataset node. The default value is 1000 lines. The number of preview lines can be modified. After the modification, click on the blank to change the number of preview lines.
【Statistic】The statistical area shows the characteristic values of the selected column. Select different columns in the left table to display the characteristic values of different columns.
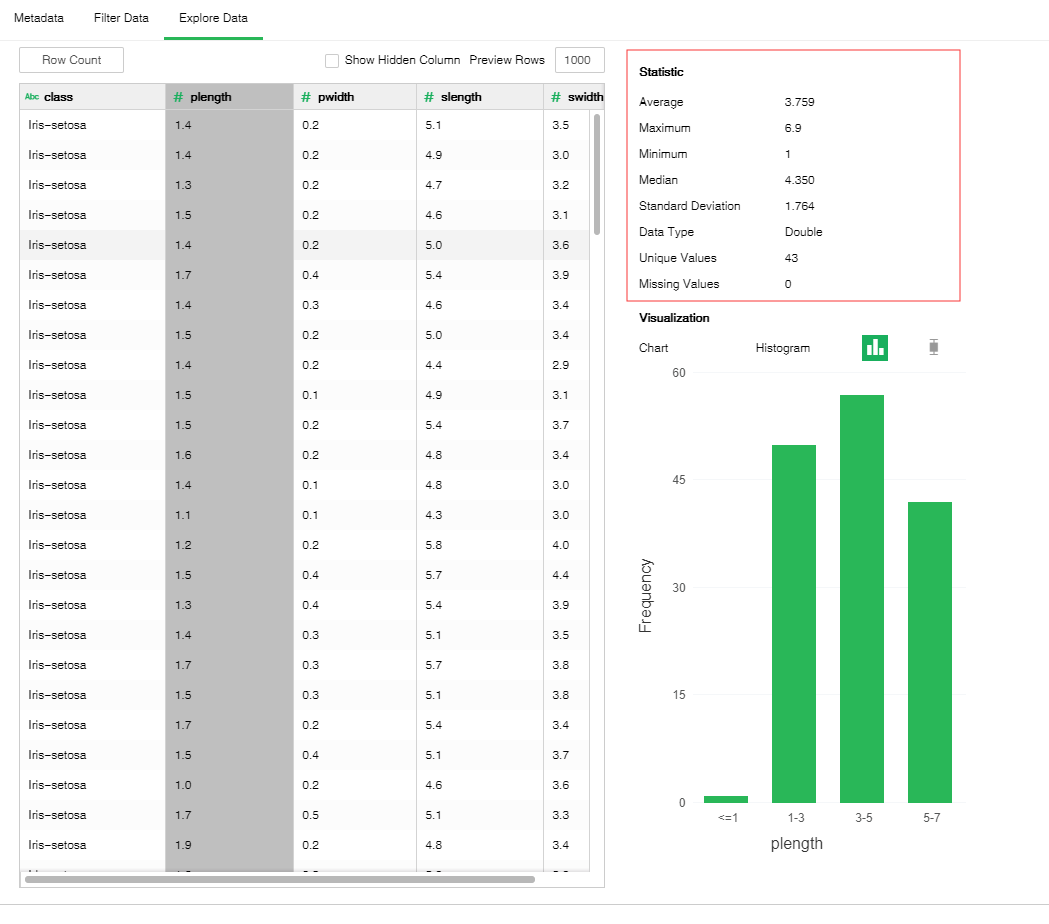
【Visualization】The visualization area shows the results of the data analysis of the selected column through two types of graphs: the histogram shows the distribution of the data for the selected column; the box and whisker plot shows the data range of the selected column and the distribution of the abnormal data. When a non-data type column is selected, no chart is drawn.
Histogram:
Box Plot:
After the data is added to the experiment, the user can also manage the data, set the visibility of the data column, rename the data node, copy/paste/delete the data node.
❖Open data set
In the right-click menu of the data node, select "Open Data Set" to open the data set in the Create Data Set module. (This jump function is removed when integrated into user products)
❖Rename data nodes
In the data node's right-click menu, select "Rename" to rename the node.
❖Copy/Cut/Paste/Delete data nodes
The data node's right-click menu supports copy, cut, paste, and delete operations.
【Copy】 copy the selected data node
【Cut】cut the selected data node
【Paste】 After selecting copy, right-click on the canvas blank to paste and copy the data node.
【Delete】 Click the node right-click menu to click Delete, or click the keyboard delete button to delete, to delete the input and output connections of nodes and nodes.
❖Refresh the data node
In the data node's right-click menu, select "Refresh" to update the synchronization data or parameter information.