|
<< Click to Display Table of Contents >> Yonghong Z-Suite V9.1 |
  
|
|
<< Click to Display Table of Contents >> Yonghong Z-Suite V9.1 |
  
|
❖New Key Features
1. Self-Service Data Preparation
Support Domestic Database Dameng
Support domestic data source Dameng. Users can use jdbc to connect to Dameng database.
Add Built-in Parameter to Get the Currently Visited IP
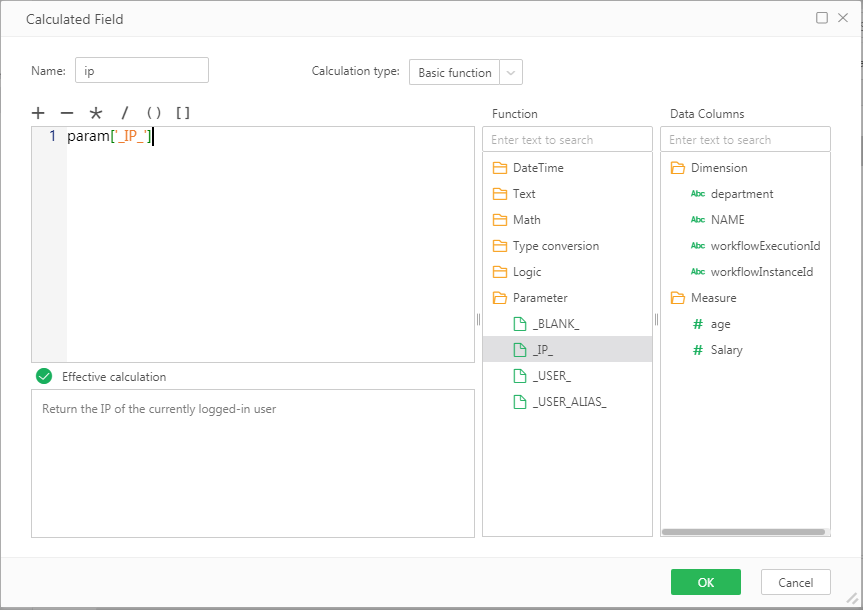
The new version adds new built-in parameter and returns the IP of the currently accessed machine. New calculated columns in data sets or dashboards, scripts of dashboards or components, and filters can all use the newly-added built-in parameter to obtain the IP of the current visitor's machine.
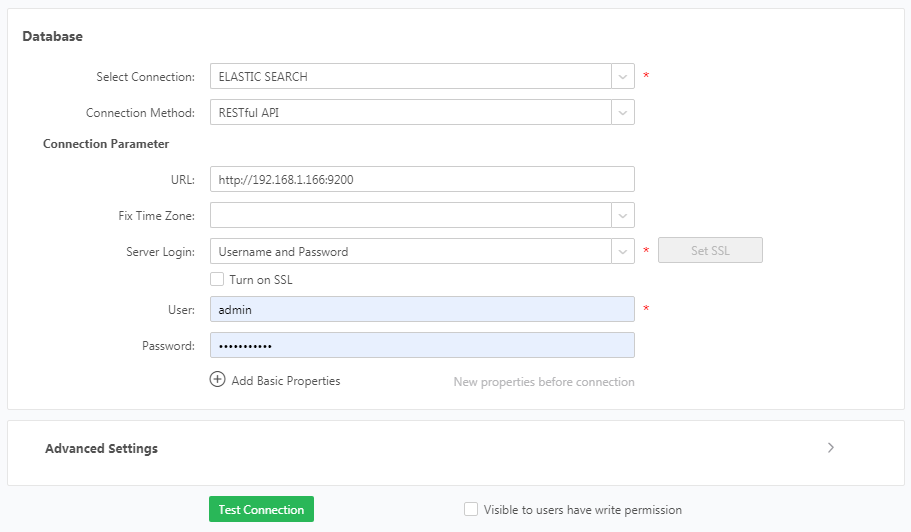
Adds SQL Restful API, A New Method Connected to Elasticsearch
Elasticsearch is a distributed open source search and analysis engine suitable for all types of data, including text, numbers, geospatial, structured and unstructured data. Elasticsearch was developed on the basis of Apache Lucene and was first released in 2010 by Elasticsearch N.V. (now Elasticsearch). Elasticsearch is known for its simple REST-style API, distributed features, speed and scalability, and is the core component of the Elastic Stack.
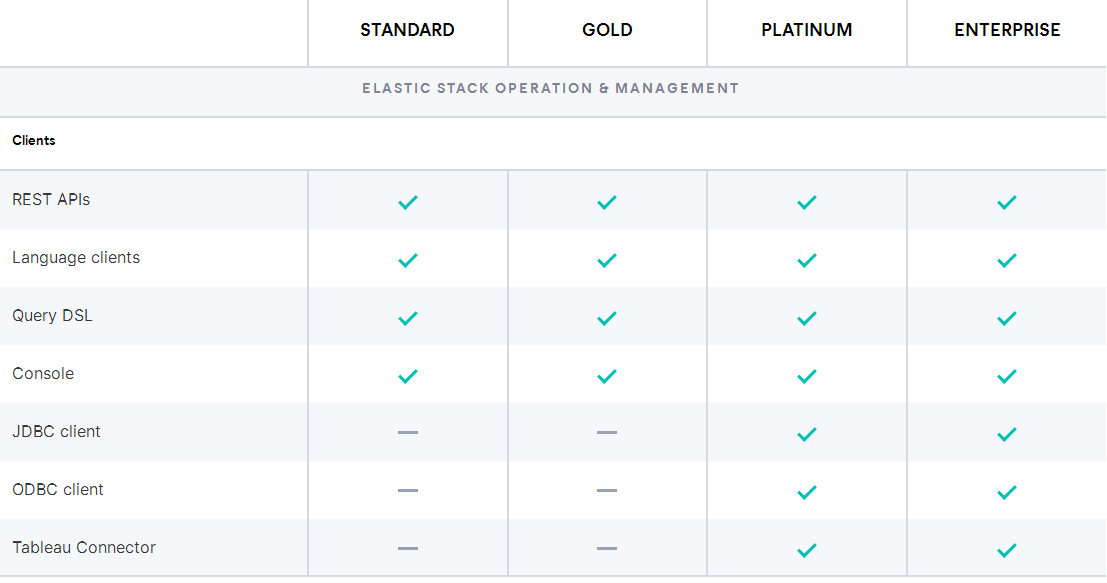
Yonghong supports jdbc to connect to Elasticsearch in version 8.8. But Elasticsearch has many versions, only the platinum version and enterprise version support jdbc. Many small and medium-sized customers use the basic version (Elastic License). Through the integration of the basic version of x-pack, they can use restful to call SQL without paying. In order to satisfy these small and medium-sized customers so that they can directly use ES data source, we support free connection to the community version of Elasticsearch through Restful api for connection calculations.
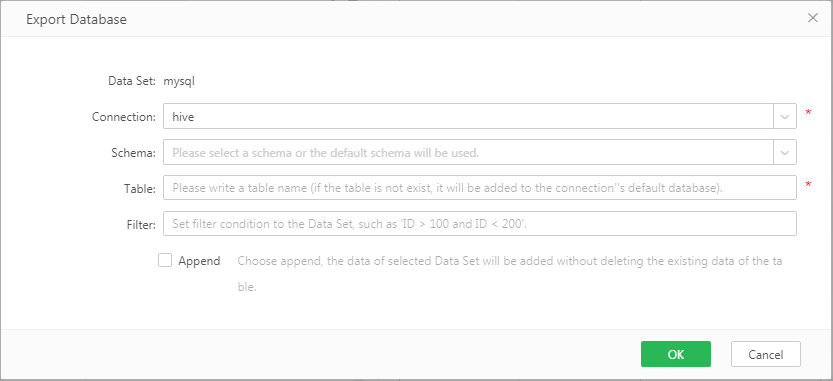
Support Exporting Data to Hive Database
The function of exporting database supports Hive data source, that is, users can export data to Hive database. Note that hive 0.14 recently supports single-row data insertion, so Yonghong only supports versions after hive 0.14.
As of the current version 9.1, the list of supported databases for exporting to database, scheduled exporting to database task, reporting, and creating database tables are:
Oracle, MySQL, DB2, SQLServer, PostgreSQL, Derby, Gbase8a, Hana, GaussDB100, GaussDB200, AnalyticDB (formerly ADS), Hive.
Push-down Enhancement of SQL Data Set Basic Operations and Newly Created Calculated Columns
In the data set of Yonghong, there are many column-level operations. This version has optimized these operations.
The operations, including split columns, grouping, value mapping, missing value filling, removing spaces, text to date, number to date, Convert to number, data binning, and the functions in newly created calculated column have been pushed down to the database, so that the performance is optimized.
Involved databases: Mysql, SQLServer, Oracle, Hive, Postgres, SybaseIQ, DB2.
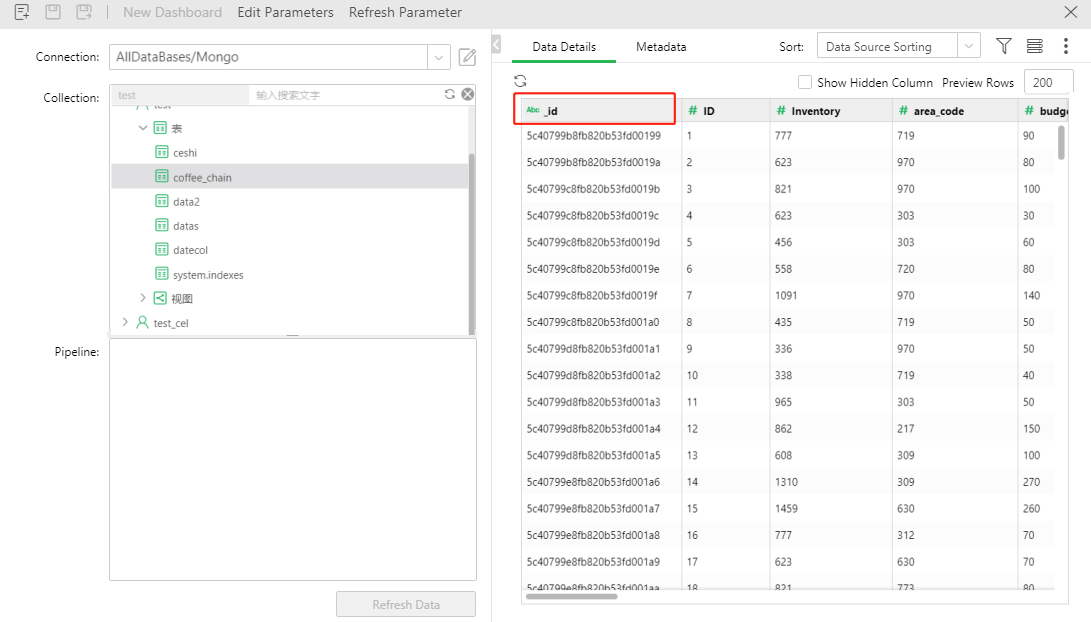
Support mongo_id
In MongoDB, each document needs a unique identifier _id field as the primary key. If not specified, the system will automatically generate a 12-byte unique identifier.
In the past, Yonghong products filtered out the _id field by default, but now _id can be displayed and used as a common field when the collection is selected by default.
Calculated Column Enhancement
1. Multi-granularity expression enhancement
The aggregation calculation part of multi-granularity expressions now supports nested aggregation expressions.
Eg1:fixed(col['MARKET'],col['MARKET_SIZE']::col['calc1']) //calc1 is an aggregation expression
Eg2:fixed(col['MARKET'],col['MARKET_SIZE']::sum(col['cal1'] +1)) //Aggregation expression include detail expression
Eg3:fixed(col['MARKET'],col['MARKET_SIZE']::sum(col['cal1']) +1) //Included the database calculation of the aggregation expression
Eg4:fixed (col['MARKET_SIZE'],col['MARKET']: (IF [cal1]>50000 then 'Y' else 'N' end) //cal1 is an aggregation expression
2. If there is an inequality judgment in the ifelse of the expression, the data type is checked to improve the user experience.
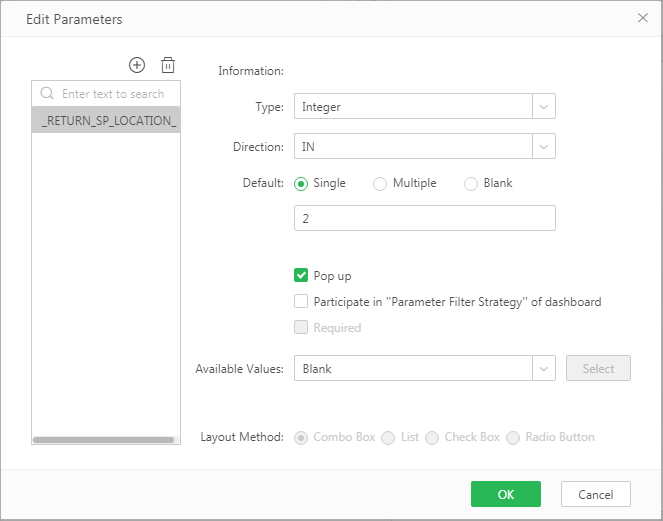
Support Stored Procedures to Return Multiple Result Sets
Stored procedures can return multiple result sets. Previous versions only supported returning one result set.
Now supports to obtain other result sets of stored procedures. A new parameter _RETURN_SP_LOCATION_ is added to the edit parameter. The specified type is an integer. When the value is 1, the first result set is returned, and when the value is 2, the second result set is returned, and so on.
Support Database Stored Procedure Return Cursor
The result set of the cursor is returned in the stored procedure, and the type of out is set to the cursor directly in the edit parameter.
Added support for Greenplum, Postgres, GaussDB200, DWS and other databases.
Example:

If the input parameter of the database is in, the parameter direction in Yonghong is in, and the parameter type must select the data type that corresponds exactly.
When the output parameter of the database is out, the parameter direction in Yonghong is switched to out, and the parameter type must be cursor.
Note that Yonghong does not support inout cursors.
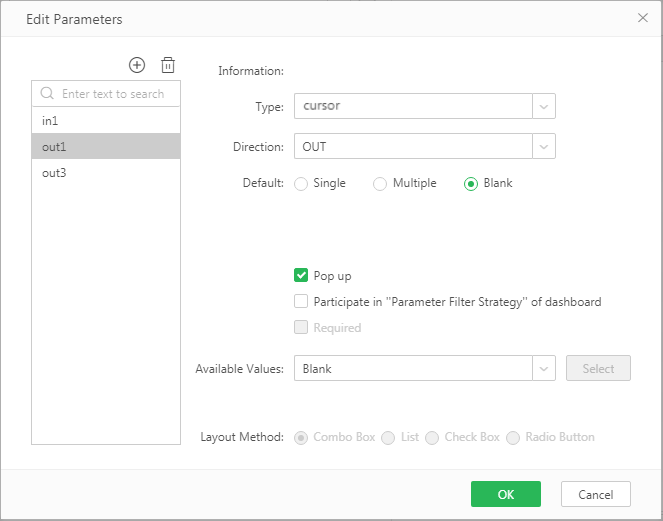
Table Paging of Detailed and Aggregated Data of Sysbaseiq and Other Eight Databases
The following 9 databases support paging of detailed and aggregated data: SQL Server, MySQL, DB2, Oracle, Gbase8a, Kylin, Sybaseiq, Hana, and Dameng DM.
The detailed and aggregated data supports true paging, and the aggregated calculation involved:
Average |
|---|
Max |
Minimum |
Range |
Count |
Accurate count of different values |
Different value count |
Sum |
Sum of square |
Weight sum |
Weighted average |
Correlation coefficient |
Covariance |
Median |
Mode |
Population standard deviation |
Population variance |
Product |
Pth percentile |
Custom Totals and Subtotals (Ordinary Data Set, Multidimensional and Kylin Cube)
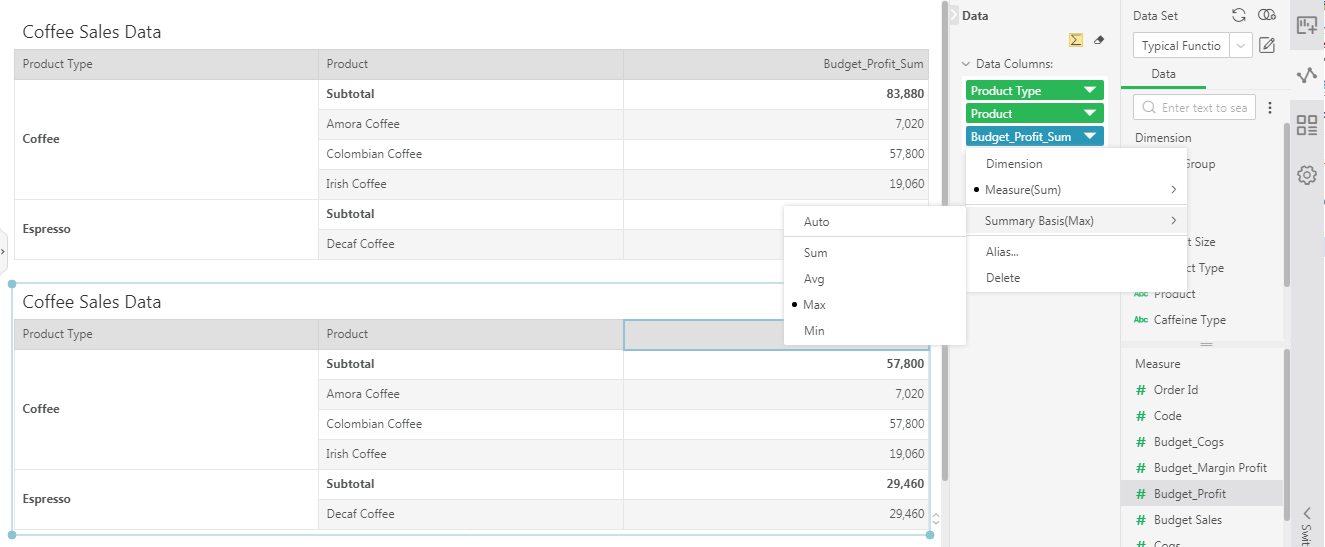
In previous versions, Yonghong realized the summary of data or summary within a group through the total/subtotal. In the new version, Yonghong further enriches the scenarios of totals and subtotals. In addition to totals, it also supports custom totals/subtotals, that is, switch the summary basis of totals and subtotals: the summary basis that can be switched becomes total, maximum, and minimum value, average value.
In ordinary tables and pivots, users can set the total or subtotal of a certain column of data, and switch the summary basis of the measurement column to the maximum, minimum, and average values to calculate the maximum, minimum, and average value.
You can set the summary basis for each measurement column separately.
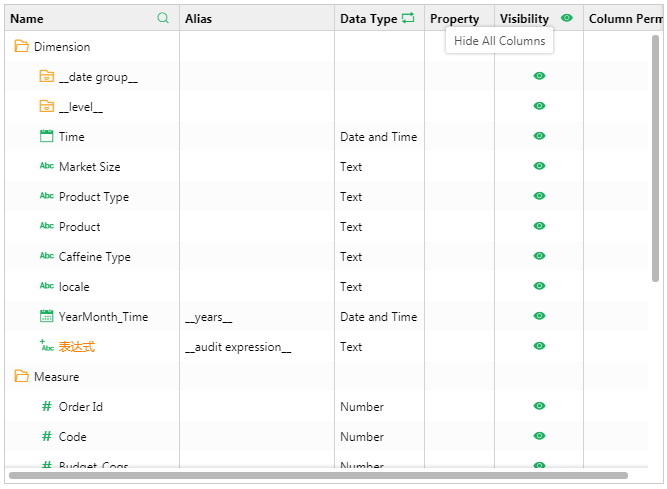
One-click to Hide/Show All Columns of the Data Set
The data set page supports one click to hide/show all columns.
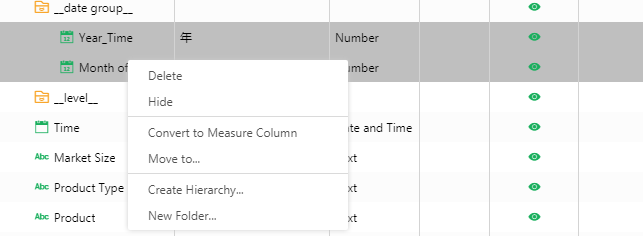
"Move to" Is Added to The More Menu of Dataset Metadata
In the more menu of the data set metadata column, a "move to" option has been added, through which the user can move the column to a hierarchy or folder.
Data Set Supports Multiple Columns to Move, Hide, Delete
In the metadata area of the dataset, users can select multiple columns by pressing ctrl, and in the More menu, perform batch operations, including deleting columns, hiding columns, moving columns to a hierarchy or folder, and converting column types.
When Deleting a Hierarchy or Folder, The New Column in The Folder/Hierarchy Is No Longer Deleted
When deleting the hierarchy or folder before, in addition to disassembling the level or folder, the newly created column in the level or folder is also deleted. The 9.1 version has optimized this function. In the new version, when you delete a folder or a hierarchy, the newly created column will not be deleted, but the relationship between the folder and the hierarchy is dissolved.
Calculated Columns of Different Data Types Have Different Icon Styles, Making It Easier to Distinguish Data Types
Although previously calculated columns are divided into different data types, all calculated columns (regardless of the data type) are represented by the same icon. The new version optimizes the UI details, and uses different icons to represent calculated columns of different data types, which is convenient for users to distinguish.

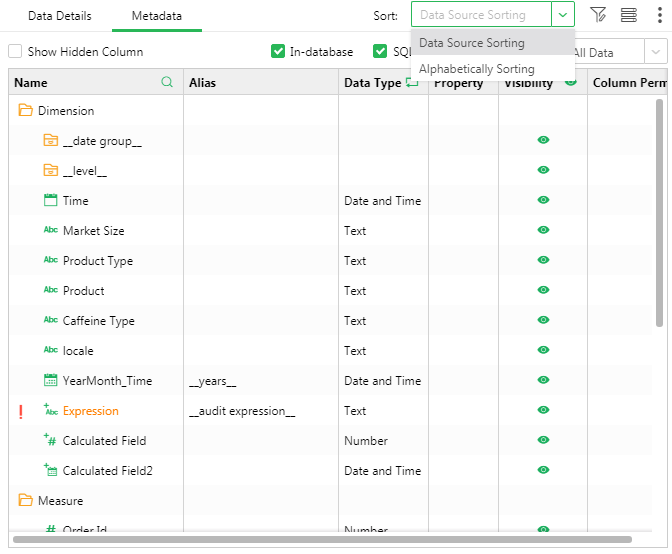
New Data Source Sorting
When a user connects to a database, the columns in the database table have a default sort order. Some users are accustomed to using alphabetical sorting, while some users are accustomed to keeping the order of data set columns consistent with the database. In order to take care of the usage habits of the second type of customers, Yonghong supports sorting of data sources. When the user chooses to use "Data Source Sorting", the order of the data set columns will be consistent with the order of the columns in the database table.
2. Dashboard
Performance Optimization of Parameter Components When Selected All
The new version simplifies the database execution when checked all in the the list parameter components, and the performance is improved.
Dynamic Calculation Enhancement
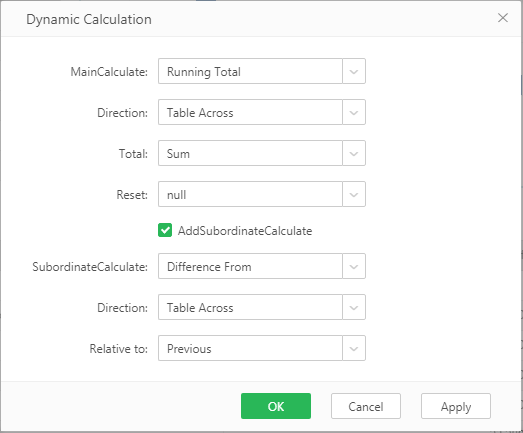
•Support subordinate calculation
The new version of dynamic calculation supports subordinate calculation. When the calculation is [cumulative total] or [mobile calculation], you can add a subordinate calculation, that is, perform a second calculation on the current calculation, so that the dynamic calculation capability is enhanced and more flexible. The figure below shows the calculation method of the cumulative summary percentage.
•Add percentile calculation
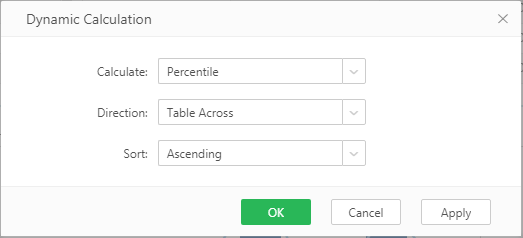
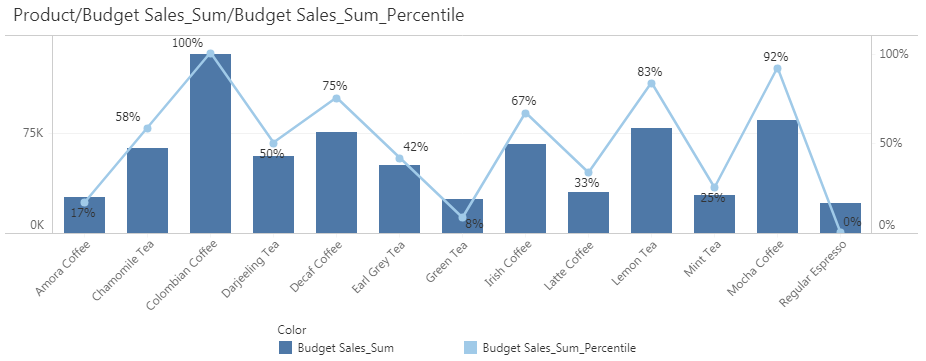
The new version of dynamic calculation adds percentile calculation. When you want to know the distribution of data, you can use percentile calculation. Percentile calculation supports two sorting methods, ascending and descending.
•Ranking calculation supports ranking strategy
The new version of ranking calculation supports four sorting strategies, as follows,
Competitive sorting (1, 2, 2, 4): Assign the same rank to the same value, the highest value is ranked first, the next two same values are ranked second, and the next value is ranked fourth.
Adjusted competitive sorting (1, 3, 3, 4): Assign the same ranking to the same value, the highest value is ranked first, the following two same values are both ranked third, and the next value is ranked No. 4.
Dense (1, 2, 2, 3): The rankings of repeated values are all the same, that is, the next number in the ranking sequence, the next value after the repeated value will be calculated according to the repeated value and the single value.
Unique (1, 2, 3, 4): Different rankings will be assigned to duplicate values according to the direction in which the ranking is calculated.
Date Column Supports Fiscal Year Setting
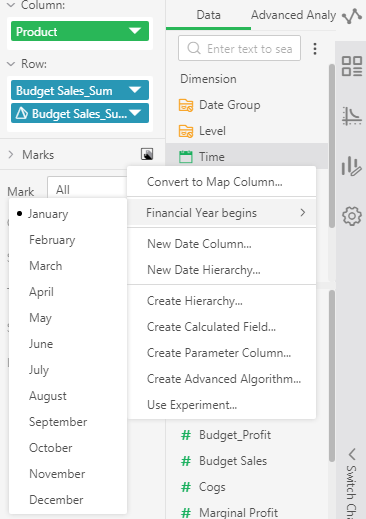
The time dimension of the dashboard in the new version supports setting the start of the fiscal year, including date and timestamp type fields. The date expression is not supported. The beginning of the fiscal year defaults to January, which is the calendar year data.
If the user modifies the beginning of the fiscal year, it will affect the quarter of the timestamp field, and the year, quarter, and week of the integer field. The date expressions established before and after the modification will be synchronized. Other types of fields are not affected.
Taking April 1, 2014 as an example, if the fiscal year starts in April, then:
Timestamp field: Quarter: (Chinese: FY2015 Quarter 1; English: Q1/FY 2015).
Integer field: Year: (Chinese: Fiscal Year 2015; English: FY 2015); Quarter: (Chinese: 1 Season; English: Q1); Week: (Chinese: Week 1; English: 1).
It should be noted that the script date function does not consider the start of the configured fiscal year. If the user modifies the date format through the text format, regardless of the impact of the beginning of the fiscal year, the format conversion is performed based on the original data.
Dashboard Data Loading Optimization
The new version is optimized for opening the dashboard. When the first screen of dashboard is loaded, the data of the next screen will be automatically loaded to optimize the user experience when browsing the dashboard.
Menu Optimization
The new version optimizes the menu and interaction.
The format is divided into partial format and component format, which is convenient for users to distinguish settings.
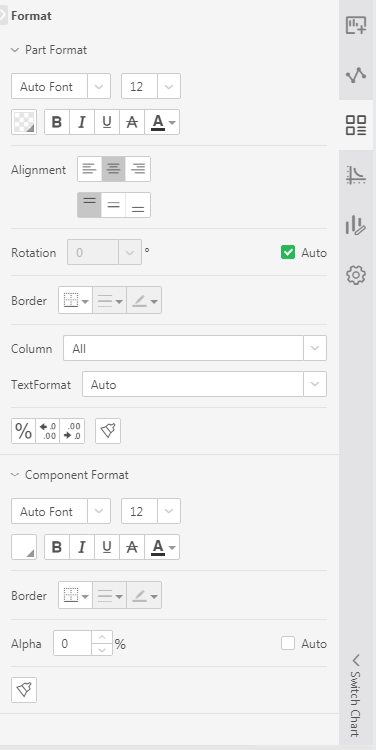
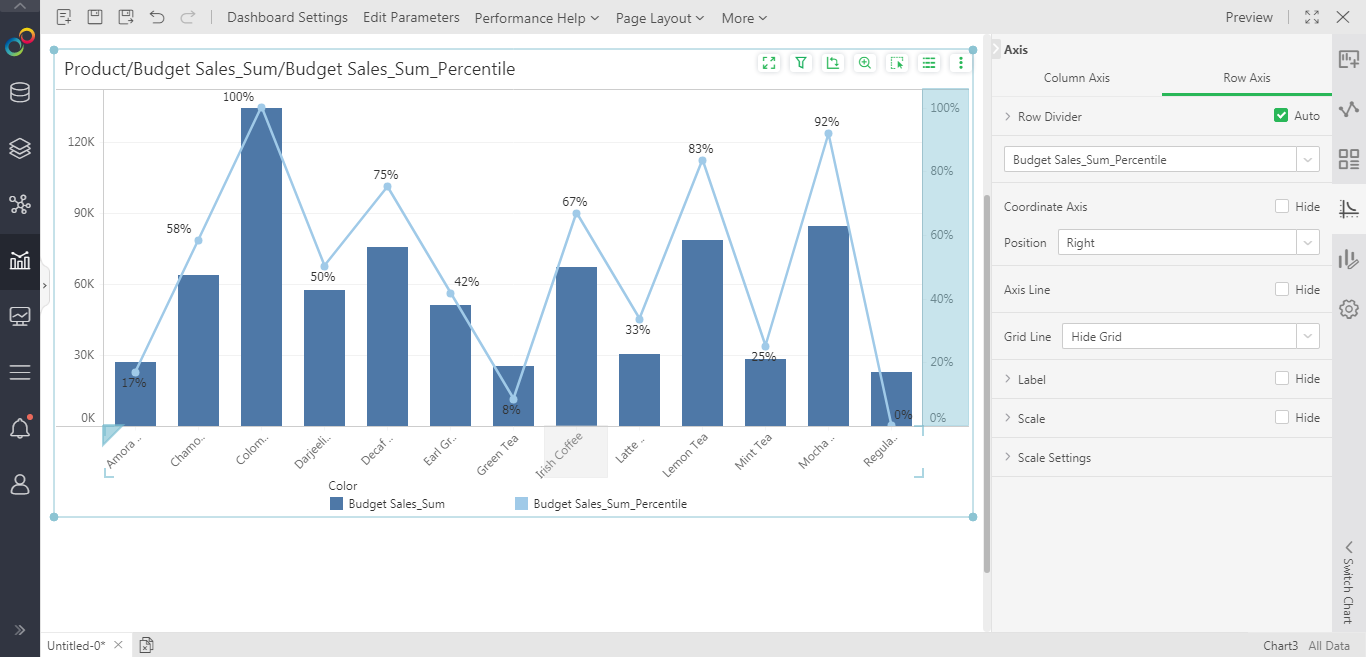
In terms of interaction, enhance "what you see is what you get". When the user clicks on the mark, axis, label, and legend, the items in the corresponding menu on the right will switch and display according to the data selected by the user, reducing the user's operation steps.
List Parameter, List Filter, Tree Filter Support Input Value to Filter
The new version list parameter, list filter, tree filter, added "input" operation, configurable in component operation. When viewing old and new dashboards, it cannot be entered by default. After manually configuring "input" in the view operation, click to input a single value or multiple values to filter. When multiple values are input, they are separated by ";", and after input, click Enter to enter into effect.

Synchronization of Modified Name of Parameter Component
After the user modifies the parameter component name, the new version will synchronize all the places used in the dashboard, instead of being unable to get results or reporting errors as before, improving user experience.
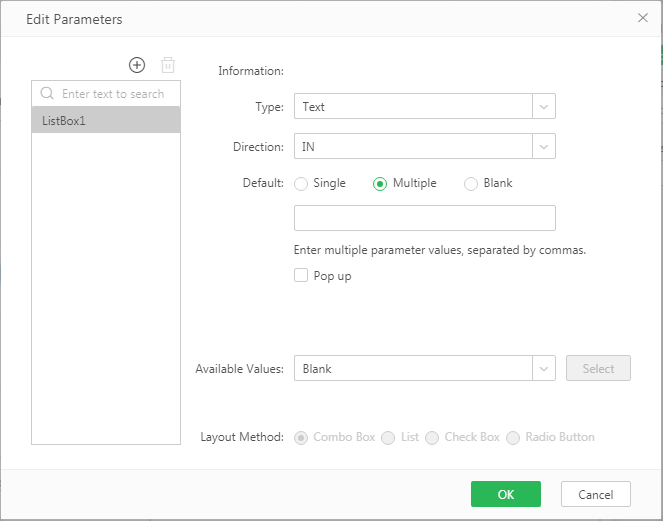
Edit Parameter Dialog Supports Search
The new version optimizes the edit parameter pop-up window and adds a search function. When there are many parameters, it is more convenient to find parameters.
Portal Optimization
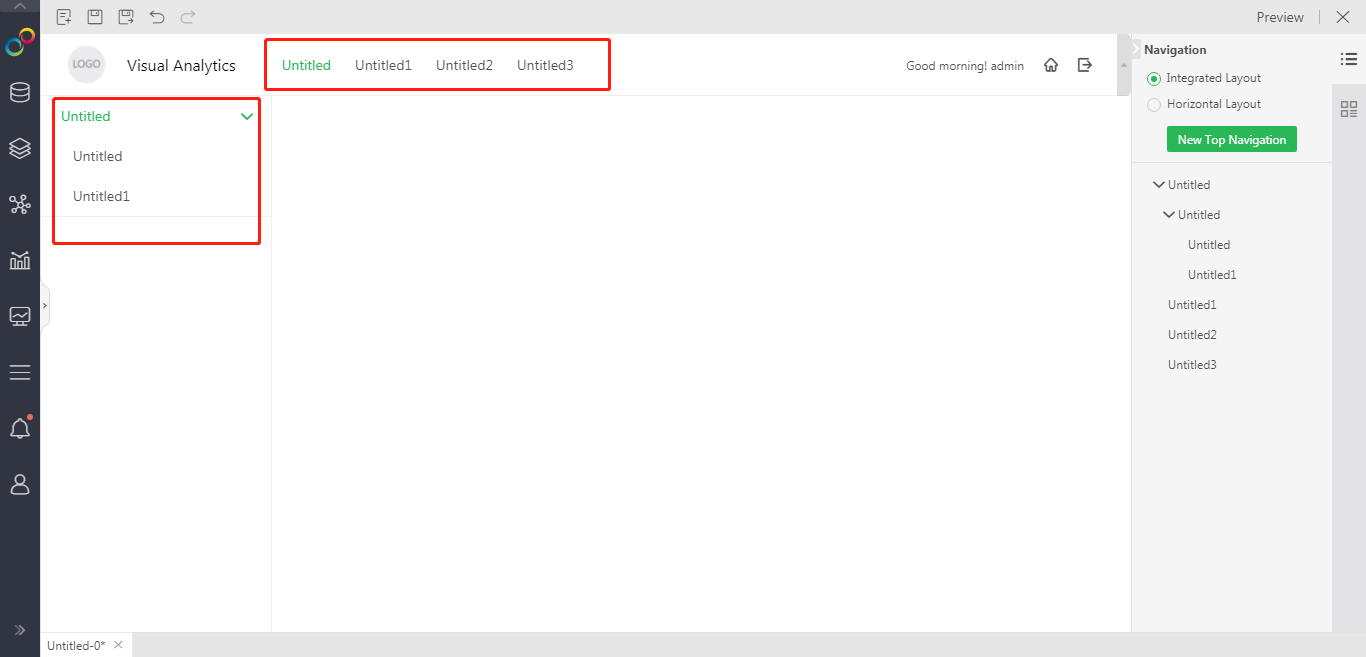
The new version optimizes the portal experience. Users can drag the first-level navigation of the portal to adjust the level or position, and adjust the entire portal menu at will. The tree on the right menu also supports users to drag and adjust at will. Greatly enhance the portal editing experience.
Component Parameter Transfer Operation
The component parameter transfer operation function, through the component parameter transfer, the chart can pass the value of the bound column on the component to the parameter in the case of brush, selection or automatic. Users can use parameters to filter other homologous/non-homogenous components and other linkages.
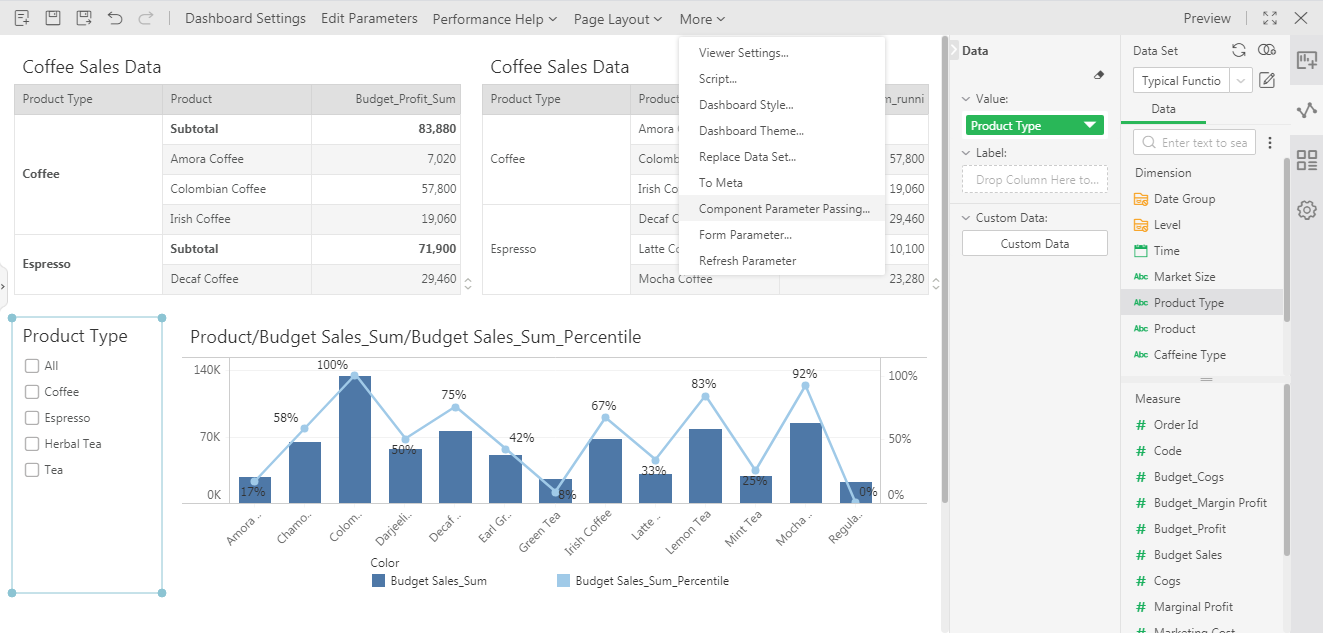
The dashboard supports multiple parameter transfer operations, as shown in the figure below:
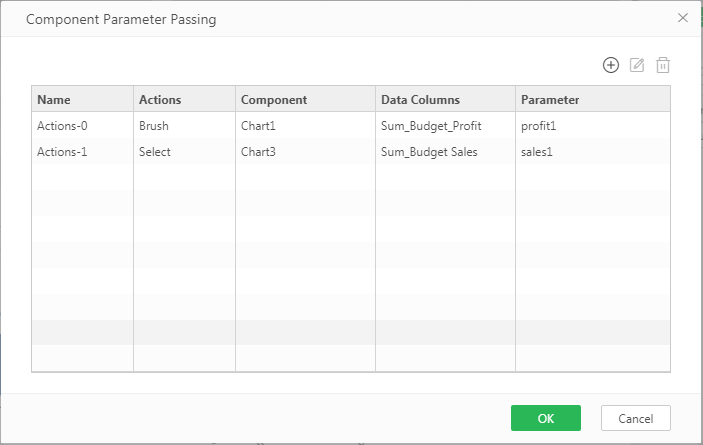
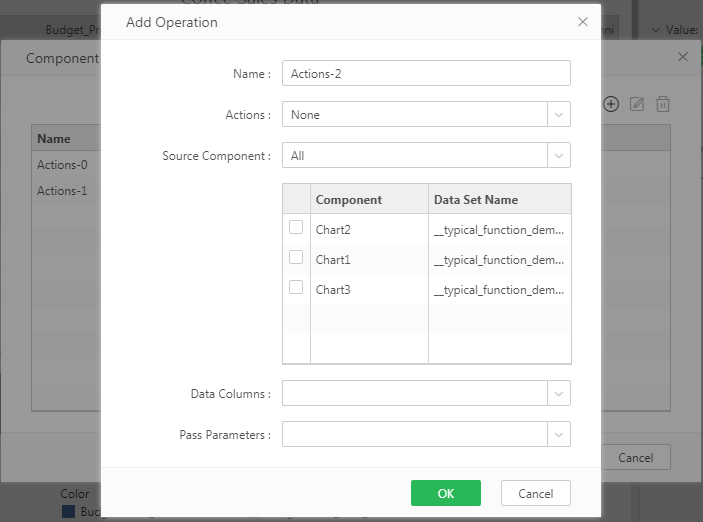
The operation types are divided into three types: none, brush, and selection. None, that is, when the source component data changes, the value is automatically passed to the parameter. Brush and selection, that is, pass the value to the parameter when brush or selection.
The source component can select multiple components at the same time, and the data column must be a column that is commonly bound to multiple components (may have the same name).
Multiple values may be passed in the passed parameters, please pay attention when using them.
Filter Component and Parameter Component Default Value Optimization
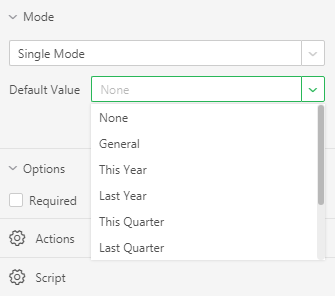
In the new version, the list filter, list parameter, and drop-down parameter components support the [Select the first value by default] function, that is, open the dashboard and select the first option in the data by default.
The date filter component and the text parameter date type have newly added default values such as the day before yesterday, this year, the previous year, this quarter, the previous quarter, and the maximum value to meet more usage scenarios.
Dashboard Loading Optimization
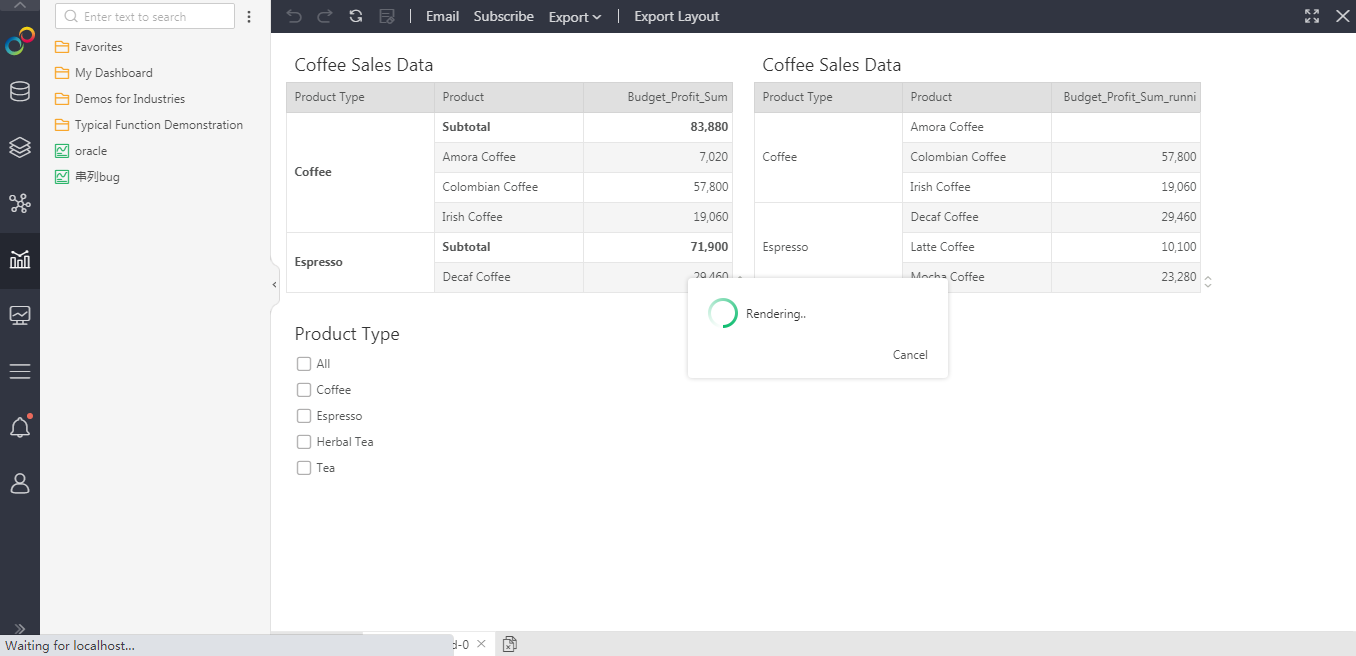
When previewing and viewing dashboards in the new version, the loading step display is added to optimize the experience when the dashboard is loaded. The loading animation can be configured through viewer.loading.name.
Script Supports Setting runtime Grid Format
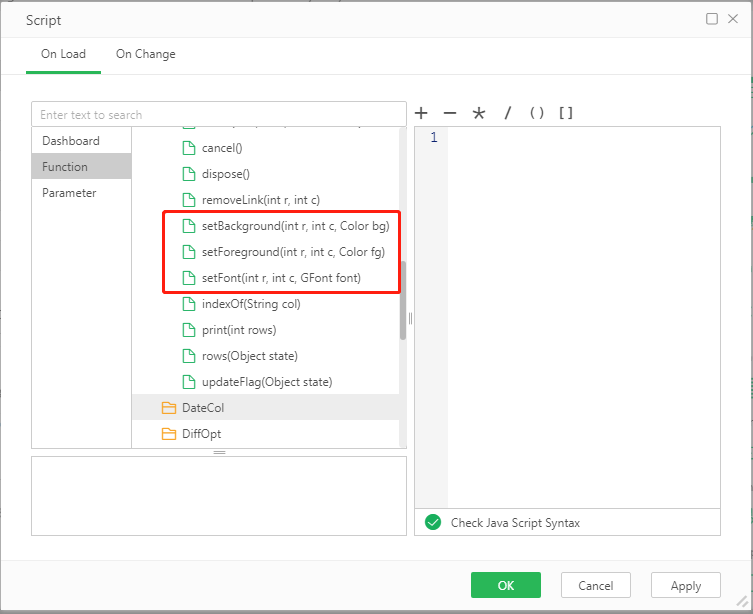
The new version of the dashboard script adds three table object functions to support the setting of the runtime grid format of the normal table, pivot table, and freestyle table. The specific interface is under [Function]-[DataGrid], as follows:
setBackground(int r, int c, Color bg);
setForeground(int r, int c, Color bg);
setFont(int r, int c, GFont font);
Export Permission Optimization
The new version has optimized the user's export permission. If the user does not have the export permission, including PDF/EXCEL/WORD/PNG/CSV format. Then
When editing a dashboard to set a hyperlink, the hyperlink cannot be set to export;
When viewing the dashboard and clicking export, it cannot be exported and the user will be prompted that there is no corresponding export permission;
When exporting using URL, the export cannot be performed and the user will be prompted that there is no corresponding export permission.
Freestyle Table Optimization
•Cell synchronization optimization
When you modify the cell name in the new version of the freestyle table, the places used the cell, including highlights, hyperlinks, alerts, filters, calculation between cells, etc., will be automatically synchronized and no manual modification is required.
•Cell merge optimization
In the case of merging cells, you can still maintain the expanded display based on the parent cell data, and the data will not be automatically merged when the data is the same.
Portal Combination Supports URL Reference
The new version supports portal combination to be accessed via URL, just splice the following parameters after the URL,
?proc=0&action=portal&isPreview=true&path=&isCell=true;
Bring the path of the portal combination after Path.
Freestyle Table and Pivot Supports Wide Adaptation
In the new version, freestyle tables and pivots support wide adaptation, and the wide adaptation of ordinary tables is optimized, and the display is more reasonable.
Rich Text Optimization
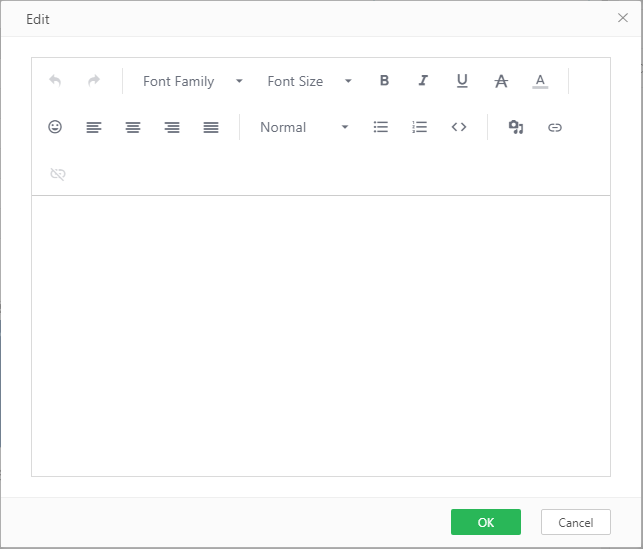
The new version has a new design and optimization of rich text, the interface interaction is more beautiful and friendly, and the font, font size, and color are more abundant, to meet the needs of more scenes.
Batch Submission Optimization
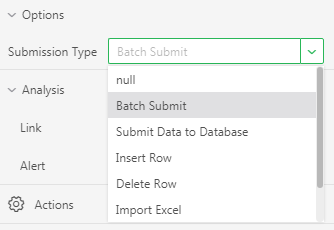
The new version optimizes the batch submission process and interaction, and removes the <Batch submission> option in [Dashboard Settings]-[Advanced].
When using batch submission, you only need to drag in text, picture or submit button, and set [Settings]-[Options]-[Type] to <Batch submission>, no need to write additional scripts.
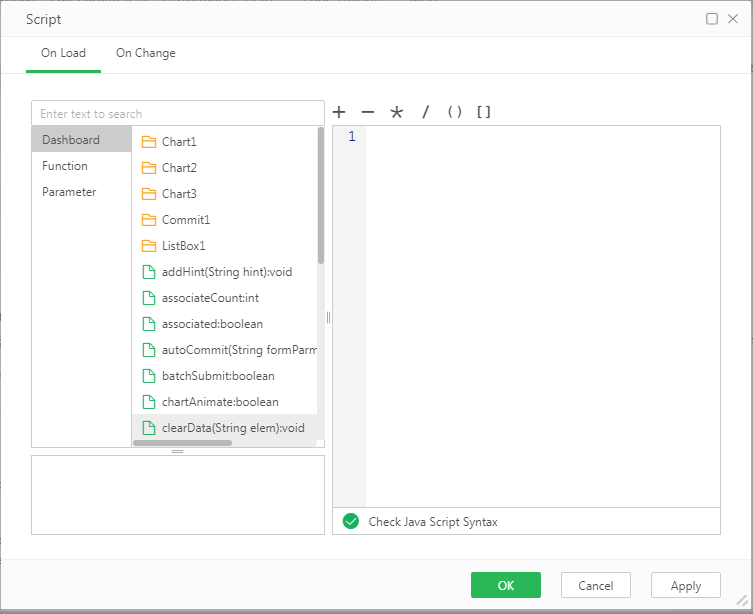
Script, Dynamic Calculation, Target Line Added Application Function
In the new version of the script, dynamic calculation, and target line pop-up windows, an [Apply] button has been added. Users can view the running effect through [Apply], which is very convenient for writing scripts, setting dynamic calculations and target lines.
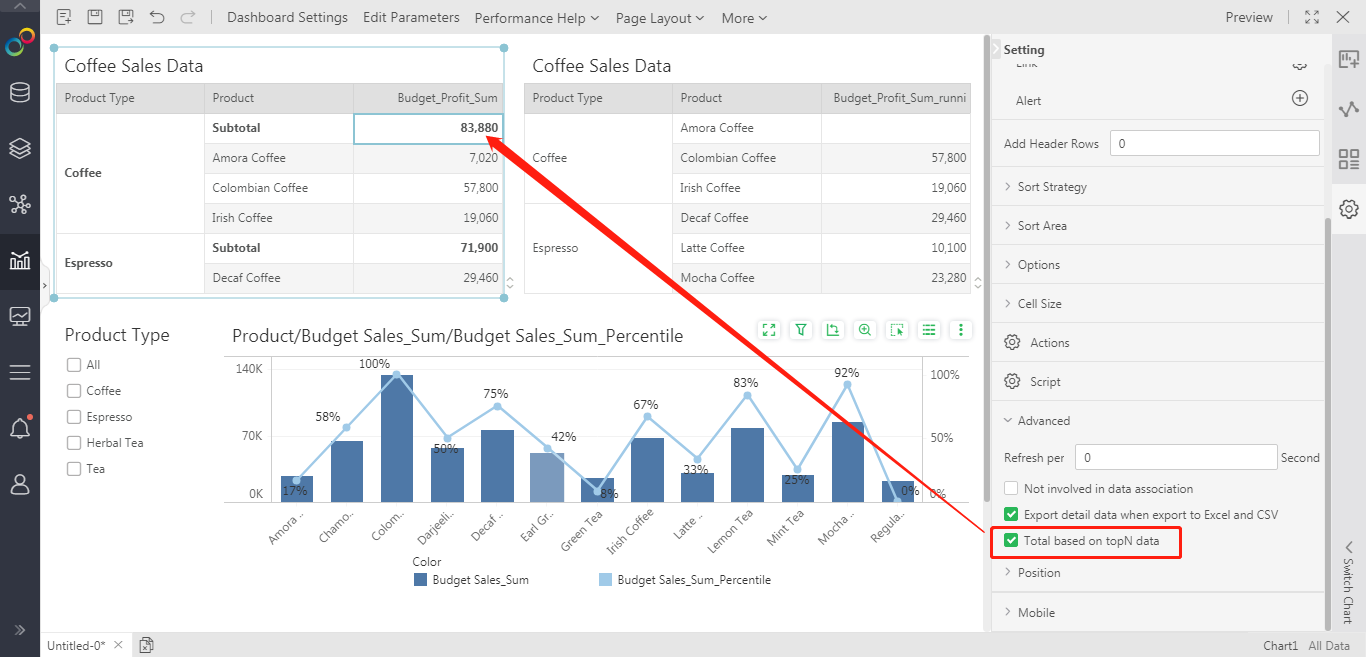
Optimized Display of TopN Total for Normal Table and Pivot
In the new version of normal tables and pivots, the option of <Total is calculated by TopN data> is added in [Settings]-[Advanced], which is checked by default. When checked, the total and subtotal results of the normal table and pivot table are displayed as TopN data; when it is not checked, the total and subtotal are displayed as all data.
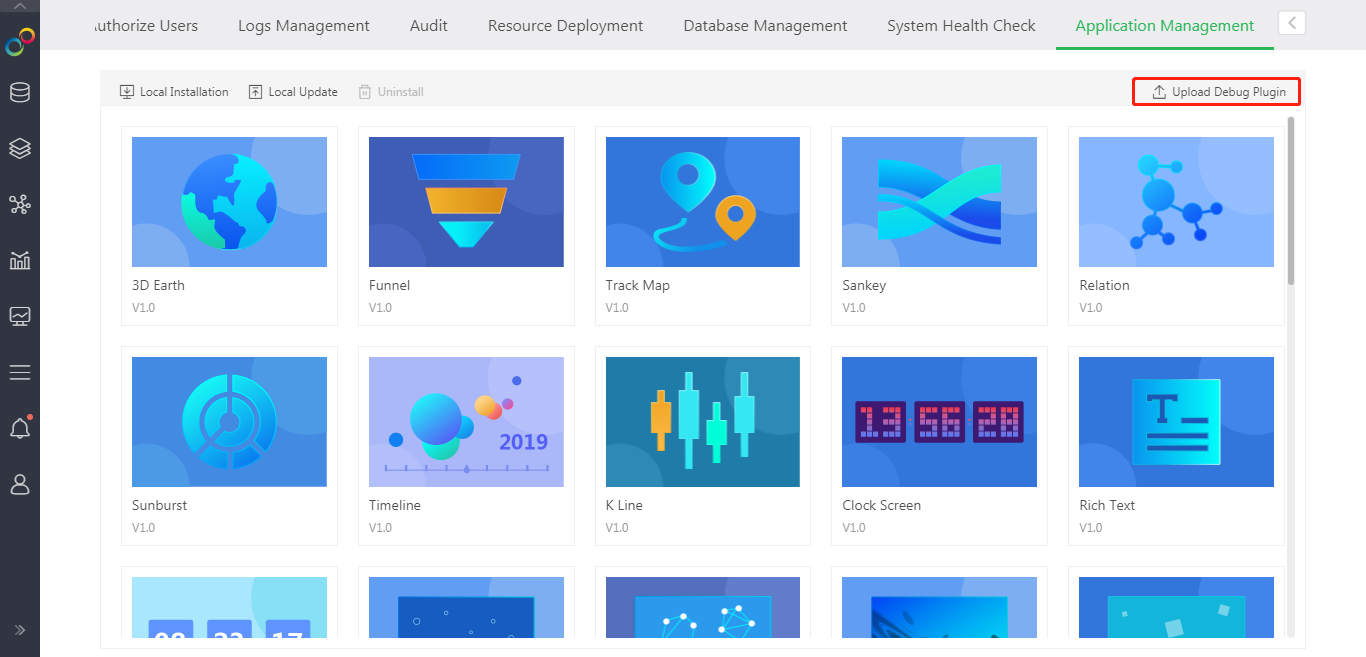
Application Development and Debugging Process Optimization
Developers of the new version no longer need to package through official channels when developing the Yonghong application. After the source code is packaged locally in the Jar package, it can be debugged through the upload debugging plug-in in [Manage System]-[Application Management]. The entry is as follows.
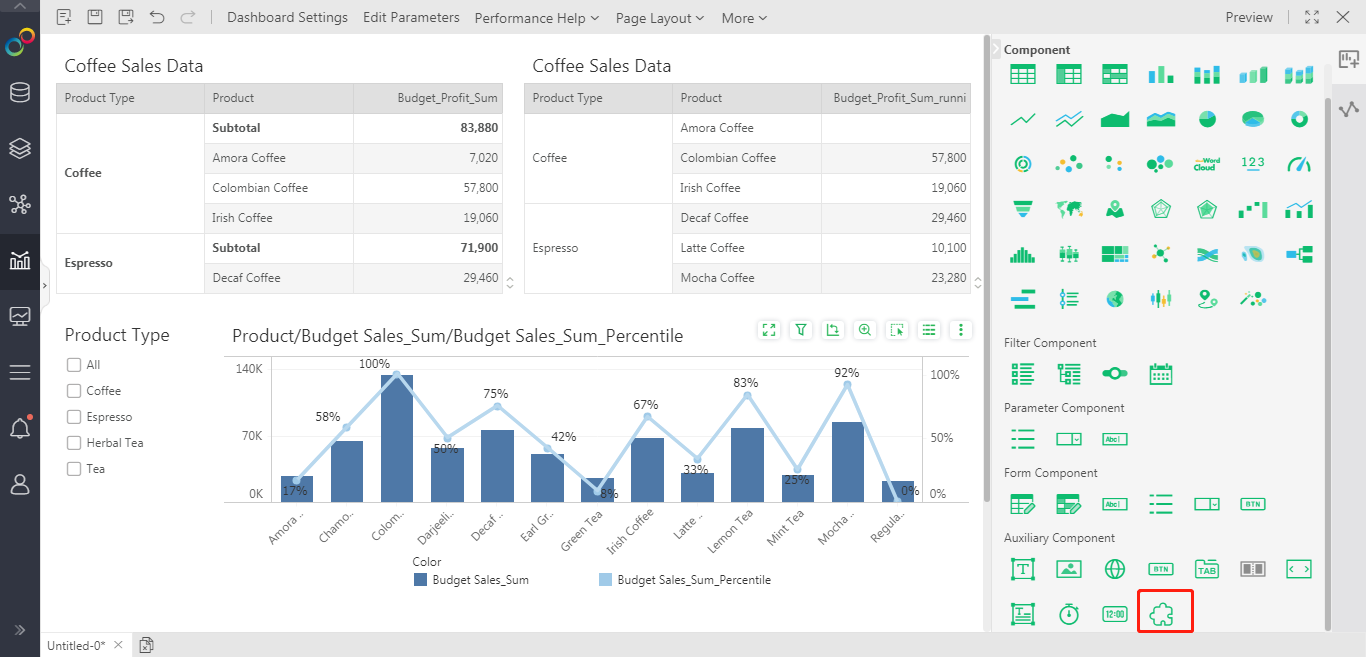
After the installation is successful, you can see the corresponding application in the edit dashboard interface, as shown below:
The debugging application supports disabling and enabling, and it can only be run when editing dashboards and previewing dashboards. The debugging plug-in cannot be used when viewing dashboards. If you need to check and use, you still need to package it through official channels.
Currently, only operators, components, charts, dynamic background and other types of applications are supported for debugging. System integration applications do not support debugging.
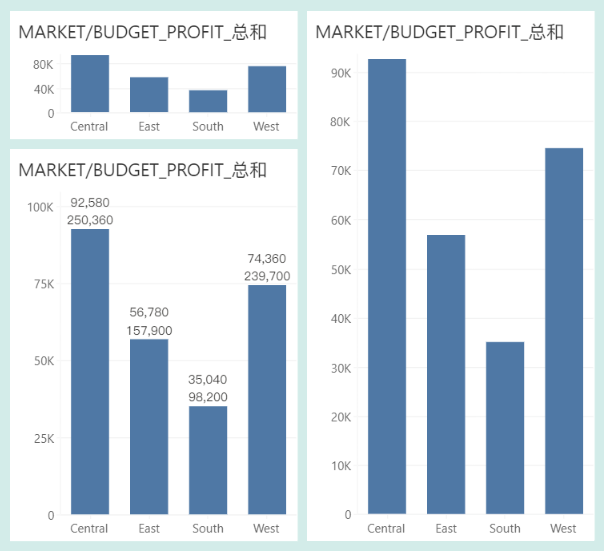
Intelligent Axis Scale Optimization
Dynamic intelligent display optimization is performed for the measurement axis scale of the chart, which draws the best axis scale according to the bound data and the size of the component. At the same time, it solves the problem of poor display of the axis scale when adding multiple lables left over from the previous version.
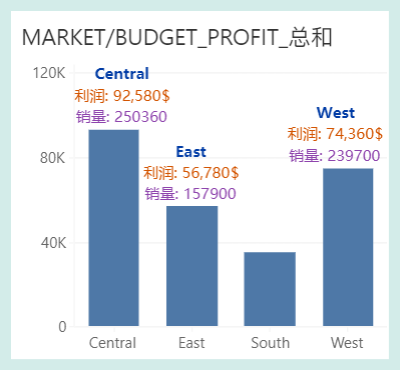
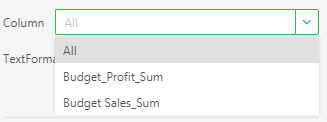
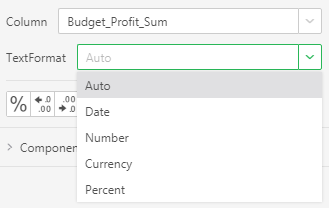
Multi-label Support Format Setting
Multi-labels internally support formatting. Through the interface, you can set the font, font size, font style, color, alignment, fast insertion of the column bound to the component, original script writing behavior, preview, reset, etc.
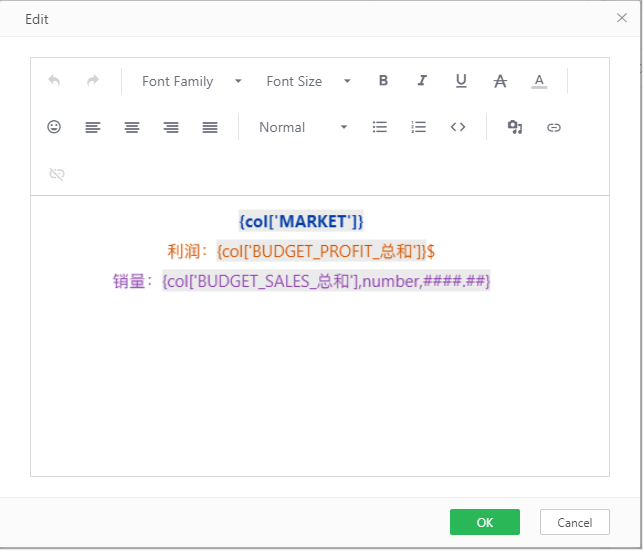
At the same time, separate data format settings can be performed for the certain field, which is convenient for users to quickly define data formats.
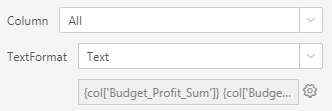
Waterfall Chart Summary Label Optimization
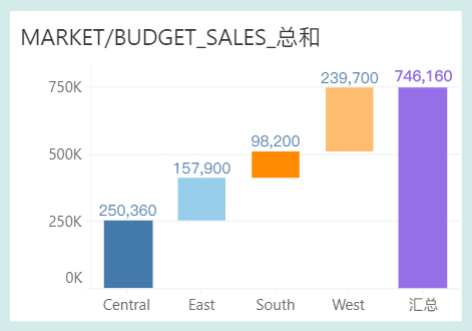
The summary label of the waterfall chart supports separate formatting, and supports the color setting of the summary mark after binding the color column.
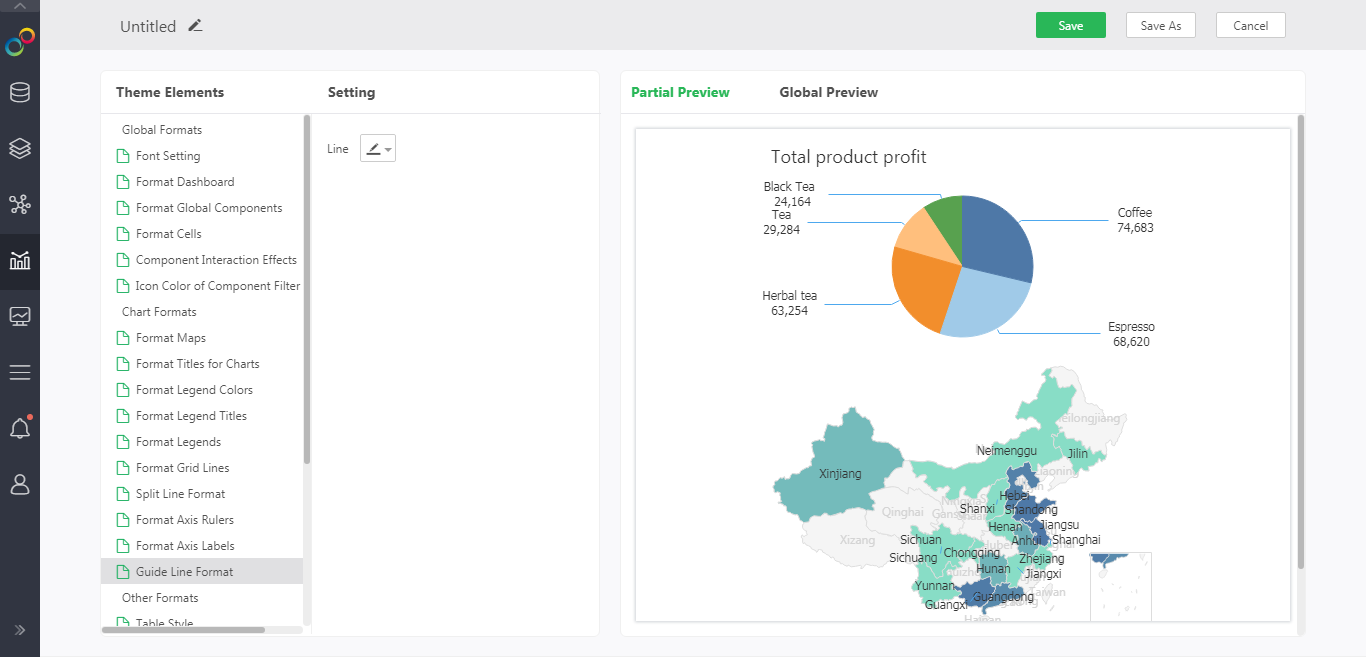
Guideline Optimization
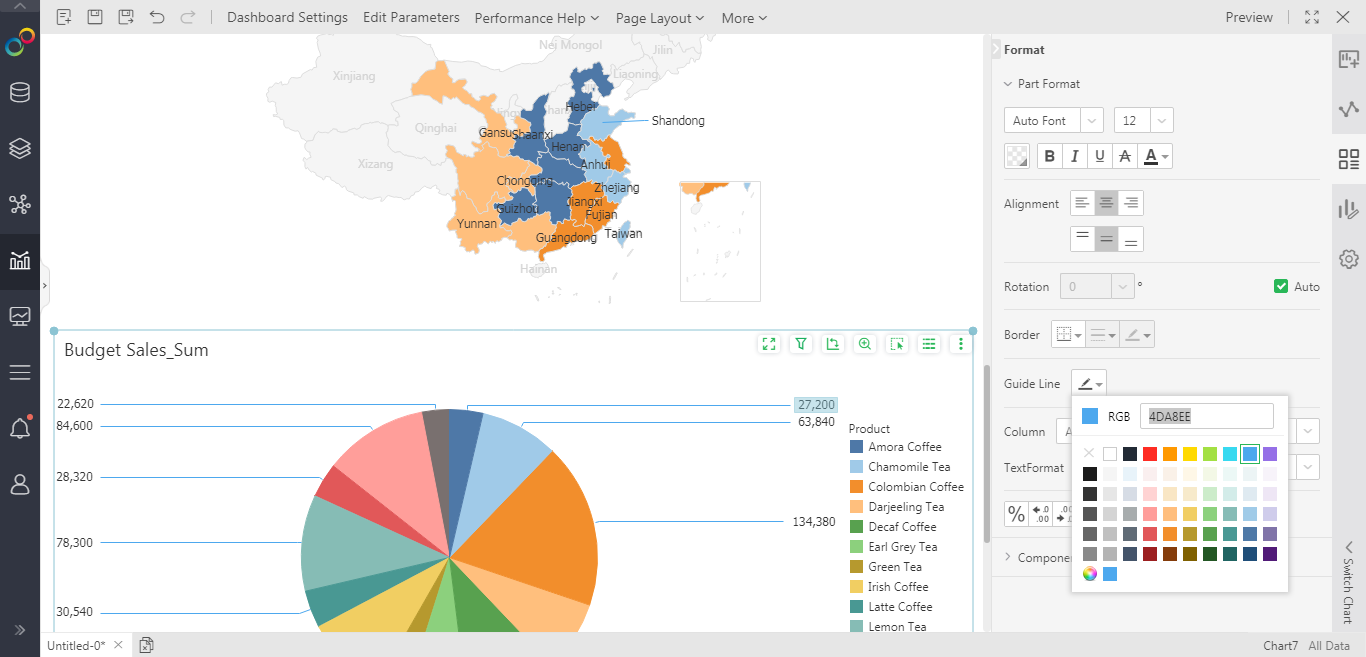
For pie charts and maps, local formatting is supported for the guide lines of labels. Users can also define the color of the pie chart and the guide line of the map in the custom theme.
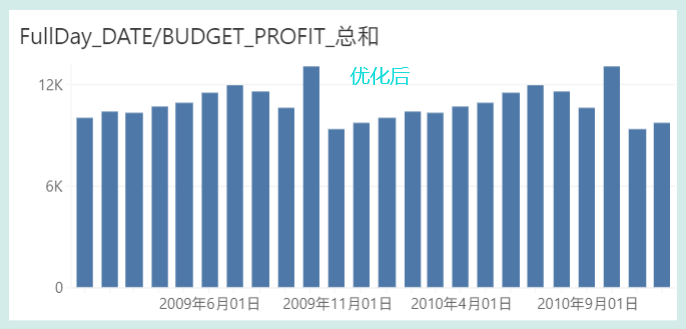
Continuous Time Axis Scale Optimization
When the time axis label is rotated by 0°, it supports automatic calculation of the interval distance, so that it can display the time scale reasonably according to the component size and data range.

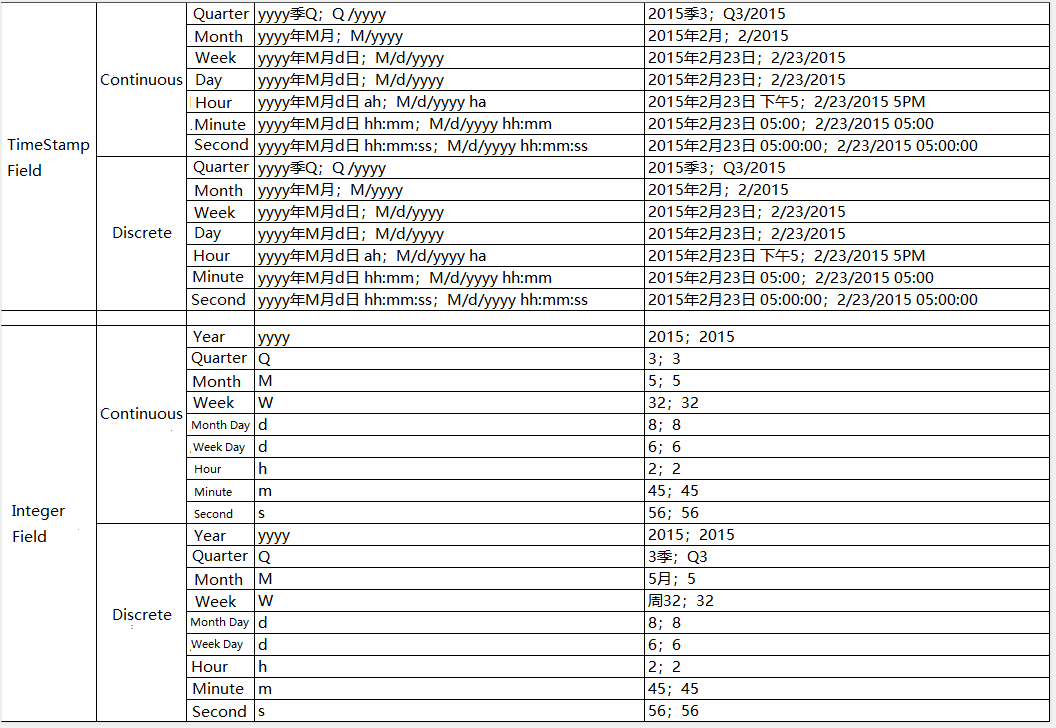
Data Format Default Value Optimization
Optimize the default value of the dashboard data format. Redefine it according to the data type, displayed location and component type. When the metric data is applied as continuous, it is displayed in thousands format (such as 68,125), and when it is applied as discrete, there is no specific format (such as 68125). The date data format will be displayed according to its defined level.
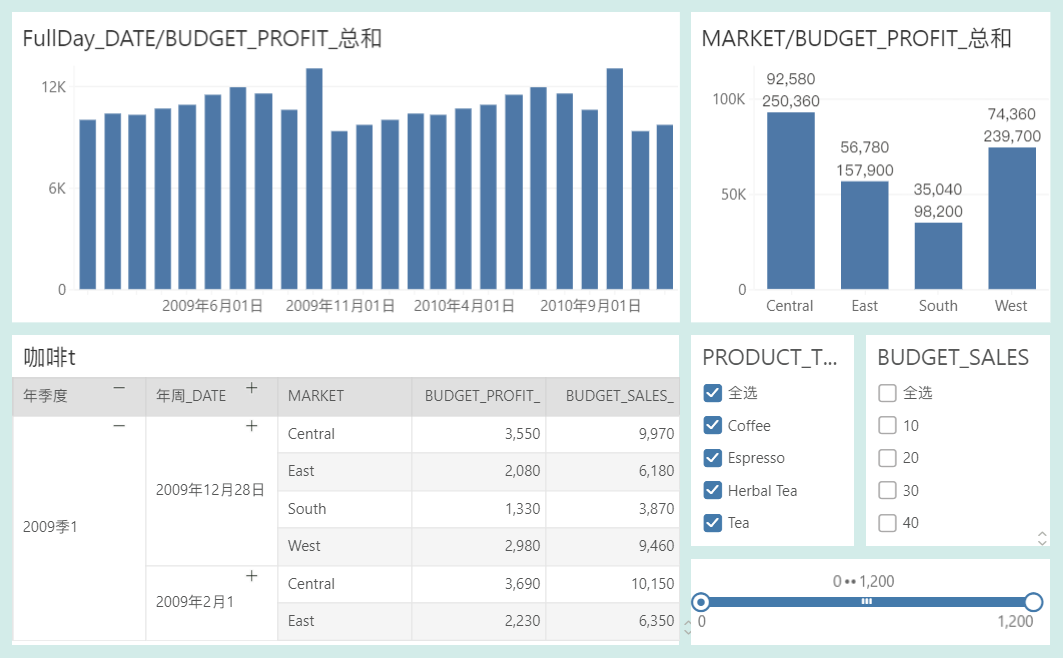
The measurement axis of the chart will carry out unit conversion according to the data situation; the time axis label will provide a reasonable default format definition according to the date level; the measurement format of the label will be displayed in the format of thousandths.
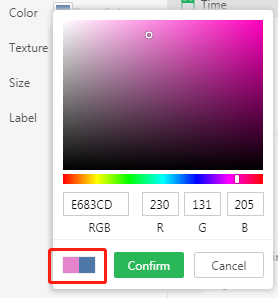
Add Color Preview to The Color Panel
The color palette supports preview to show the contrast of original/new color.
Optimized Dashboard Layout Multi-Component Settings
The dashboard layout supports setting common attributes for multiple components of the same type. Suitable for free layout and smart layout.
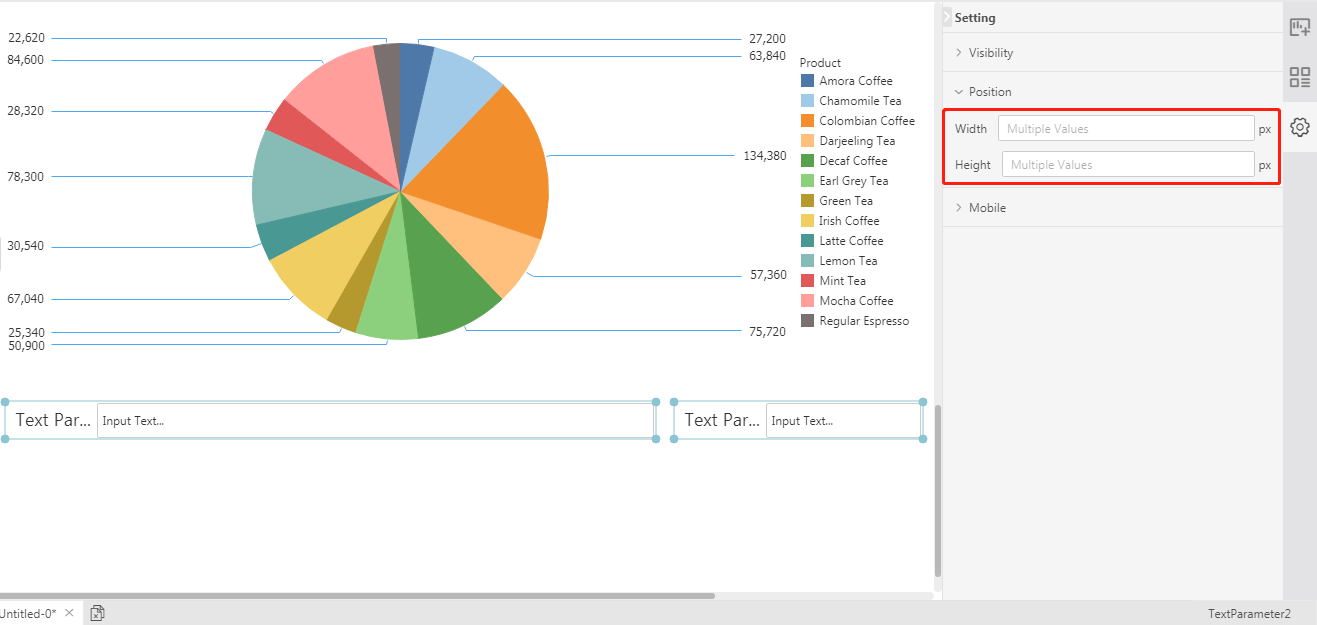
Multi-component Supports More Alignment Methods
The multi-component alignment setting adds a variety of alignment methods, horizontal distribution, vertical distribution, center alignment, and horizontal alignment, which optimizes ease of use. Suitable for free layout and smart layout.

Add the Gauge Style and Optimize Its Ease of Use
Two new styles have been added to the gauge. At the same time, the range display on these two meters will cover the range bar. Optimize the ease of range setting, better guide users to set, and increase the fixed range value, which is more friendly to the dynamic range.

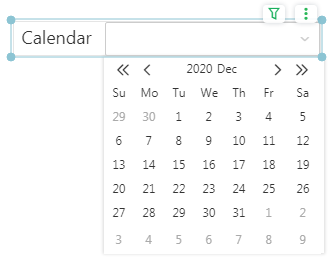
Parameter Component Date Style Optimization
Parameter date style optimization, as shown below:

Date Filter Component Style Optimization
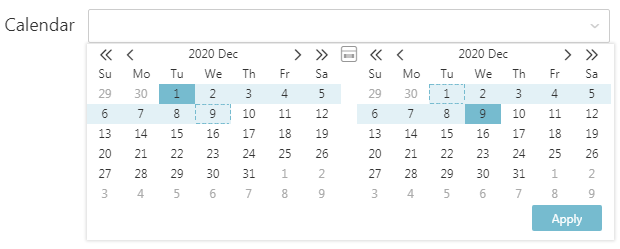
Optimized the drop-down style of the calendar component and optimized the operation interaction in each mode.
In the new version, the <Apply> button of the date filter component is easier to find and use, as shown below:
Optimized Component Color Settings
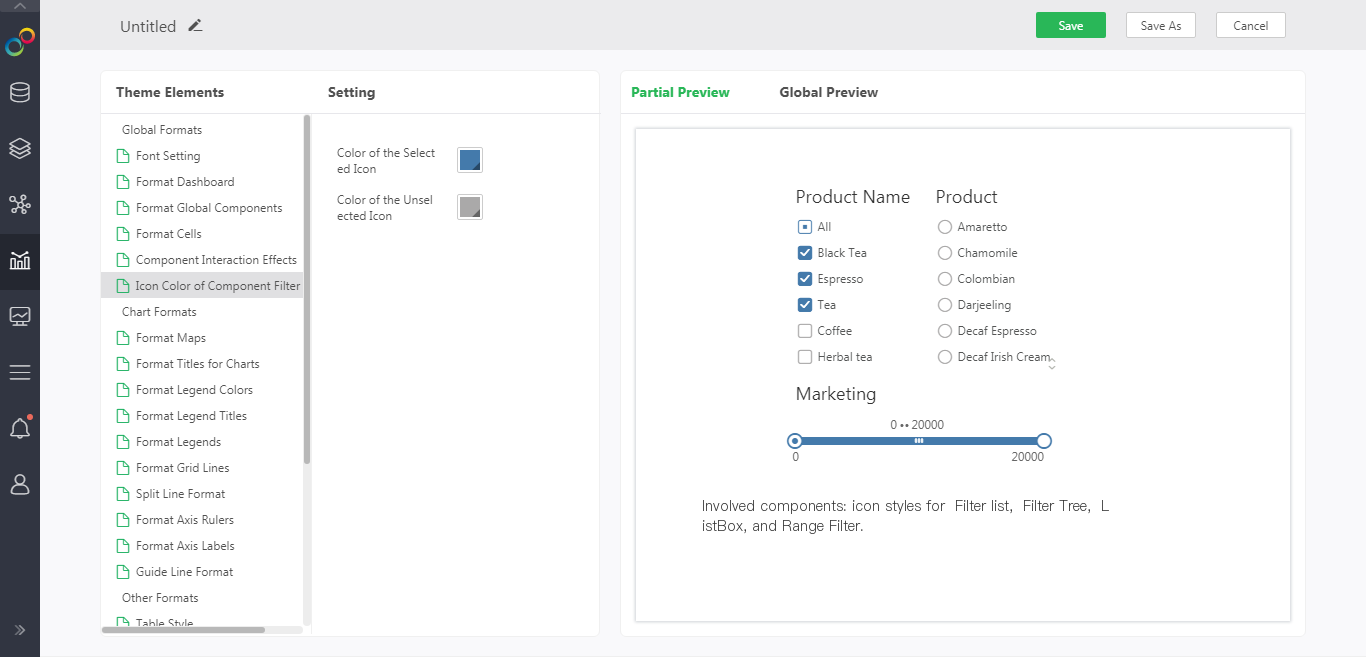
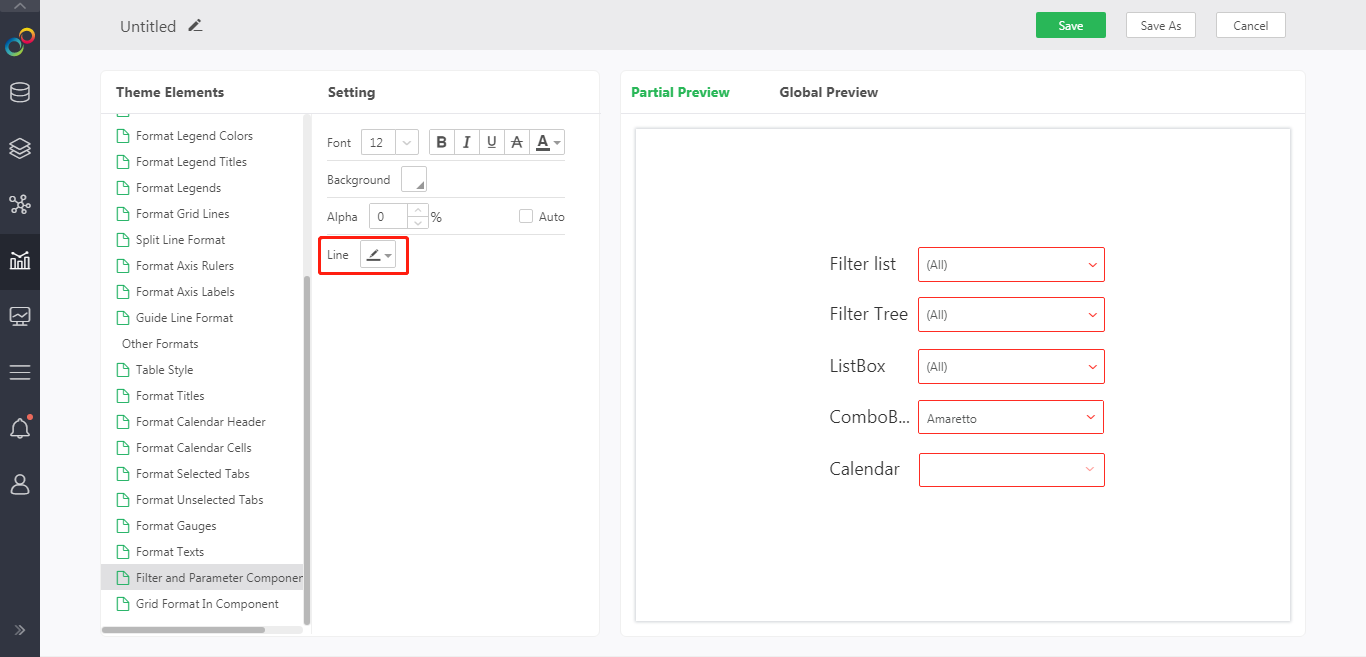
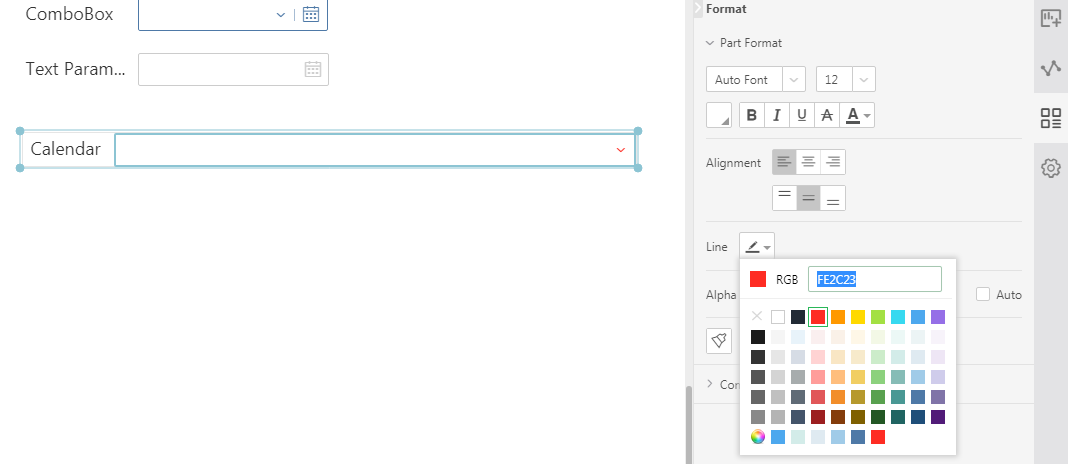
Filter/parameter/range component icon color can support custom theme settings. At the same time, the theme border color can be set for each drop-down component, and the border color can be defined by opening the partial format of the component. (Filter/parameter/drop-down parameter/drop-down calendar)
3. Data Form
Support More Data Source Types
On the basis of MySQL, the new version supports DB2, Oracle, SQLServer, PostgreSQL, Derby, Gbase8a, Hana, GaussDB100, GausDB200, and AnalyticDB.
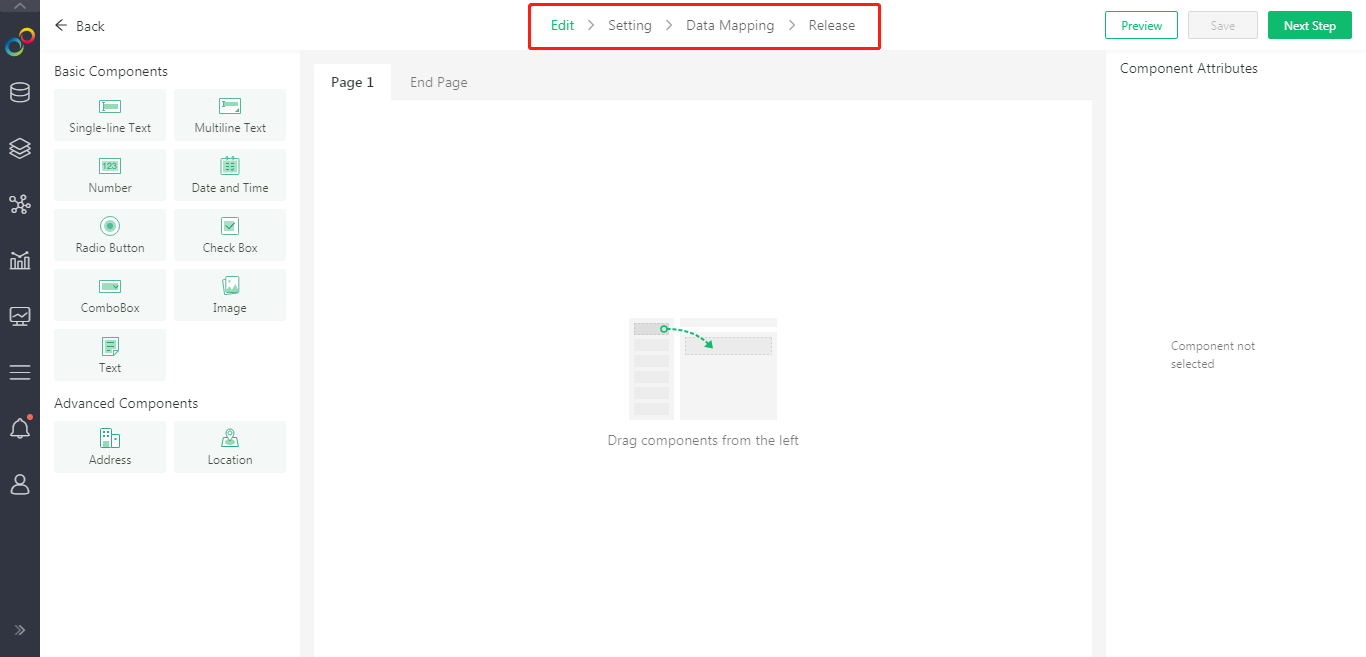
Add Navigation Bar when Editing Form
The navigation bar is added to the edit form page, which facilitates users to jump to any step and edit and enhance the user experience.
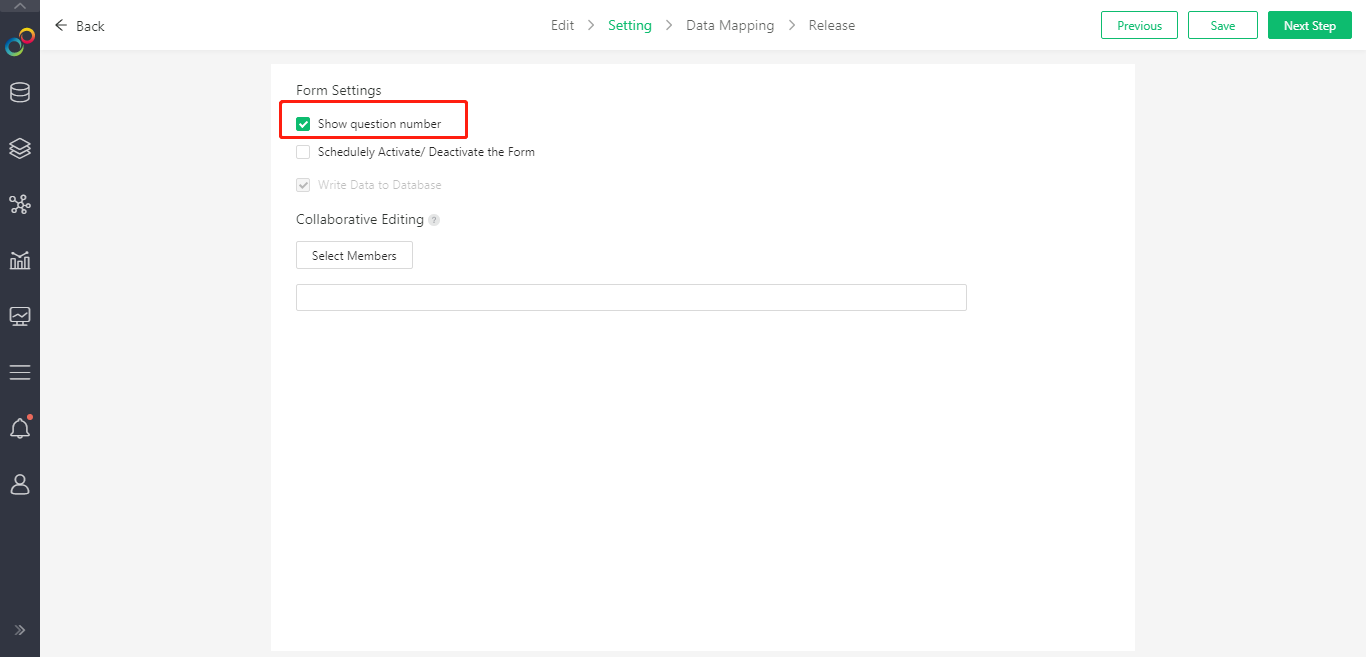
Support Configurable Form Title Number
The user can configure whether to display the title number in the form, and the default configuration is to display.
View the Number of Filled Forms
The number of completed forms can be checked, so that users can understand the status of form recycling.

4. Complex Form and Workflow
Add Freestyle Form Component to Support Users' Complex Form Filling Scenarios
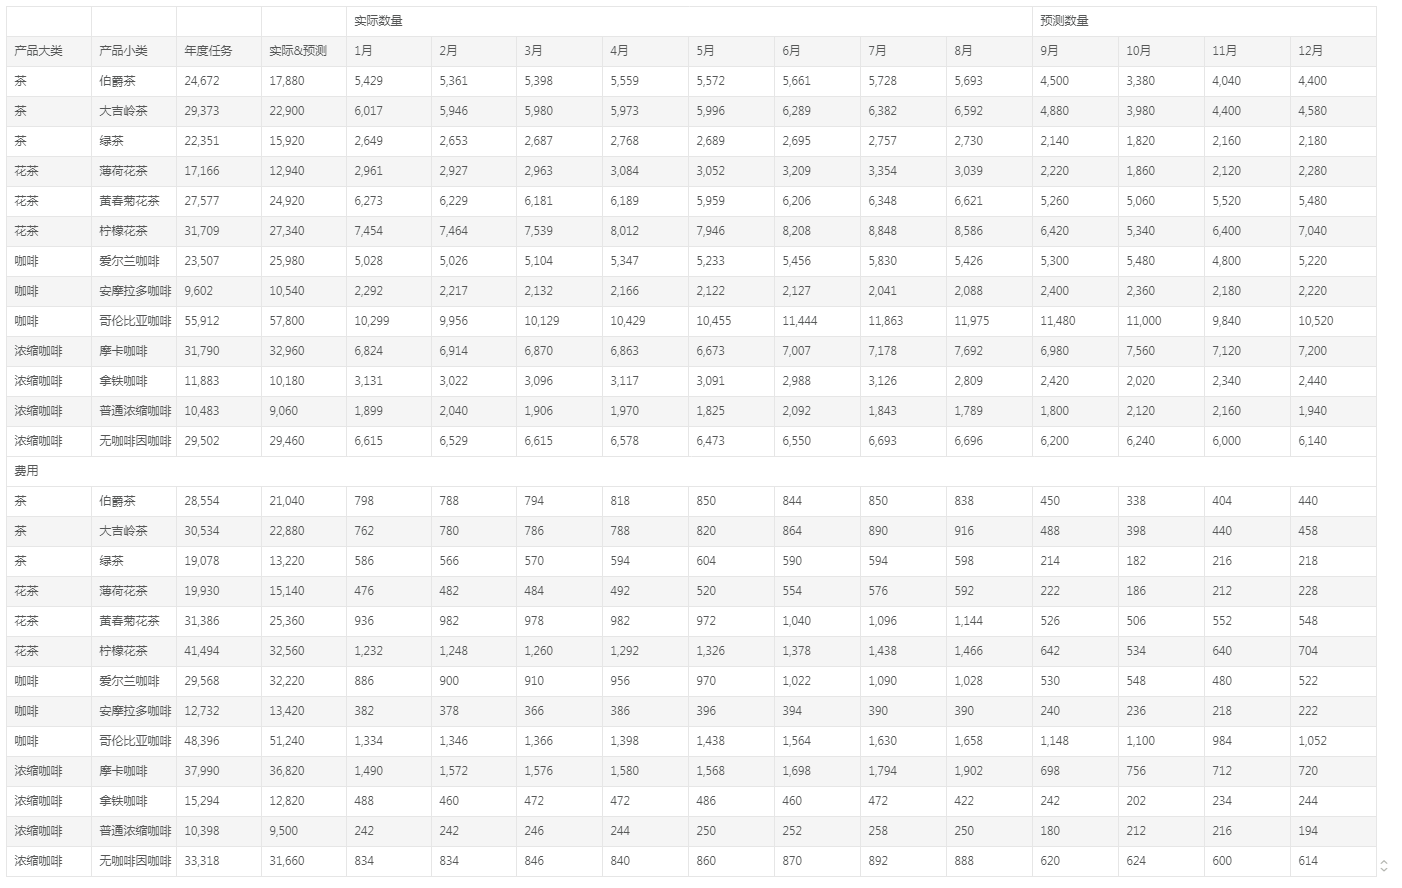
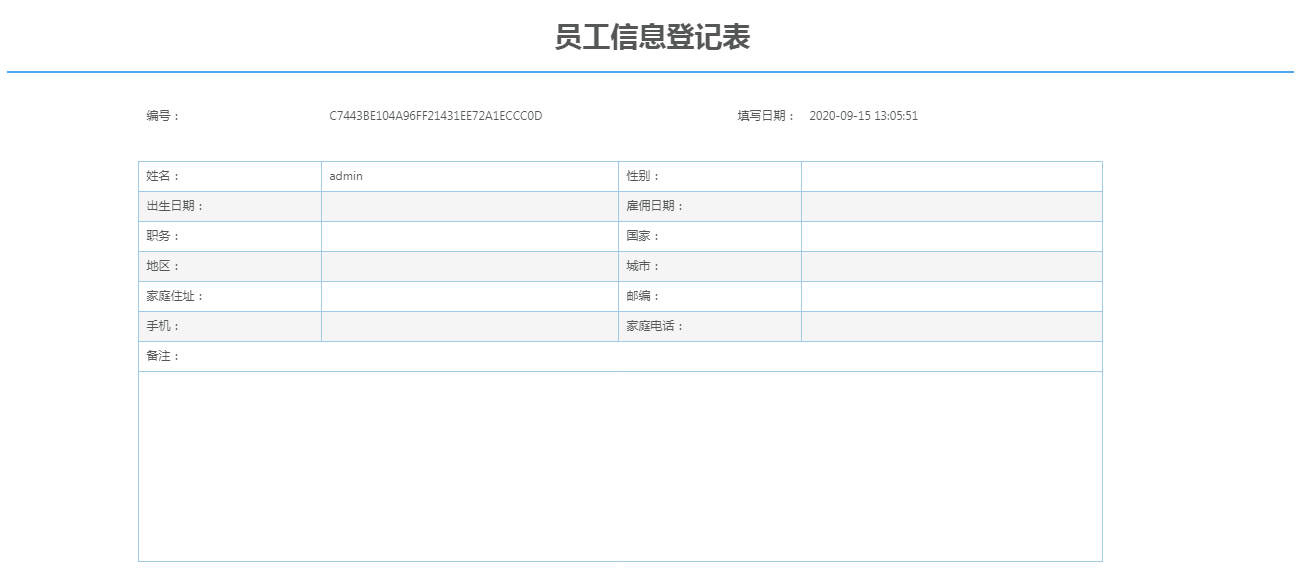
The 9.1 version adds a freestyle form component, which supports pivot-table filling and free form filling.
Note: To use the freestyle form component, a freestyle table license and a form license are required.
Examples of pivot styles:


Examples of free styles:
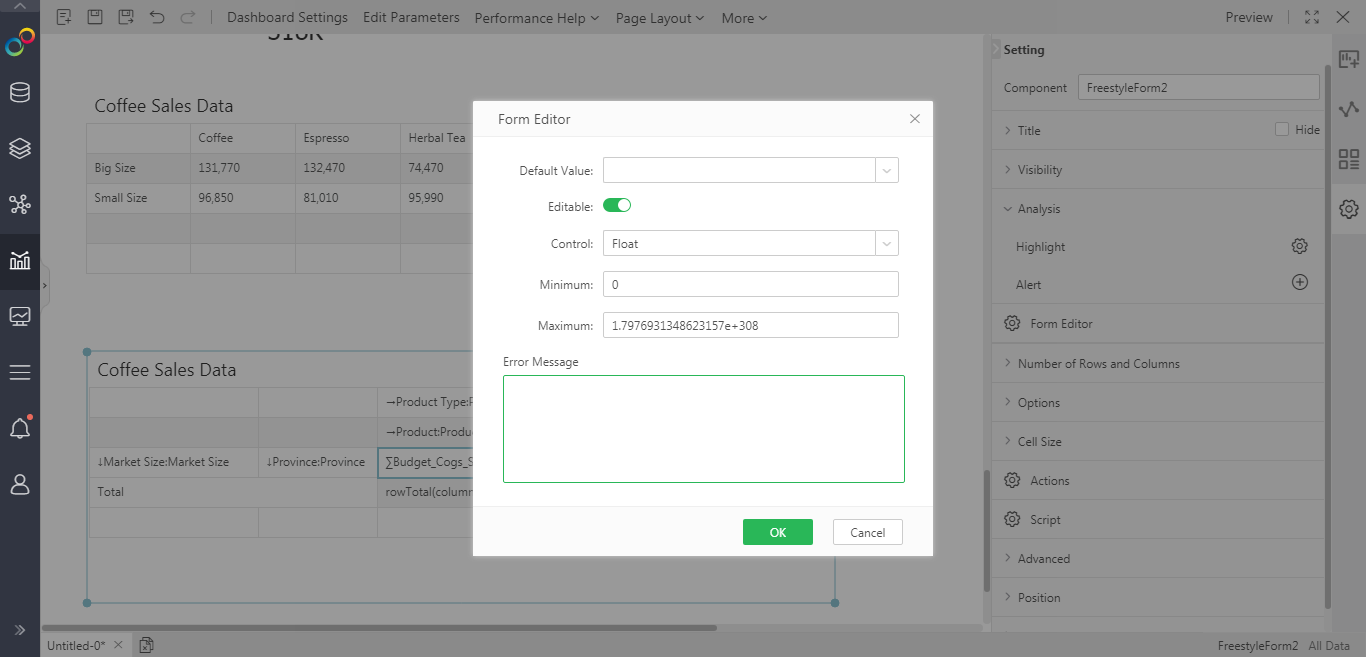
Freestyle form component supports an editor, and users can set the cell as a drop-down list, date, integer, floating point, etc. It also supports verification.
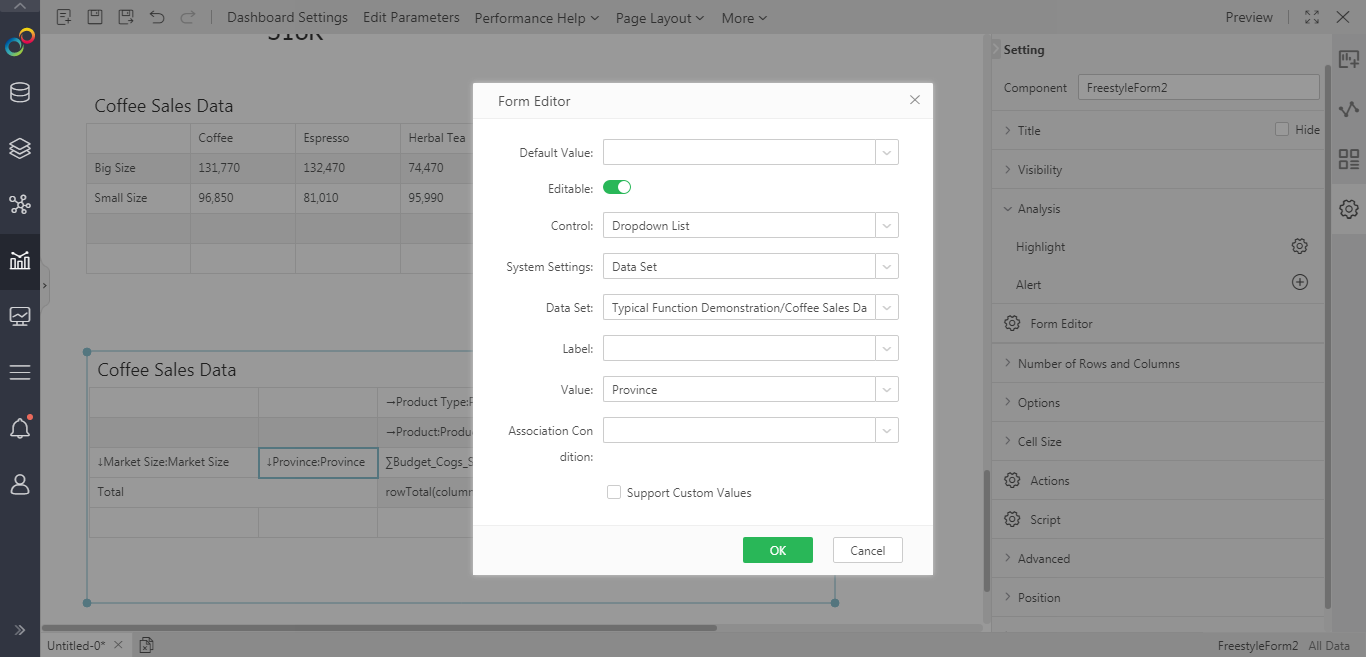
The freestyle form component supports dynamic calculation between cells. When the value of a cell is modified, the result value of the calculation between the cells will change synchronously.
Freestyle form supports update submission and smart submission.
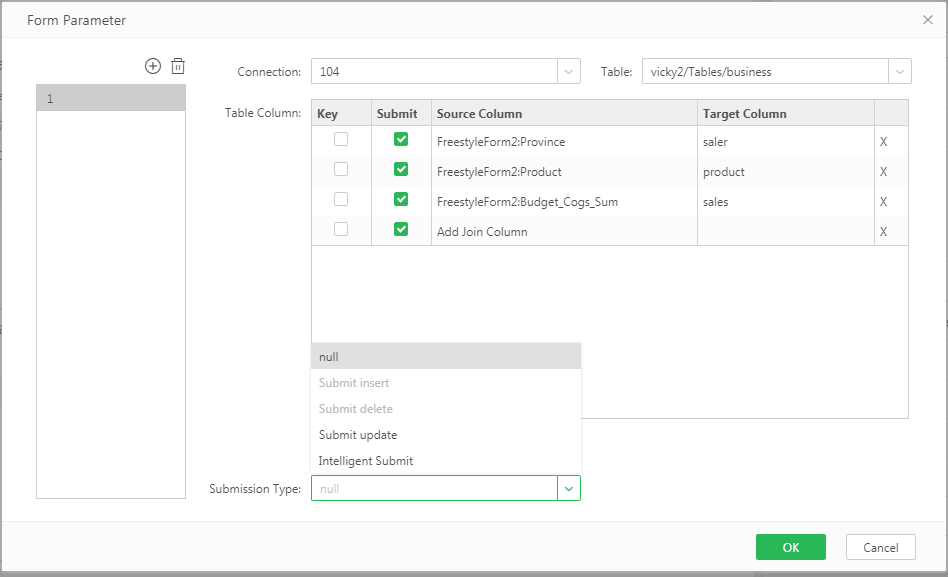
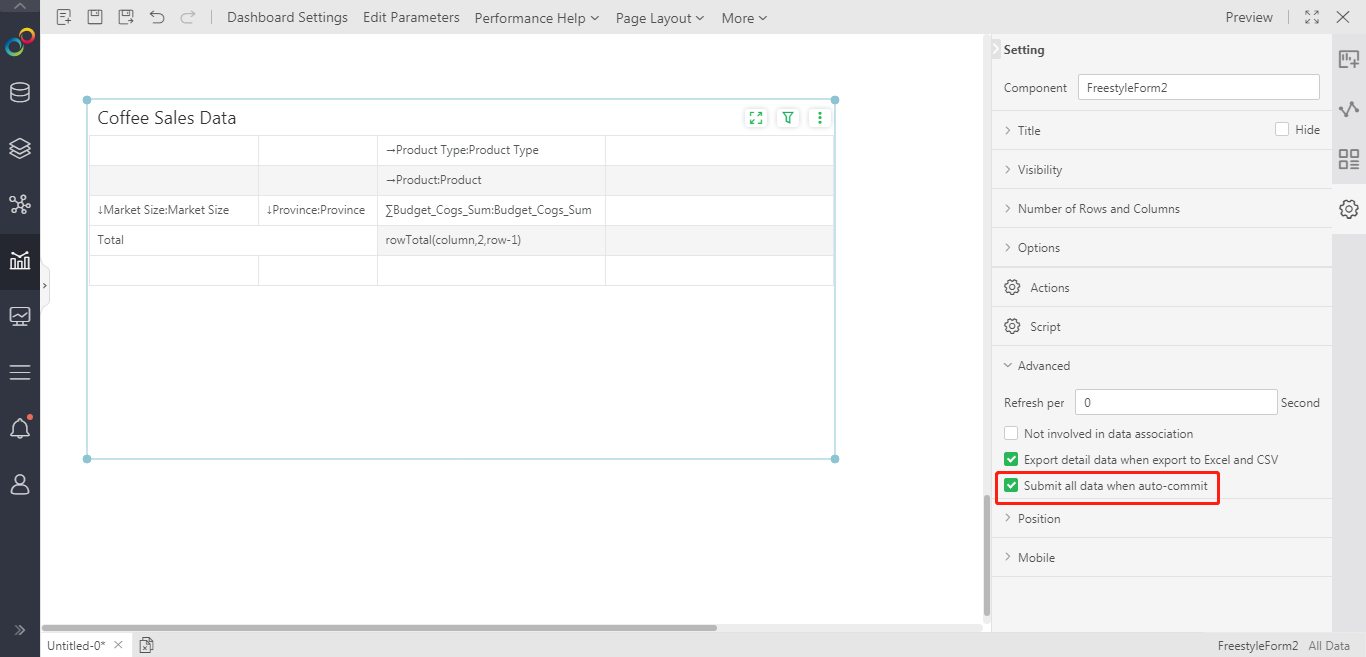
Since the freestyle form component can directly use blank cells for filling without binding data. These unedited and empty cells are not sure whether the user needs to import data to database. Therefore, the advanced attribute of the freestyle form component is "When filling data, submit all data". After checking, you can submit all (mapping relationships) data on the freestyle form component (applicable to smart submission).
Optimize Smart Submission
The 9.1 version optimizes the logic of smart submission in two points.
1. In the previous version, the form parameter component supports smart submission, but when the form parameter component is mixed with ordinary parameter components/system parameters, smart submission cannot be performed. In the new version, when the form components are mixed, smart submission is also supported, but the condition column can only be on the form parameter component or the freestyle form component.
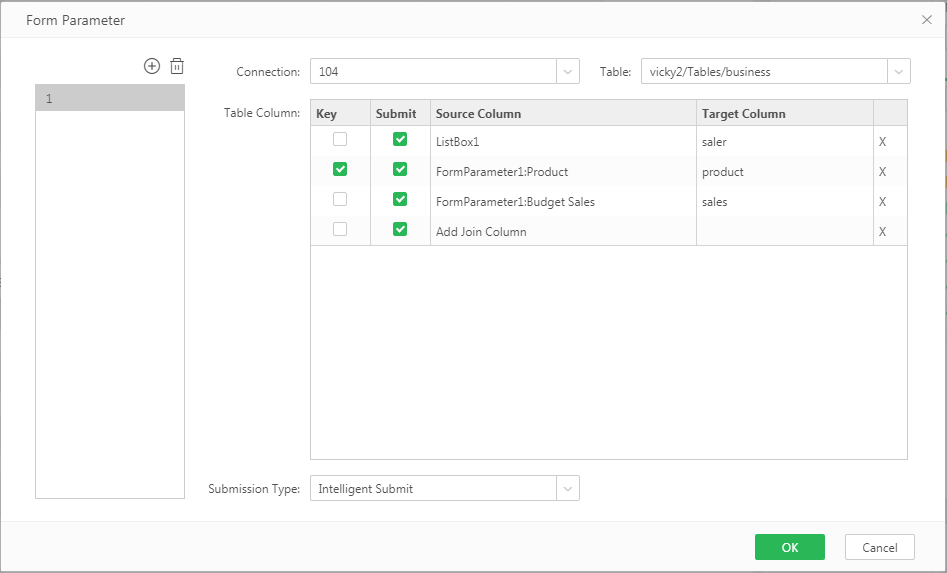
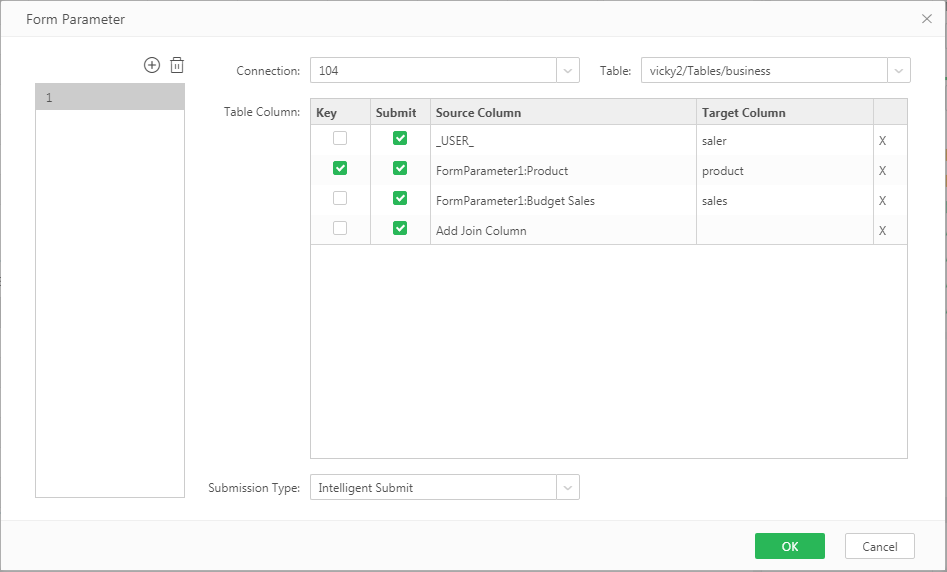
2. Previously, smart submission will add new rows for data addition, update rows for data updates, and delete rows for data deletion. After optimization, smart submission will first add data to the new row. If the addition fails (database primary key conflict), we try to update the same row data in database. For the modified data, first update the data in the database. If the where condition is found to not exist, the row of data will be inserted into the database as new data. If both addition and modification fail, the error message of the database will be returned.
Optimized "When uploading Excel, delete all data"
In the previous version, regardless of whether this attribute is checked or not, as long as excel is uploaded, all data on the form parameter will be deleted, and the data in excel will be inserted into the form parameter component.

In the new version, this attribute has been optimized. If this property is checked, the effect is the same as before, and the data on the form parameters will be deleted first, and then the data in excel will be inserted. If you do not check this attribute, the data in excel and the data on the form parameters will be used as Union or Join (Join for conditional columns and Union for unconditional columns). Not checked by default.
Take the following excel and form parameter component as an example:


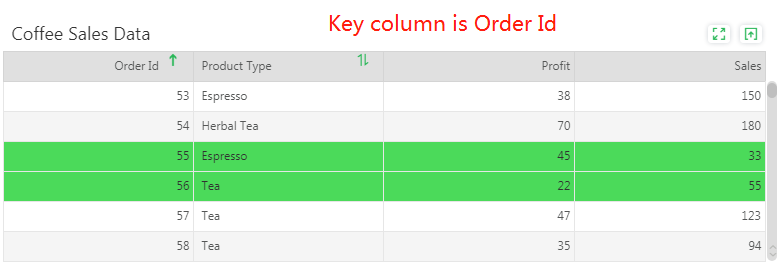
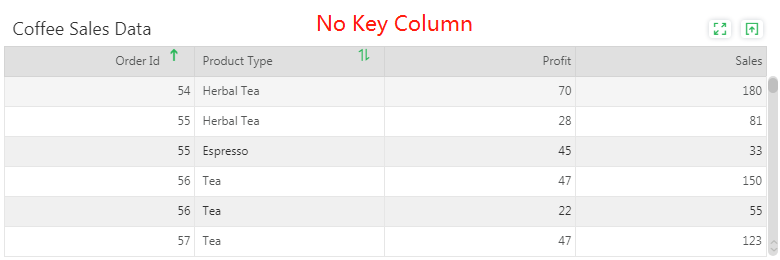
Note:
1) When users upload excel, if there is data in the form parameter but not in excel and want to delete it in the database, you need to check this attribute. If you do not want to delete it in the database, please do not check this attribute.
2) The freestyle form component does not support uploading excel during filling.
Support Common Reporting Related Operations Through Button Components
In the past, when users needed to add or delete rows on the form parameter component, they could only use the right-click menu. When you need to import excel for reporting, you can only use the floating icon at the top right of the form parameter component to operate.
In view of the fact that these two types of operations are very common, but the interactions are inconvenient, these types of button component have been added to make the user's reporting operation more convenient.
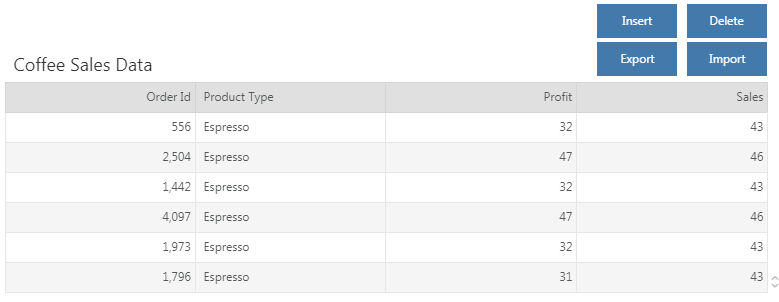
Note:
(1) The mobile terminal does not currently support exporting Excel, importing Excel, and custom pop-up buttons.
(2) When the user does not have the authority for this operation, click the button and the related operation cannot be performed.
Added A Pop-up Window for Reporting
There are customer scenarios. Instead of directly filling in new data in the dashboard, users want to fill in the data and submit it to the database in a new pop-up window. And when the pop-up window is closed, the data on the component or dashboard is automatically refreshed.
To achieve this kind of scenario, we support clicking the button to pop up a custom window. This pop-up window can be a dashboard in the system or a URL address. After the user sets the target address, he can set whether to refresh the data automatically when the pop-up window is closed.
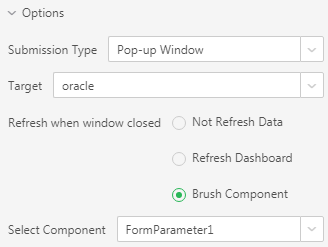
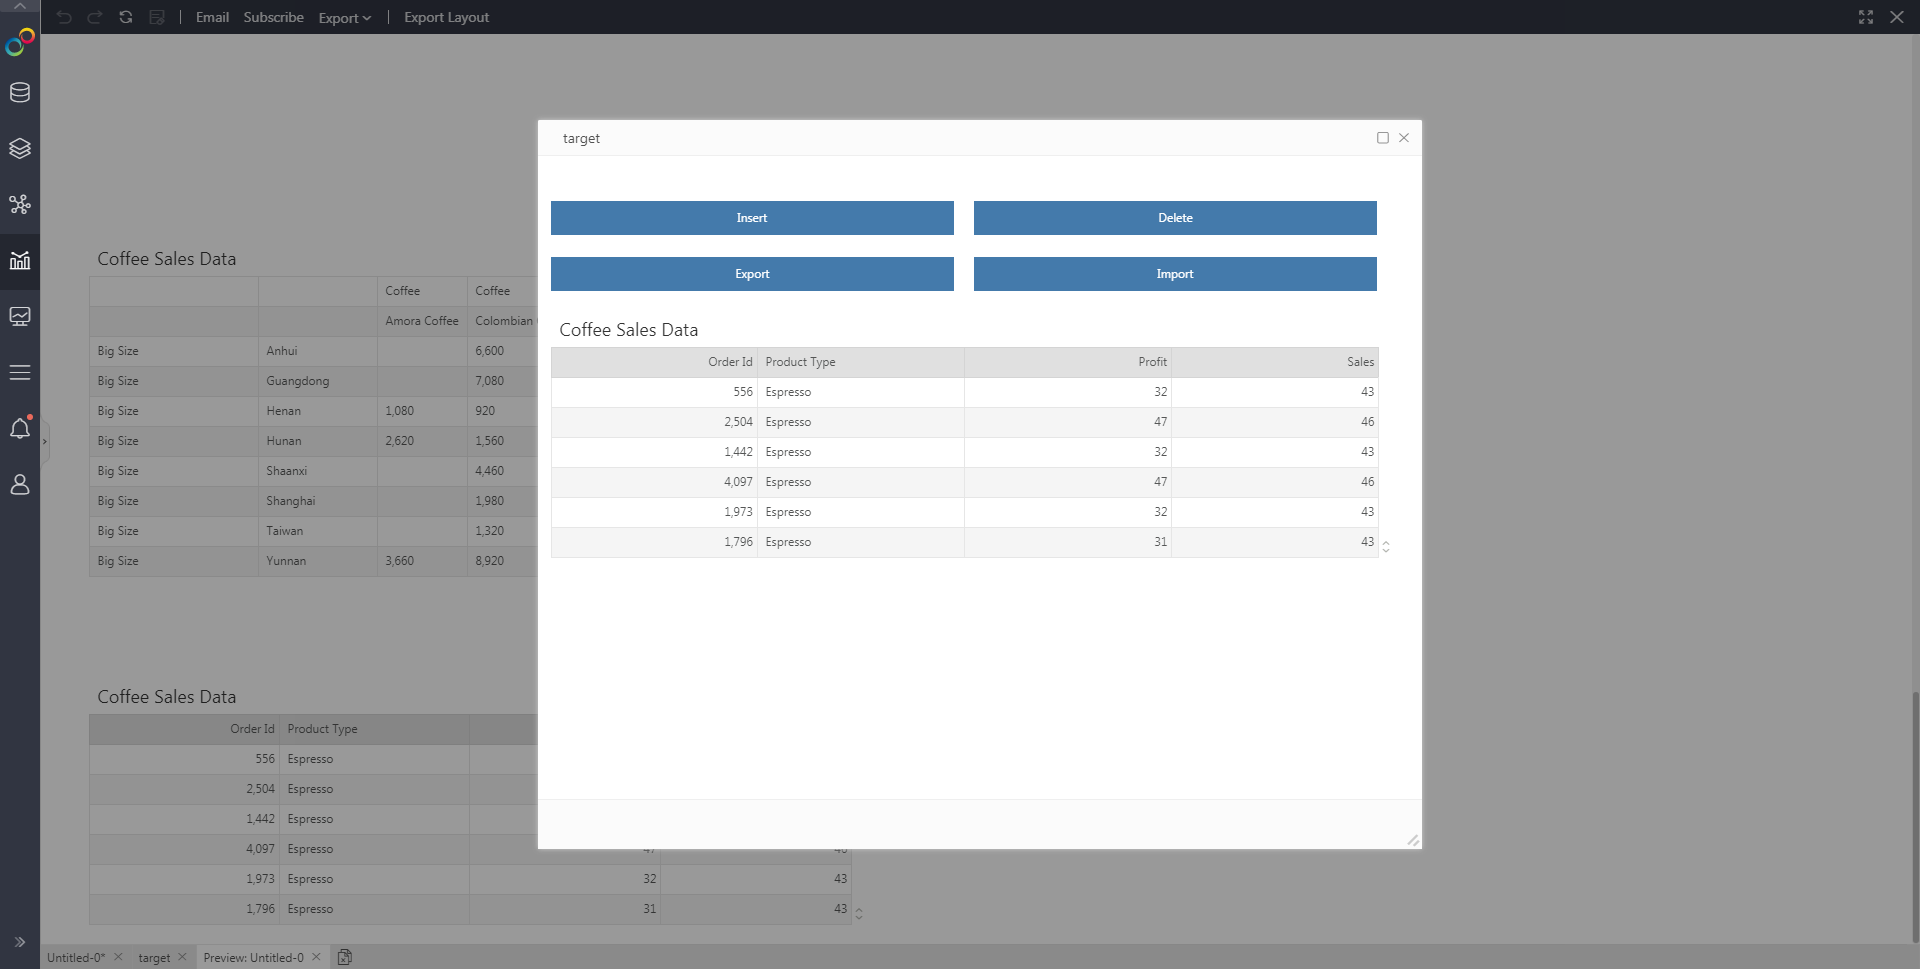
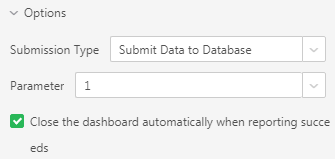
In order to make this scene easier to use, you can set "The window automatically close when the reporting succeeded". As long as the data is successfully submitted by the submit button , the pop-up window will automatically close.
Upload Excel Support Custom Starting Line
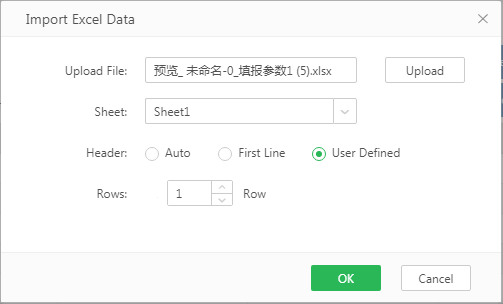
When uploading excel to the form parameter component, you can not only select automatic or the first line as the starting line, but also other lines as the starting line.
You can enter any positive integer (within the range of the total number of excel rows), and the system will use the row you selected as the header row to match the column of the form parameter component.
When Uploading Excel, Automatically Recognize the Text Format of the Column
When the customer fills in the form, he may export the form parameter component to excel, fills in the data in excel, and then uploads it. If the field name of the form parameter has been set in text format, then after exporting and then uploading, the component field will not match the Excel column. That's because the previous matching rules only match the column name of excel with the column name or column alias of the component field, and will not match the text format of the component field. After adding logic, even if the field is set to text format, it can still be matched with the excel column.
Note: The priority of matching is text format>column alias>column name.
Optimize Data Verification: When Submitting Data, the Modified Data in the Form Will Be Verified Again
The data verification of Yonghong is instant verification, and verification will be performed when the cell is finished editing. But when users fill in data by uploading excel, the data in excel may not meet the requirements but there is no way to trigger instant verification. Therefore, the logic of submitting verification is added in the new version. When submitting data, the system will verify the modified state and newly added state data. If any cell fails the verification, a verification error will be prompted.
Optimized for Ease of Use
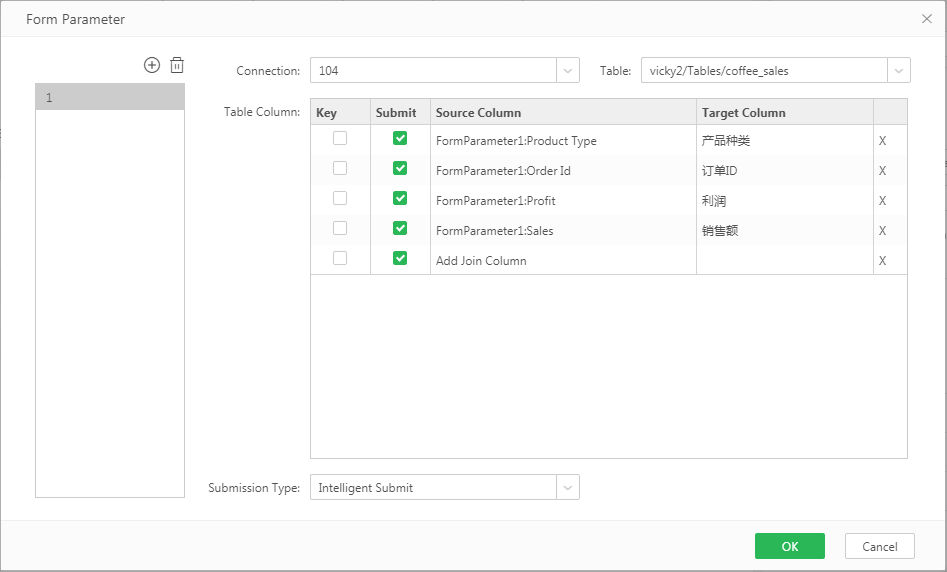
1. Optimization of the form parameter dialog: Optimize the style of the pop-up window to leave a larger area for the source field and the target field, which is convenient for matching.
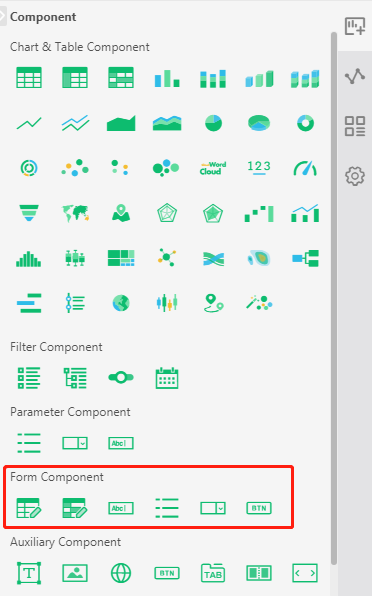
2. In Make Dashboard module, the "components" pane on the right will classify all the reporting components together, which is convenient for users to make reporting dashboards. When there is no reporting permission, the reporting component category will be hidden.
3. Interactive optimization of reporting: click in the cell to edit the content.

5. Advanced Analytics
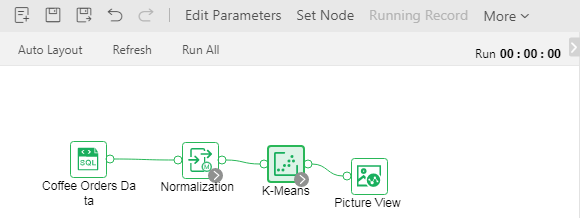
Experiment Supports Undo and Redo
In the new version, experimental operations can support undo and redo. Undo and redo are added next to the "Save as" icon in the top menu bar. All operations except for running experiments can be undone and redo.
Support Cut, Copy, Cut and Connect, Delete and Connect Nodes
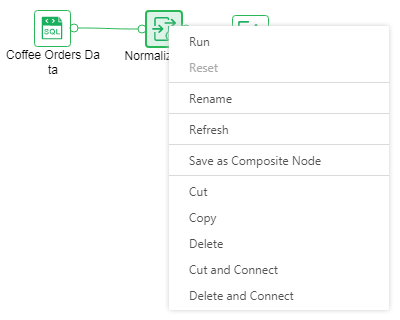
Add cut, copy, cut and connect, delete and connect in node operations.
All nodes support cut, copy and paste, and can be pasted across experiments. Select multiple nodes, you can cut, copy and paste at the same time.
When there are more than three nodes connected and the connection is unique, select the node that is not on the end, right-click on the node, and the menu will display "cut and connect" or "delete and connect", and the nodes on both sides of this node will be automatically connected after selection .

Support Multi-node Save
In the operation list on the left, a new combined node folder is added, and users can customize the save node. Select single or multiple nodes, and select Save as Combined Node in the right-click menu. After selecting the saved path, the saved node will be displayed in the combined node folder. The user can drag this node into the canvas for use.
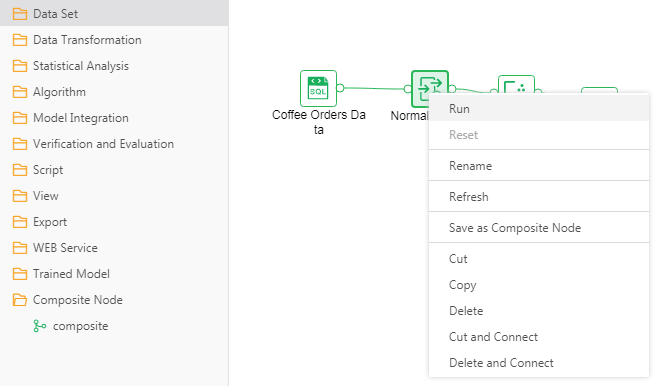
The nodes saved by users can only be used by themselves and the admin by default. If other users need to use them, they can be given read or write permissions in the permissions. Users with read permission can only see and use the saved combined node, but cannot modify, rename, delete or move. users with write permission can operate all.

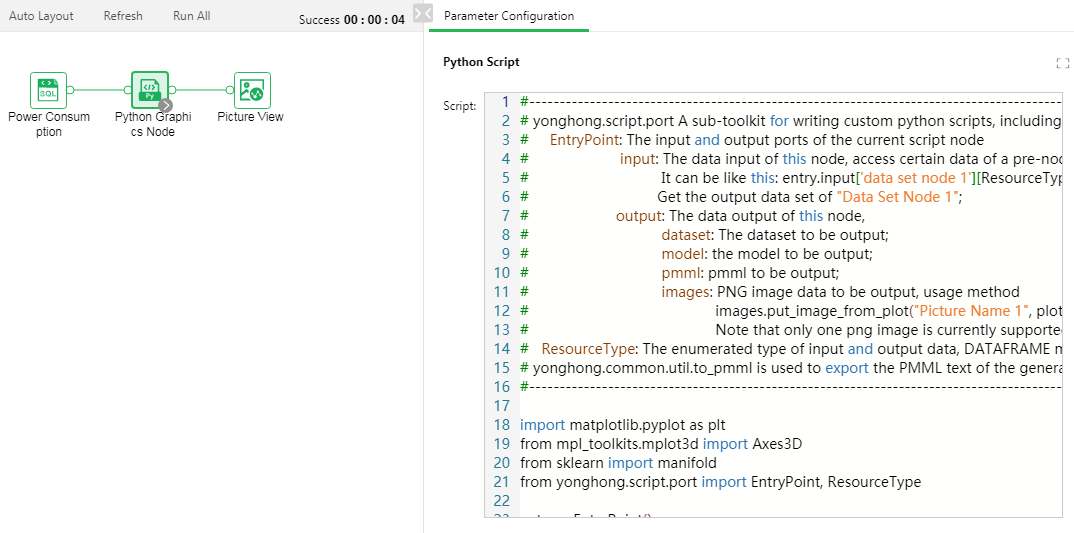
Python Script Node Supports Multiple Data Access
One Python script node can connect to multiple data set nodes, which need to be written in the script.
Support Real-time Log When the Experiment Is Running
When running an experiment, a real-time log panel will pop up at the bottom of the canvas to display the running status of the experiment, so that users can understand the running progress, errors, etc., and can also download logs.
Make Dashboard Module Support the Application of Experiments
When making a dashboard, you can process the data in the data set by selecting the specified experimental node, and the new data generated can be dragged into the component for use.
First, you need to create an experiment in the advanced analysis and run it successfully, and then choose the node. Select the node that can be used in Make Dashboard module from the available nodes. You can select multiple nodes. It does not support experiments where a single node is connected to multiple data sets and REST experiment.
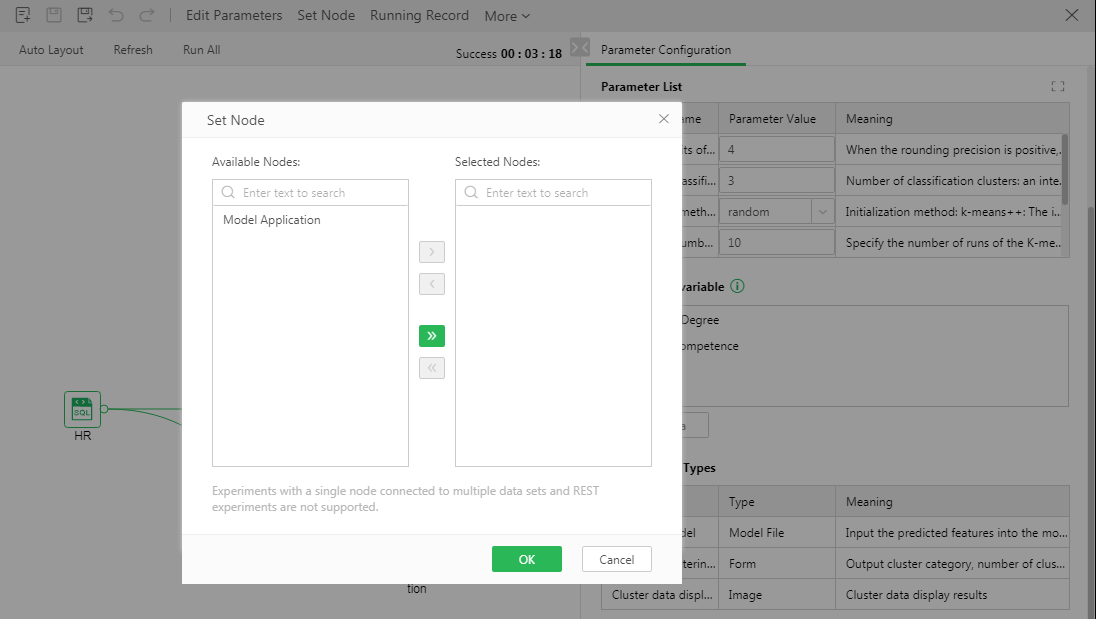
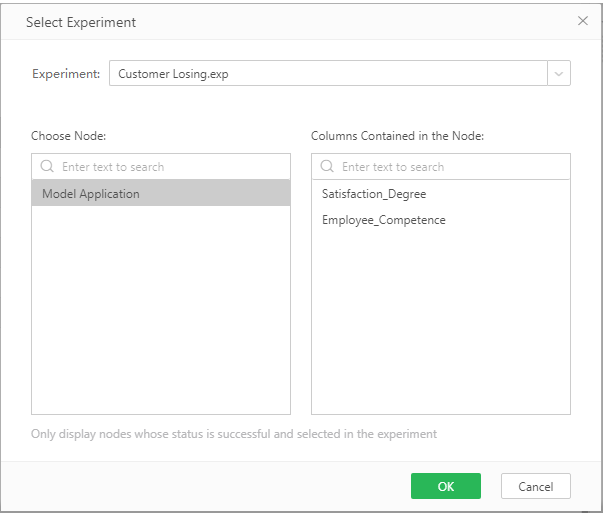
Add an application experiment in Make Dashboard module data-more menu, select Apply Experiment, you can select an experiment and node, after selecting the node, the fields that need to be included in this node will be listed on the right side, which is convenient for users to verify the selected fields Whether meets the experimental requirements. If not, it will not be applied. After running successfully, the experimental fields will show in the data list , and the fields can be deleted.
"Specify Trained Model" is no longer supported in the Make Dashboard-Data-More menu.
Ease of Use Optimization
1. When the node is dragged into the canvas, the node icon will be displayed. If it can be connected to the node in the canvas, the connecting line will be displayed.
2. Remove the filter data tab and change to the filter icon.
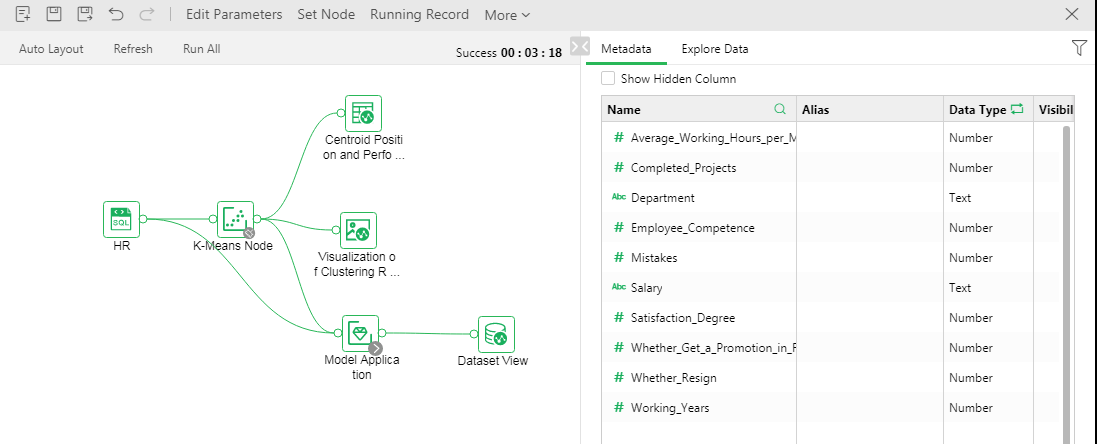
3. When the mouse is placed on the connection line, the delete icon is displayed, and you can click delete directly.
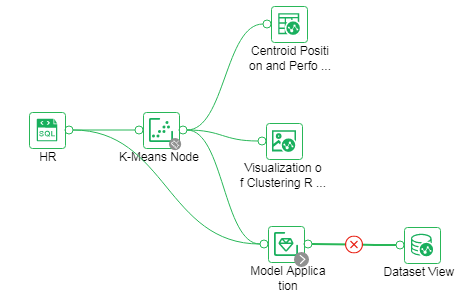
4. The connection line supports automatic disconnection. When two nodes 1 and 2 are already connected, connect a new node 3 to any one of the two nodes, such as 1, if it can be connected and is mutually exclusive with another node 2, the connection of 2 will be automatically disconnected, and the nodes 1 and 3 will be connected.
5. Create a new experiment, and the left tab menu will automatically switch from experiment to operation.
6. Remove the experiment folder from the experiment menu on the left, and the user can directly select the saved experiment without expanding the experiment folder first.
7. Add experimental settings in More, you can set whether to save the experimental results, save by default. If you choose not to save, open the experiment again and the experiment results will be cleared.
8. Add a picture enlargement icon on the experiment result display page to enlarge the picture.
9. The plug-in operator supports internationalization.
5. Enterprise Management
Desktop Supports Adding Row/Column Filtering
The new version further improves the analysis scenarios of the desktop version, supports adding row-level and column-level permissions to the data set on the desktop, and makes dashboards based on this. After uploading the dashboard and data set to the server, users on the server can only view the data within the scope of authority.
To add row/column permissions, users of the desktop version need to connect to the server first, and the system will verify the identity of the server user at this time. If the connection is an admin or group_admin user, the built-in parameters can be selected in the row filter, and the access to edit column permission will be displayed on the metadata. When adding column permissions, only the list of users within the management scope will be pulled.
When the server is disconnected, the added filter conditions will not be executed on the desktop. When connected to the server, the filter conditions will be executed according to the user attributes of the server.
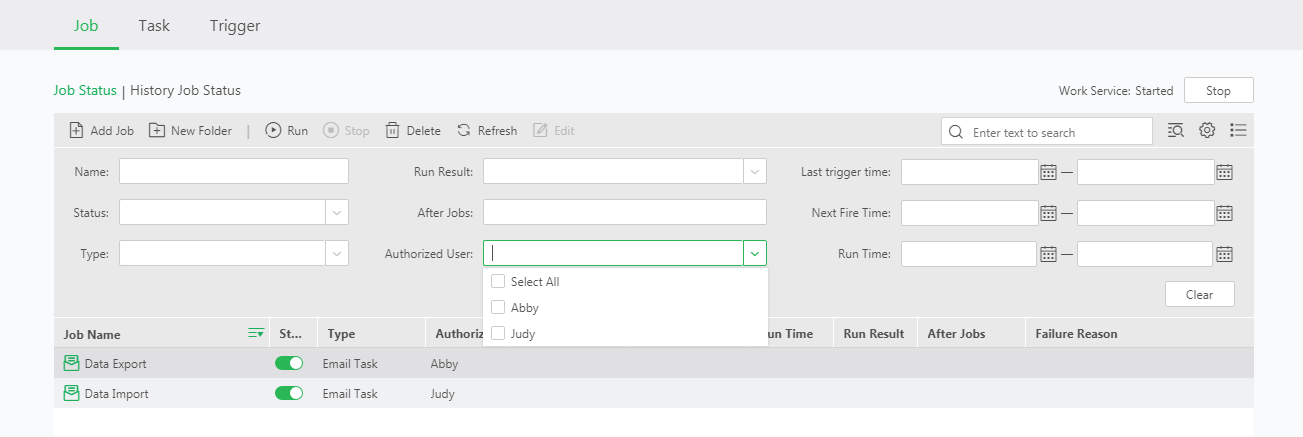
Added Authorized User Column in Job List
The administrator can authorize the job to different users, and the user with the job permission can edit and run it. When the number of jobs is large, the administrator cannot visually check who the authorized users of the job are. Therefore, the new version adds an authorized user column to the job list, and supports filtering and searching of authorized users to facilitate the administrator to manage the job.
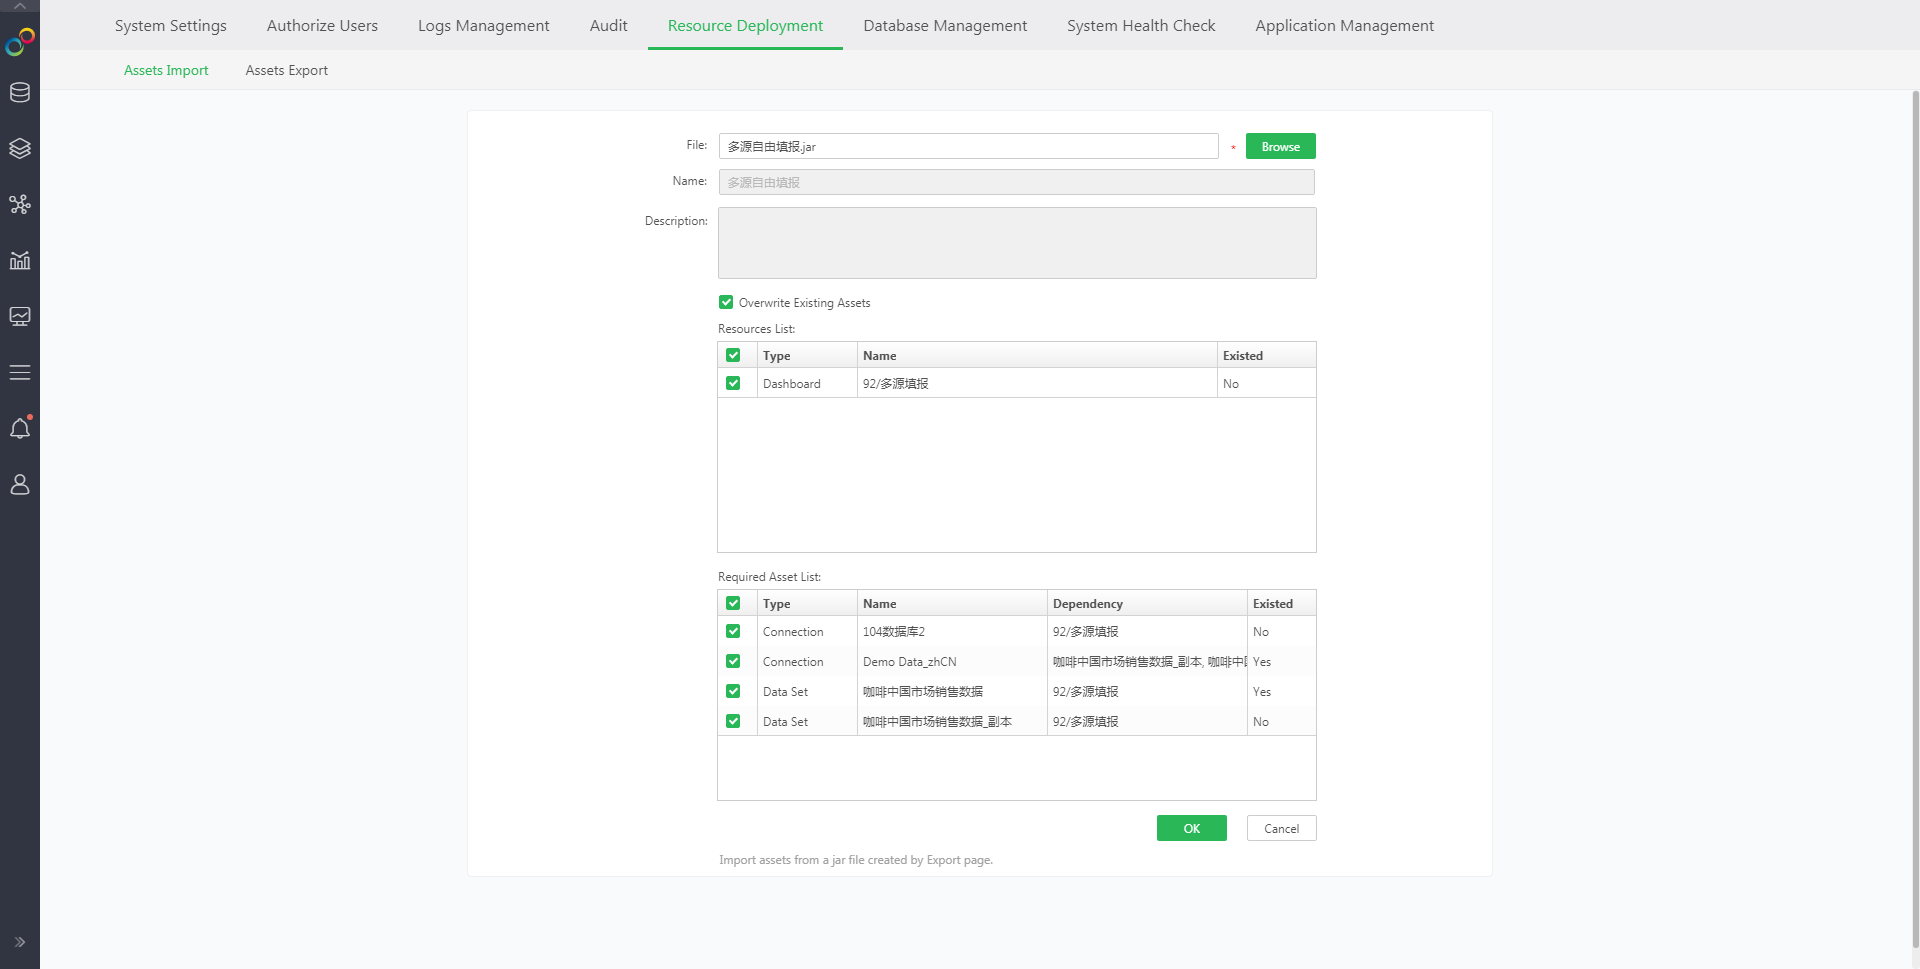
Resource Import Supports Selecting Dependent Resources
When importing the resource jar, you can choose to import some of the dependent resources.
Optimized the Dashboard "Operational Resource Information Monitoring Statistics" of the Monitoring System
The new version optimizes the display logic of historical operating resources in the monitoring system "Operating Resource Information Monitoring Statistics", which will be composed of two parts: the main table and the sub-table. For example, when a dashboard is opened, a row of data will be generated in the main table to record the opening time of the first screen of the dashboard. Click the hyperlink on the dashboard name to view the running time of the data set bound to the each component, the number of data rows, and the memory occupied by the dashboard.

Desktop Supports Mac System
Desktop supports mac system installation.
Information Refinement of the Table "User Operation Information Monitoring Statistics"
The "User Operation Information Monitoring Statistics" dashboard of the monitoring system has supplemented the new user operations in recent versions, such as batch import and export of users, role copy and other operations.
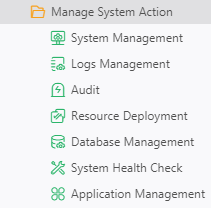
Split and Refine Operation Authority of Management System
In order to meet more detailed management scenarios, the new version finely splits the permissions of the management system. Functional modules such as system settings, monitoring and alert, log management, and database management in the management system all support independent authorization. If the user has the management system authority in the old version, he will automatically have all the management system operation authority after upgrading to the new version.
API Requirements
Several new APIs:
•Set resources and operation permissions in batches for users/groups/roles (overwrite)
•Set up resources and operation permissions in batches for users/groups/roles (not overwrite)
•Add users/groups to roles in batches (overwrite)
•Add users/groups to roles in batches (not overwrite)
•Set user/group/role permissions for resources in batches (overwrite)
•Set user/group/role permissions for resources in batches (not overwrite)
•Query data set column filter settings
•Add column filter to the specified field of the data set (overwrite)
•Add column filter to the specified field of the data set (not overwrite)
•Dashboard sharing
•Delete the permissions of the specified user/group/role
•Replace the data set
•Copy and paste dashboards, data sets, data sources
•New data source supplement type (support all data source types)
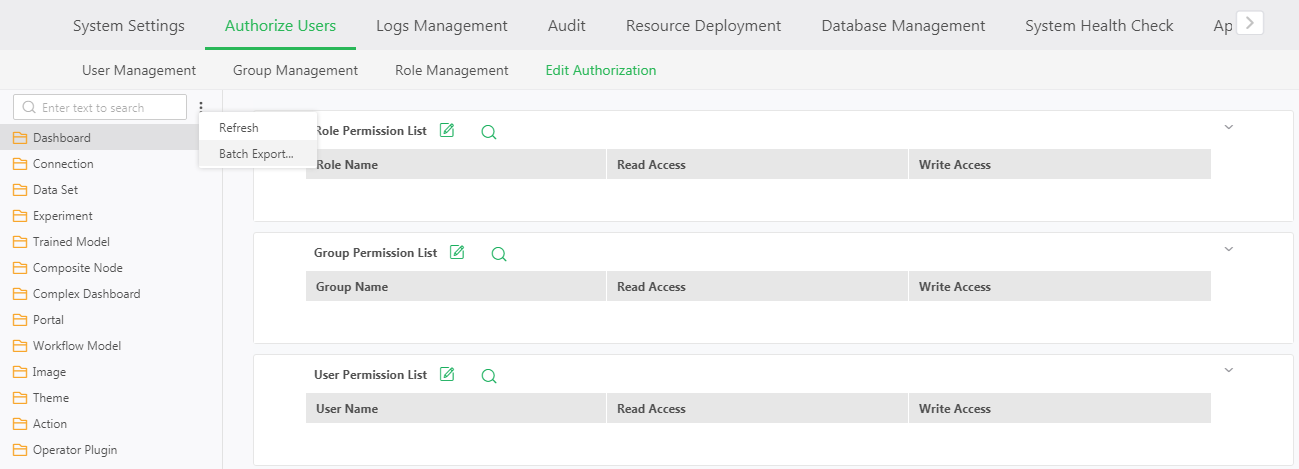
Export Permission Data
It is not possible to directly view the permission settings of all resources in the system. In the scenario of permission audit, users need to manually switch resource to view its authority, which is more cumbersome. Therefore, the new version supports the permission export function. The exported excel file summarizes the authority data of all system resources and operations, and the user can intuitively view which users, groups and roles have authority to the resource.
User Attributes Add Creation Time, Modification Time, etc.
User attributes (underlying user data) have newly added 4 fields: user creator, user creation time, user update person, and user update time, which can be obtained through api. (Api for obtaining user node information)
License Server
The official license of the product needs to be bound to the mac address, and the mac address of some enterprises' servers may change. When the mac address changes, the original license will become invalid, so the new version supports the license server verification mode.
When deploying the environment, you need to install a machine as a license server. This machine needs to be started all the time. It is not used as an access node and is only used for license verification. When installing other BI nodes, you need to configure the url of the license server and apply for the license with the mac of the license server. After the deployment is complete, the BI node will verify the license of the BI node with the Mac address of the license server.
If the connection between the BI node and the license server is broken, a message will be pushed to the BI node, and the license of the BI node can continue to be used for 7 days. If the license server still cannot be connected after 7 days, the BI node will be deemed to use an illegal license and thus cannot be accessed.
System Startup Defaults to File Permission Management System
The system startup defaults to the file authority management system, and the default password of the admin user is still g5.
7. Big Data
Install ZooKeeper
If you want to install and use vooltdb in the new version, you can directly install the built-in ZooKeeper in the product. Users need to add an odd number of nodes at once and install them all. After successful installation, adding, editing, and deleting nodes is not supported. Only uninstall and reinstall.
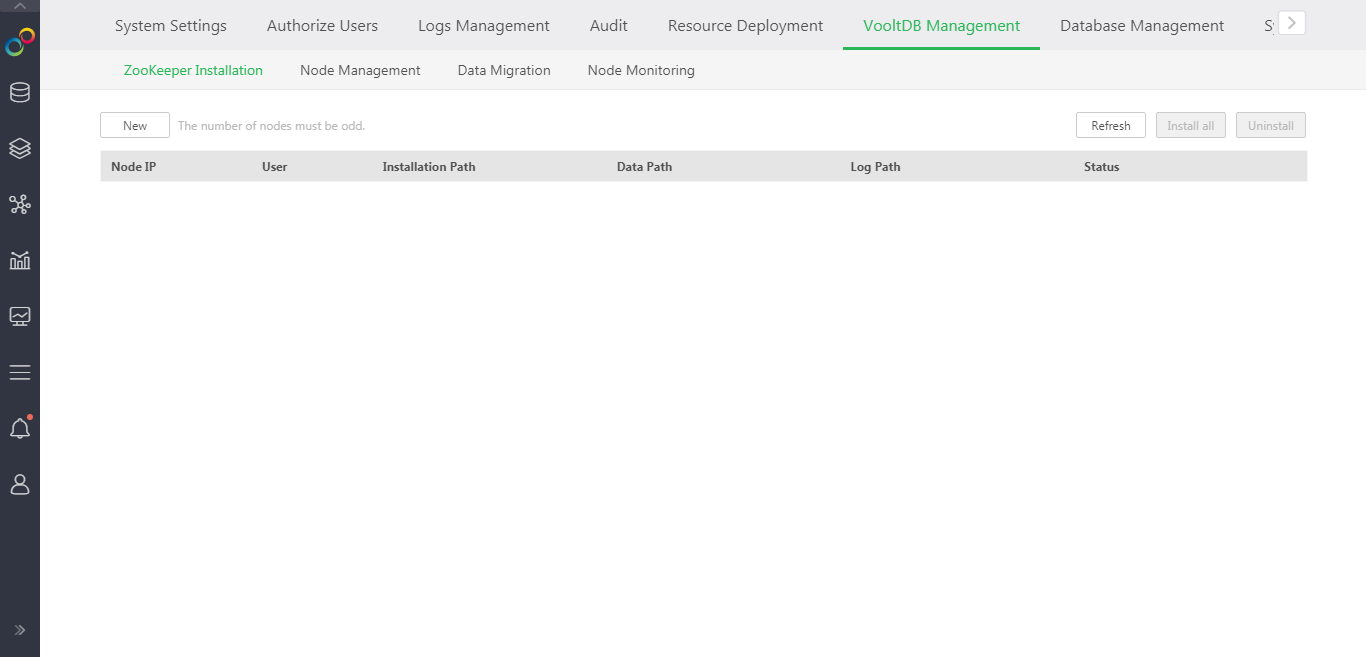
After ZooKeeper is successfully installed, you can directly obtain the ZooKeeper connection address.

If users do not use the ZooKeeper integrated with the product, they can directly configure the installed connection address.
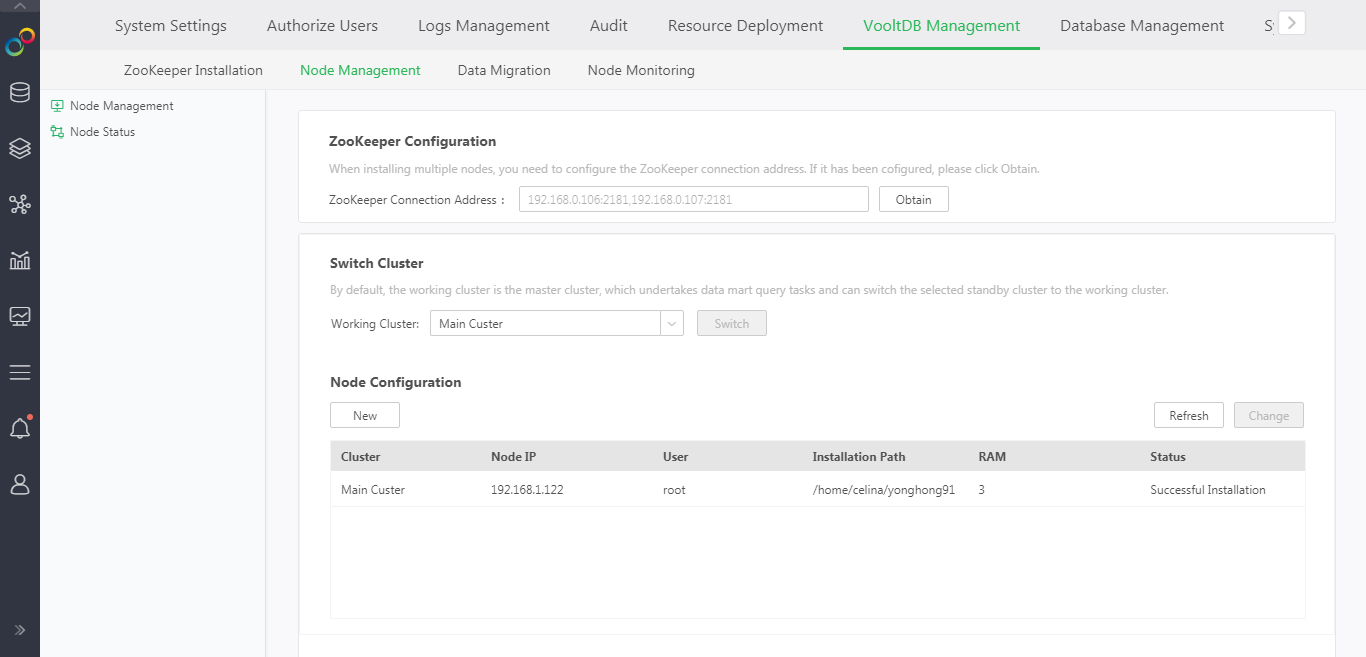
Vooltdb Supports Disaster Recovery and Capacity Expansion
After the new version of vooltdb is installed, if you add or delete a node, you do not need to reinstall it, just click Change. Vooltdb also supports the installation of up to three clusters: the main cluster, the standby cluster one and the standby cluster two. The data of the three clusters are consistent. The user can set one of the clusters as the working cluster, and the working cluster is responsible for the data mart query task. When the working cluster fails, the user can switch other clusters to the working cluster to ensure that the system can still operate normally.
It should be noted that the number of nodes in the three clusters must always be the same. If the number of nodes in one of the clusters changes, the rest must be changed along with the data changes.
Dynamic Incremental Update of Data
In the past, when data in Yonghong system are imported to the data mart, there are two options, synchronizing data sets, and incrementally importing data. Only adding new data is supported in incremental import data.
If the user’s old data has new modifications, the user can only delete the old data.
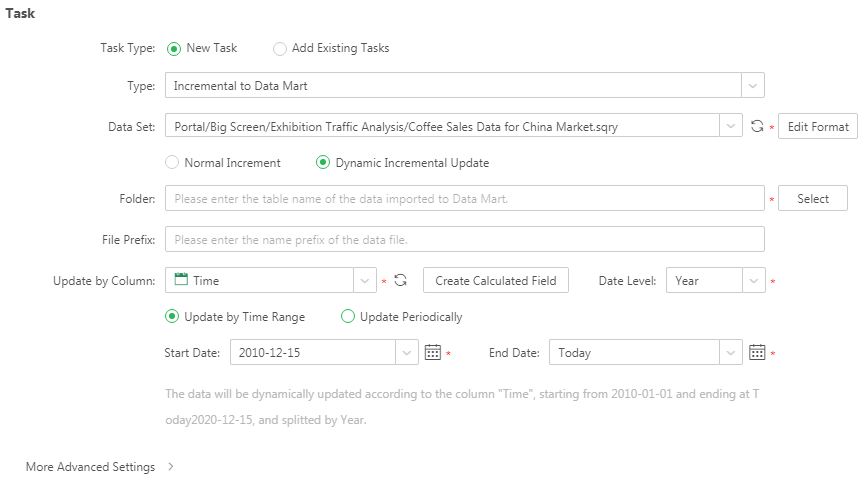
Version 9.1 added "Dynamic Incremental Update" option in incremental import data. Users only need to select a date column to update old data + append new data. Users can directly choose to update in a specified time range or update periodically.
User scenario 1: Import into the data mart on a daily basis,
When importing data into the data mart, select the day for the date level, divide the data into the data mart by day and set the start time, and the end time is today. The time frequency of the scheduled operation can be set to 1 day.
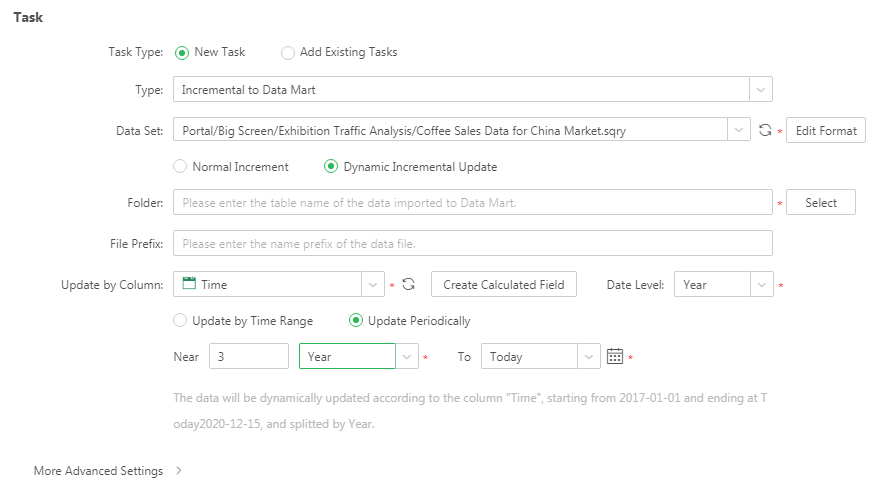
User scenario 2: Update data for the past 3 years
When importing data into the data mart, divide the data into the data mart by day and set the start time, and the end time is today.
Update periodically, as shown below:
Multi-select Deletion of Data Mart Files
Support multiple selection of multiple data mart folders or files to delete.
8. Mobile
Make Mobile Dashboard
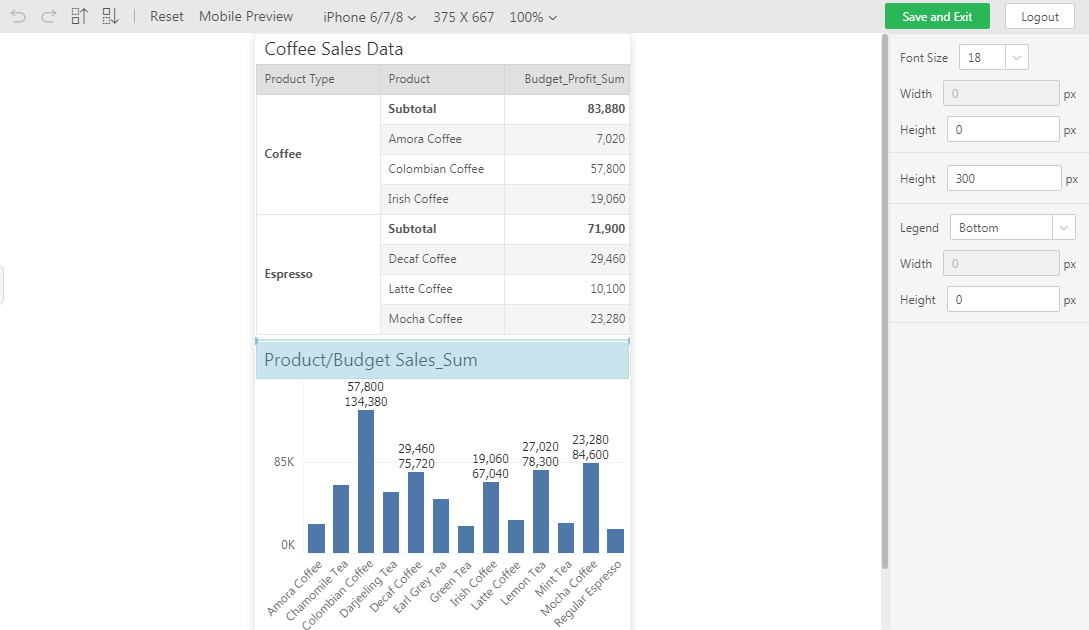
Add new device types in the dashboard settings, you can switch to make mobile dashboards, support a variety of mainstream mobile phone sizes, and also support custom additions.
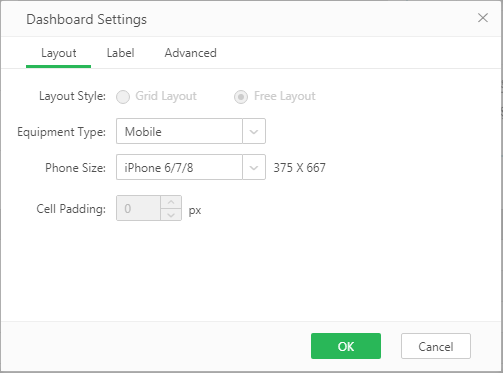
After selecting the mobile terminal, you can directly drag in the components to make a mobile dashboard, and view the dashboard in the preview, which is convenient for making beautiful and complex mobile dashboard.
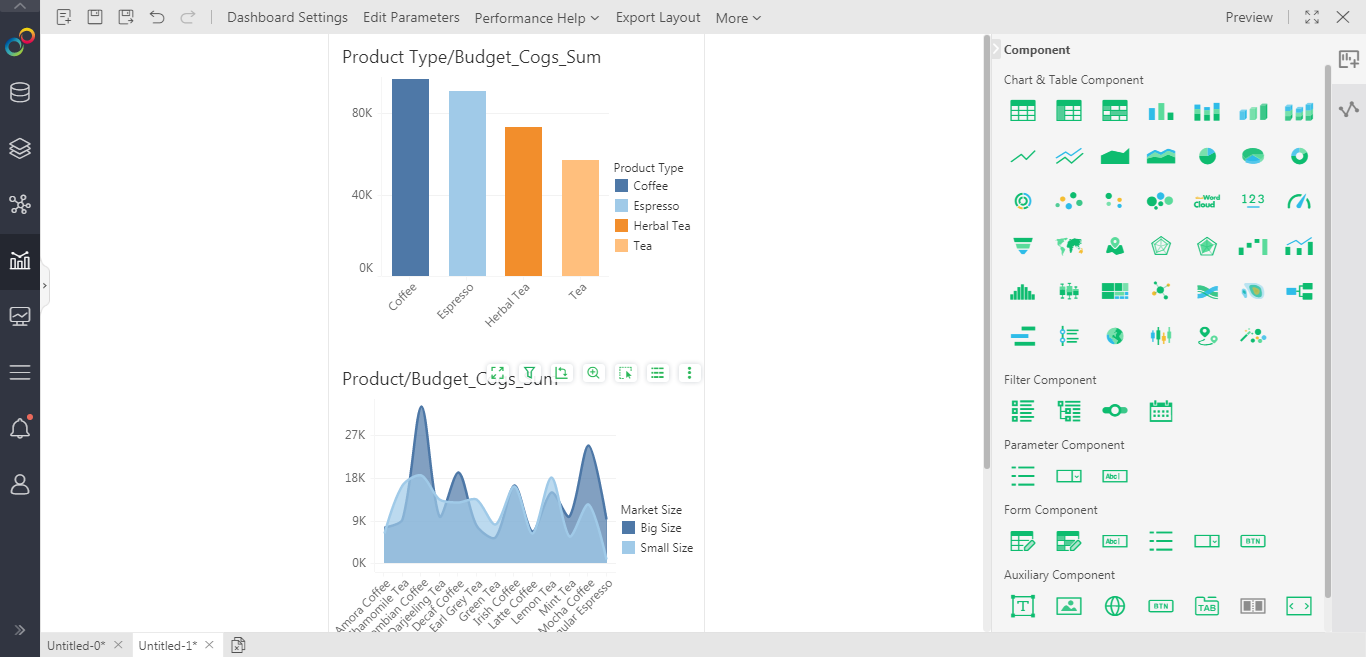
The screen dividing line will be displayed in the canvas, which is the height of each screen, which is convenient for users to understand where the dashboard is displayed.
You can set whether the component is visible on the mobile terminal. When it is invisible, it will be grayed out. When the content is empty, the text component is also visible on the mobile terminal by default. The table component supports table width adaptation and height adaptation. Support Tab and carousel components to be displayed according to the set filling distance on the mobile terminal.
You can set the adaptive type of the mobile dashboard. The mobile dashboard supports global filtering and multiple tags. Note: Currently only the top setting is supported.
Mobile Phone Layout Optimization
The mobile phone layout supports adjusting the width of the X-axis and Y-axis of the chart through the mouse.
The phone layout supports setting the width and height of the legend.
The phone layout supports setting the title width and height.
Optimized Interaction Between Filter and Parameter Components
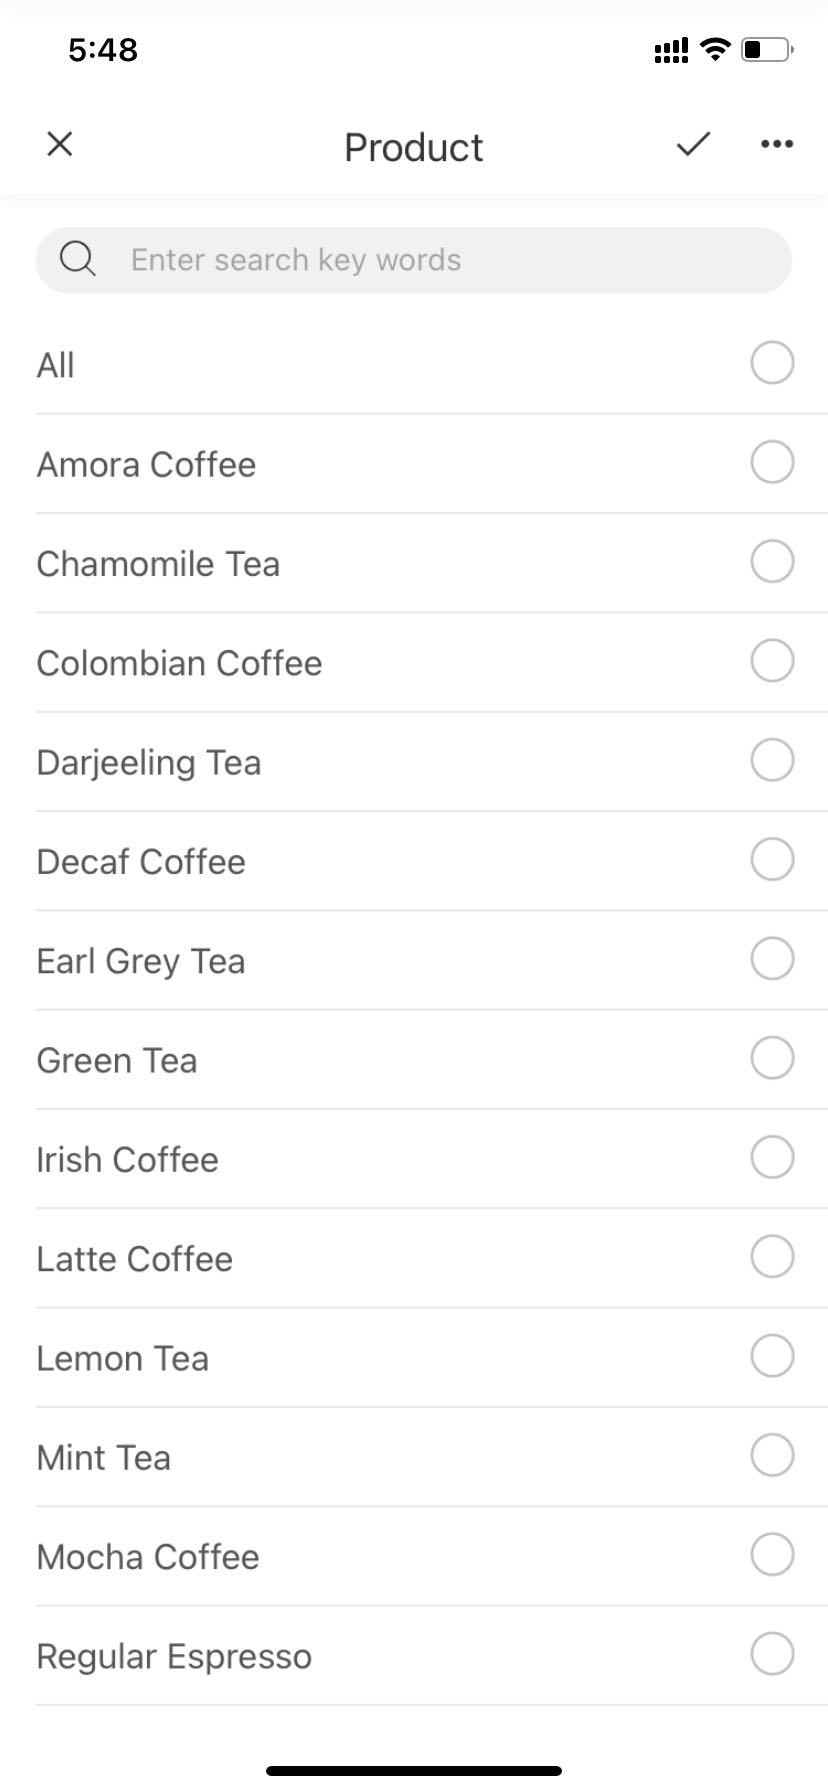
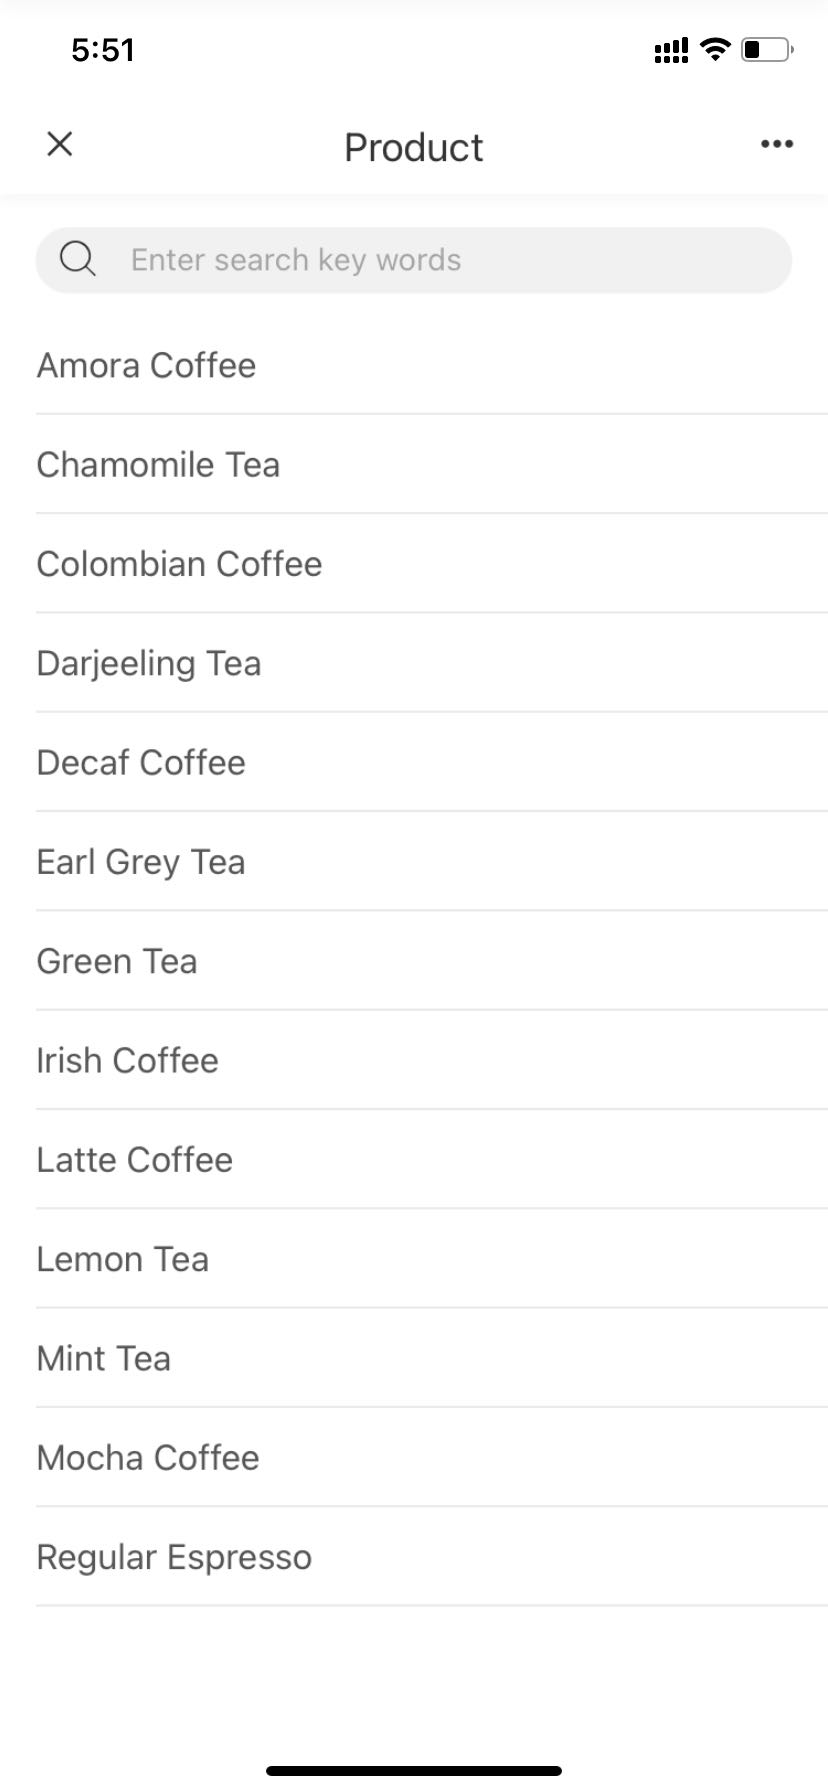
List filters, tree filters, list parameters, drop-down parameters directly display the search box after full screen, you can directly enter the keyword to search. Added confirmation and cancellation. When multiple selections are made, select data and click OK to submit and exit the full screen. When single selections, exit the full screen after you select data.
 、
、 、
、
Integrated Optimization
When the parameter showToolbar=false is added after the url, the menu and search on the homepage may not be displayed.
Support separate integrated portal url (http://ip:port/bi/Viewer?proc=9&req=804&resource=portalViewer&path=path) and combined dashboard url (http:/ip:port/bi/Viewer?isPreview=true&path =Path&isCell=true&action=portal#/Home).
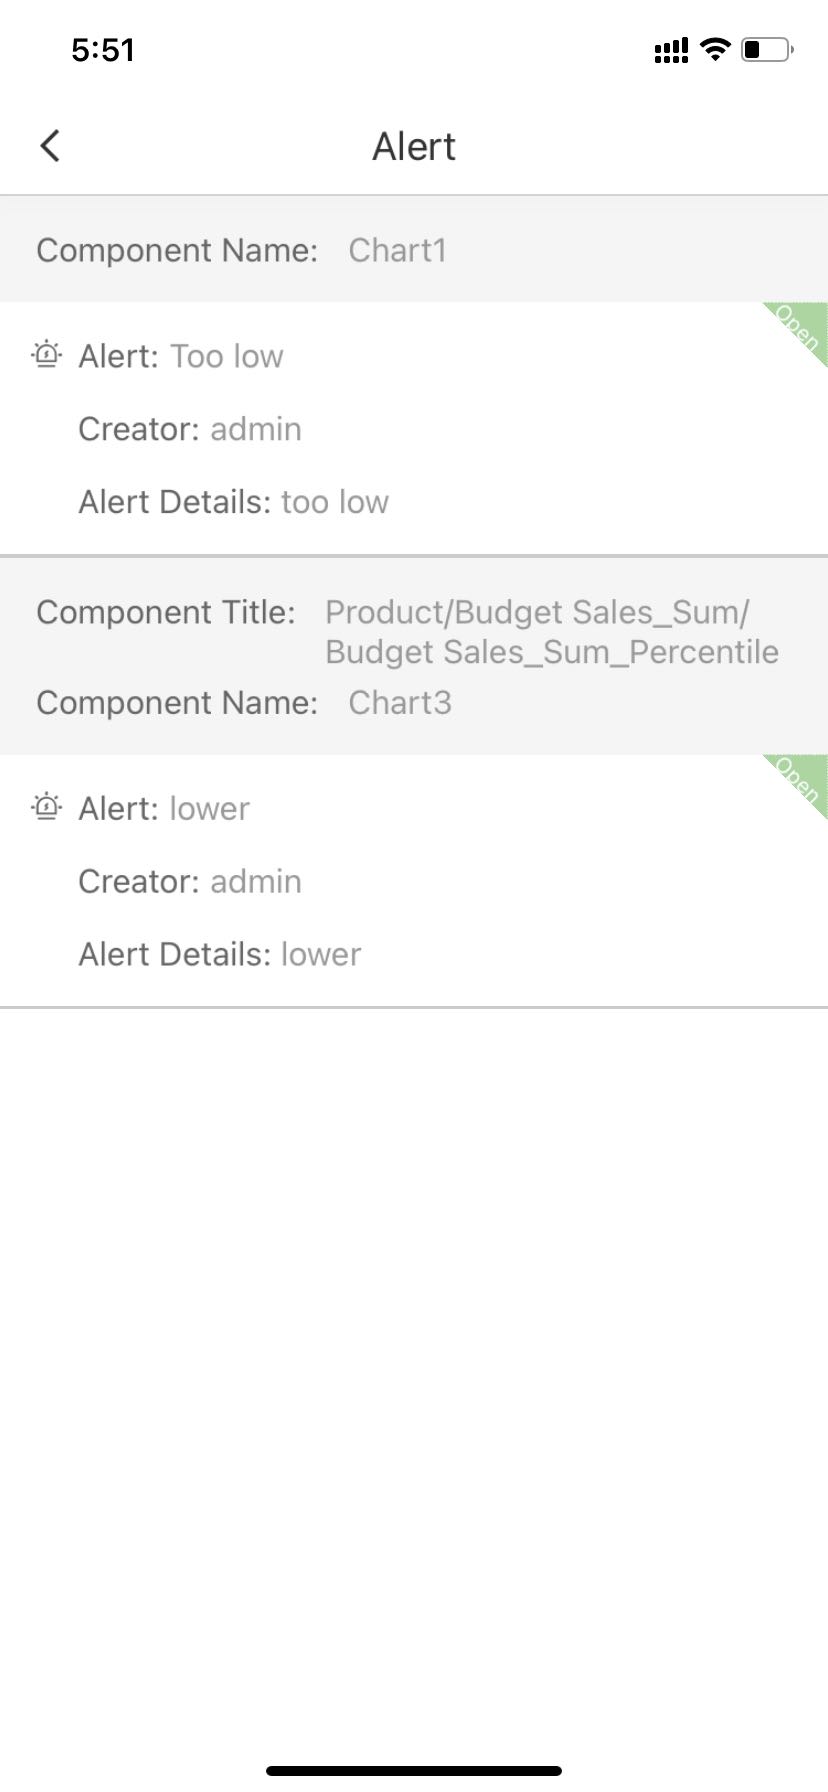
Alert Function Optimization
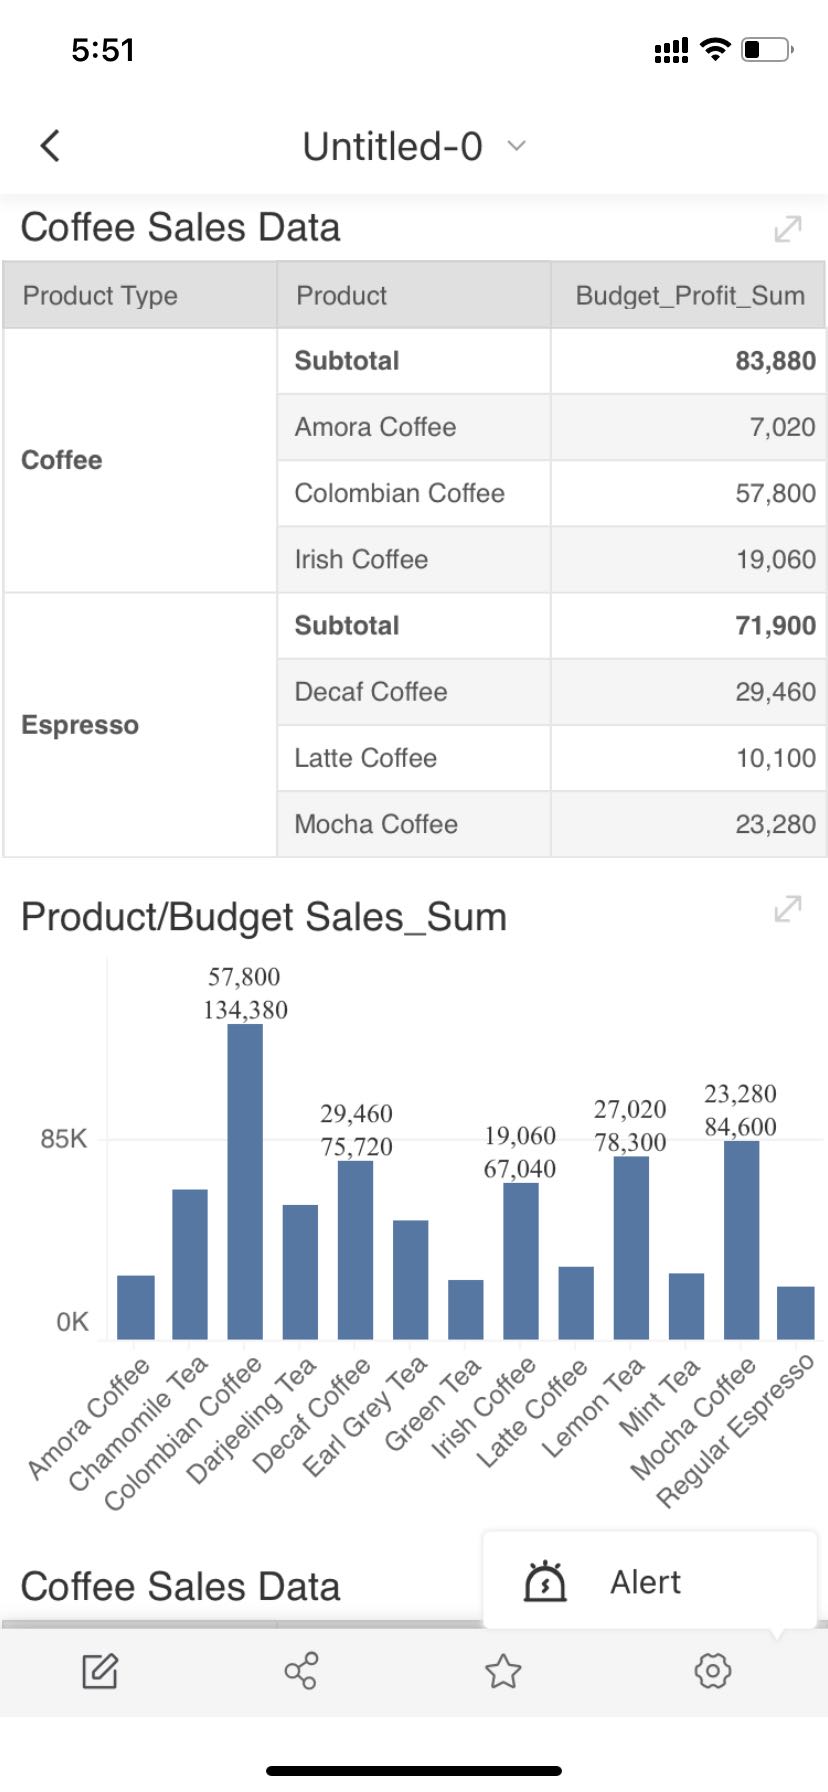
The dashboard page supports the display of alerts, and an alert is added in the menu bar of the dashboard page. Open the alerts, you can display the alert information of all components on this dashboard.
Including component title, component name, alert name, creator, alert details, and alert open/close status.
 、
、
Other Function Optimization
1. When the app expires and automatically log out, return to the login page.
2. Support the shared filtering component function of the portal.
3. When smart layout is supported, the border, background and transparency settings of the dashboard style-grid (smart layout) take effect.
4. When there is no homepage dashboard authority, add a prompt page.
5. App language supports Chinese (Simplified), Chinese (Traditional), English, Japanese, and supports user-defined configuration.
❖New Features List
1. Self-Service Data Preparation
No. |
New Features |
Version |
1 |
Support Domestic Database Dameng |
V9.2 |
2 |
Add Built-in Parameter to Get the Currently Visited IP |
V9.2 |
3 |
Adds SQL Restful API, A New Method Connected to Elasticsearch |
V9.2 |
4 |
Support Exporting Data to Hive Database |
V9.2 |
5 |
Push-down Enhancement of SQL Data Set Basic Operations and Newly Created Calculated Columns |
V9.2 |
6 |
Support mongo_id |
V9.2 |
7 |
Calculated Column Enhancement |
V9.2 |
8 |
Support Stored Procedures to Return Multiple Result Sets |
V9.2 |
9 |
Support Database Stored Procedure Return Cursor |
V9.2 |
10 |
Table Paging of Detailed and Aggregated Data of Sysbaseiq and Other Eight Databases |
V9.2 |
11 |
Custom Totals and Subtotals (Ordinary Data Set, Multidimensional and Kylin Cube) |
V9.2 |
12 |
One-click to Hide/Show All Columns of the Data Set |
V9.2 |
13 |
Move to Is Added to The More Menu of Dataset Metadata |
V9.2 |
14 |
Data Set Supports Multiple Columns to Move, Hide, Delete |
V9.2 |
15 |
When Deleting a Hierarchy or Folder, The New Column in The Folder/Hierarchy Is No Longer Deleted |
V9.2 |
16 |
Calculated Columns of Different Data Types Have Different Icon Styles, Making It Easier to Distinguish Data Types |
V9.2 |
17 |
New Data Source Sorting |
V9.2 |
18 |
Expand/Collapse Interaction Optimization |
V9.2 |
2. Dashboard
No. |
New Features |
Version |
1 |
Performance Optimization of Parameter Components When Selected All |
V9.2 |
2 |
Dynamic Calculation Enhancement |
V9.2 |
3 |
Date Column Supports Fiscal Year Setting |
V9.2 |
4 |
Dashboard Data Loading Optimization |
V9.2 |
5 |
Menu Optimization |
V9.2 |
6 |
List Parameter, List Filter, Tree Filter Support Input Value to Filter |
V9.2 |
7 |
Filter Column hints the Original Column |
V9.2 |
8 |
Synchronization of Modified Name of Parameter Component |
V9.2 |
9 |
Edit Parameter Dialog Supports Search |
V9.2 |
10 |
Portal Optimization |
V9.2 |
11 |
Component Parameter Transfer Operation |
V9.2 |
12 |
Filter Component and Parameter Component Default Value Optimization |
V9.2 |
13 |
Dashboard Loading Optimization |
V9.2 |
14 |
Script Supports Setting runtime Grid Format |
V9.2 |
15 |
Interaction Optimization |
V9.2 |
16 |
Export Permission Optimization |
V9.2 |
17 |
Freestyle Table Optimization |
V9.2 |
18 |
Portal Combination Supports URL Reference |
V9.2 |
19 |
Freestyle Table and Pivot Supports Wide Adaptation |
V9.2 |
20 |
Rich Text Optimization |
V9.2 |
21 |
Batch Submission Optimization |
V9.1 |
22 |
Script, Dynamic Calculation, Target Line Added Application Function |
V9.2 |
23 |
Optimized Display of TopN Total for Normal Table and Pivot |
V9.2 |
24 |
Application Development and Debugging Process Optimization |
V9.2 |
25 |
Intelligent Axis Scale Optimization |
V9.2 |
26 |
Multi-label Support Format Setting |
V9.2 |
27 |
Waterfall Chart Summary Label Optimization |
V9.2 |
28 |
Guideline Optimization |
V9.2 |
29 |
Continuous Time Axis Scale Optimization |
V9.2 |
30 |
Data Format Default Value Optimization |
V9.2 |
31 |
Add Color Preview to The Color Panel |
V9.2 |
32 |
Optimized Dashboard Layout Multi-Component Settings |
V9.2 |
33 |
Multi-component Supports More Alignment Methods |
V9.2 |
34 |
Add the Gauge Style and Optimize Its Ease of Use |
V9.2 |
35 |
Parameter Component Date Style Optimization |
V9.2 |
36 |
Date Filter Component Style Optimization |
V9.2 |
37 |
Optimized Component Color Settings |
V9.2 |
3. Data Form
No. |
New Features |
Version |
1 |
Support More Data Source Types |
V9.2 |
2 |
Add Navigation Bar when Editing Form |
V9.2 |
3 |
Support Configurable Form Title Number |
V9.2 |
4 |
View the Number of Filled Forms |
V9.2 |
4. Reporing & Workflow
No. |
New Features |
Version |
1 |
Add Freestyle Form Component to Support Users' Complex Form Filling Scenarios |
V9.2 |
2 |
Optimize Smart Submission |
V9.2 |
3 |
Optimized "When uploading Excel, delete all data" |
V9.2 |
4 |
Support Common Reporting Related Operations Through Button Components |
V9.2 |
5 |
Added A Pop-up Window for Reporting |
V9.2 |
6 |
Upload Excel Support Custom Starting Line |
V9.2 |
7 |
When Uploading Excel, Automatically Recognize the Text Format of the Column |
V9.2 |
8 |
Optimize Data Verification: When Submitting Data, the Modified Data in the Form Will Be Verified Again |
V9.2 |
9 |
Optimized for Ease of Use |
V9.2 |
10 |
Optimize the Submit Logics in Workflow Module |
V9.2 |
11 |
Fixed the Bug of Timed Task |
V9.2 |
5. Advanced Analytics
No. |
New Features |
Version |
1 |
Experiment Supports Undo and Redo |
V9.2 |
2 |
Support Cut, Copy, Cut and Connect, Delete and Connect Nodes |
V9.2 |
3 |
Support Multi-node Save |
V9.2 |
4 |
Python Script Node Supports Multiple Data Access |
V9.2 |
5 |
Support Real-time Log When the Experiment Is Running |
V9.2 |
6 |
Make Dashboard Module Support the Application of Experiments |
V9.2 |
7 |
Ease of Use Optimization |
V9.2 |
6. Enterprise Management
No. |
New Features |
Version |
1 |
Desktop Supports Adding Row/Column Filtering |
V9.2 |
2 |
Added Authorized User Column in Job List |
V9.2 |
3 |
Need the Confirm When Delete Table and Connection |
V9.2 |
4 |
Resource Import Supports Selecting Dependent Resources |
V9.2 |
5 |
Optimized the Dashboard "Operational Resource Information Monitoring Statistics" of the Monitoring System |
V9.2 |
6 |
Desktop Supports Mac System |
V9.2 |
7 |
Information Refinement of the Table "User Operation Information Monitoring Statistics" |
V9.2 |
8 |
Split and Refine Operation Authority of Management System |
V9.2 |
9 |
API Requirements |
V9.2 |
10 |
Export Permission Data |
V9.2 |
11 |
Custom Task Supports Selecting User |
V9.2 |
12 |
User Attributes Add Creation Time, Modification Time, etc. |
V9.2 |
13 |
License Server |
V9.2 |
14 |
System Startup Defaults to File Permission Management System |
V9.2 |
15 |
Optimize Default Value of Personal Email |
V9.2 |
16 |
Optimize the Display of Service Status for Non-admin |
V9.2 |
7. Big Data
No. |
New Features |
Version |
1 |
Install ZooKeeper |
V9.2 |
2 |
Vooltdb Supports Disaster Recovery and Capacity Expansion |
V9.2 |
3 |
Dynamic Incremental Update of Data |
V9.2 |
4 |
Multi-select Deletion of Data Mart Files |
V9.2 |
8. Mobile
No. |
New Features |
Version |
1 |
Make Mobile Dashboard |
V9.2 |
2 |
Mobile Phone Layout Optimization |
V9.2 |
3 |
Optimized Interaction Between Filter and Parameter Components |
V9.2 |
4 |
Integrated Optimization |
V9.2 |
5 |
Alert Function Optimization |
V9.2 |
6 |
Other Function Optimization |
V9.2 |