|
<< Click to Display Table of Contents >> Yonghong Z-Suite V9.0 |
  
|
|
<< Click to Display Table of Contents >> Yonghong Z-Suite V9.0 |
  
|
❖New Key Features
1. Self-Service Data Preparation
Interaction Optimization of Data Source and Data Set Page
•Guidance tips from data source to data set
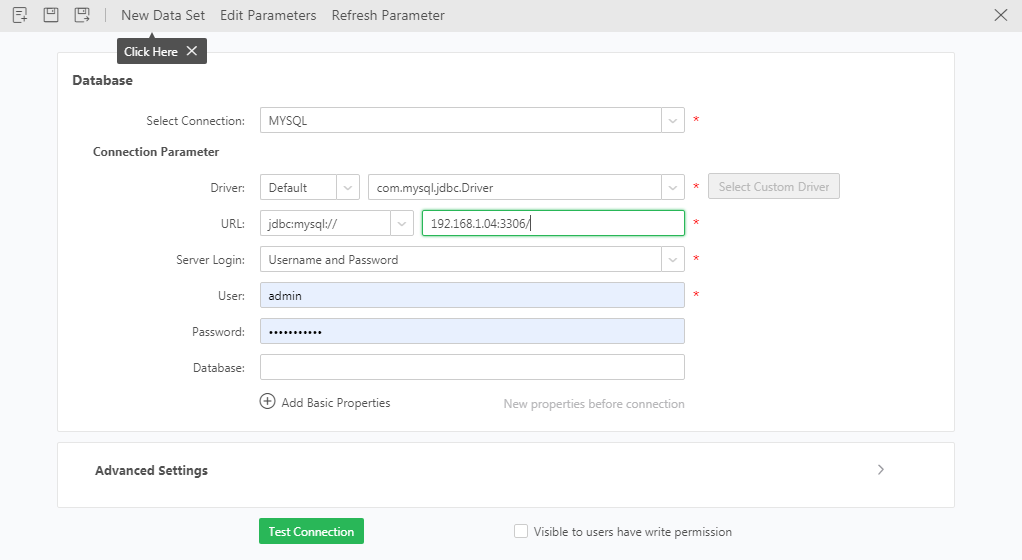
1) Every time a new data source is created, after filling in the required items, an obvious prompt "click here" will appear in the data source toolbar to guide the user to directly create a data set.
Users can also click to close "click here".
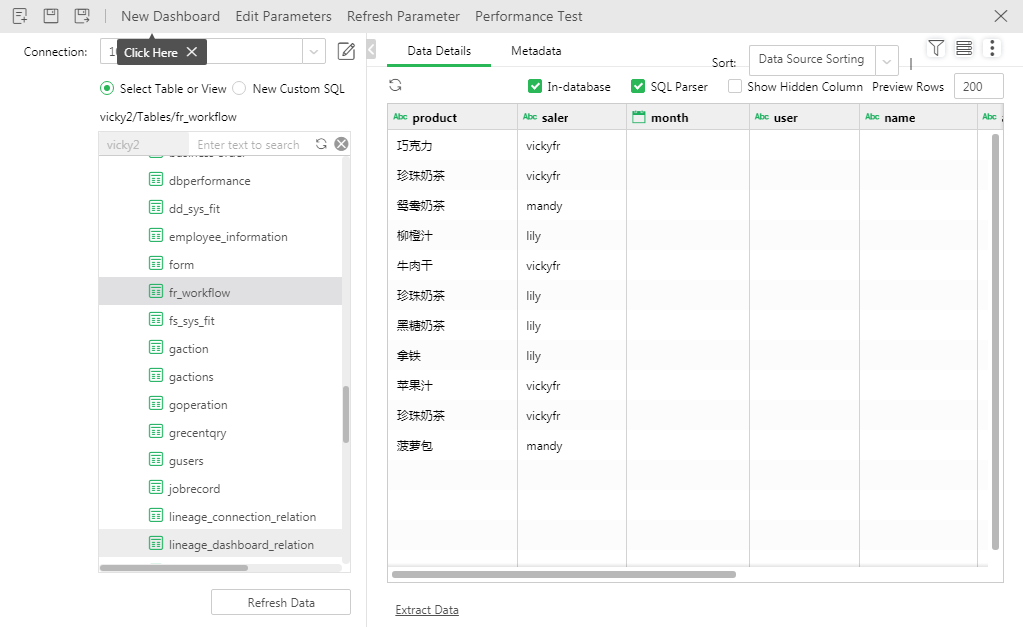
2) Similarly, the data set module will also have a prompt to guide users to directly start the dashboard production after creating the data set.
•The function and interaction optimization of the data set interface
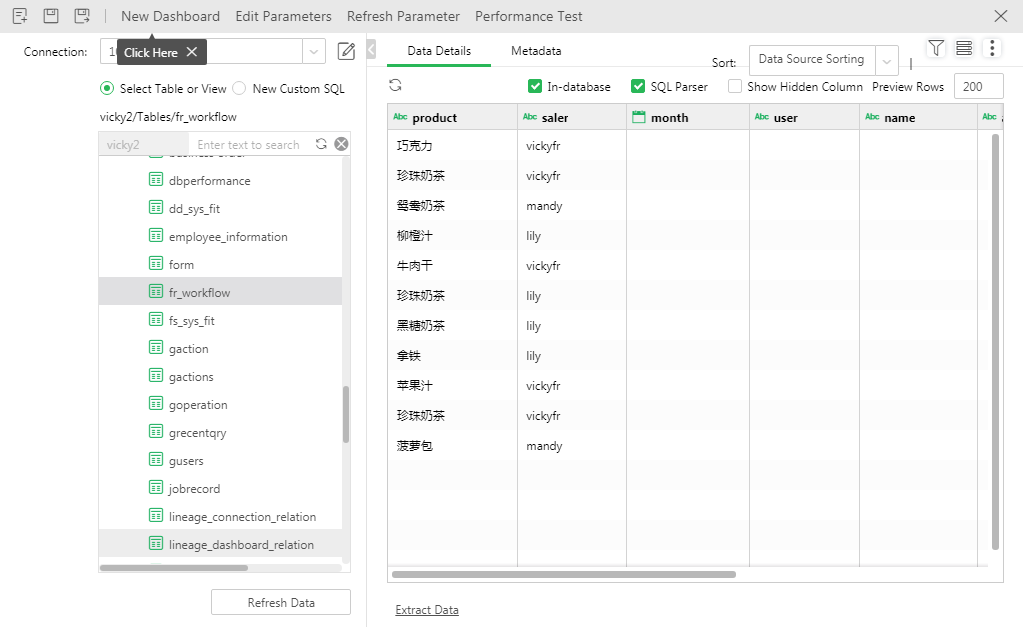
1) The function of "Refresh Metadata" is optimized to "Refresh Data". After the user selects a table or custom SQL, he can click "Refresh Data" to view metadata, data details, and perform data processing.
2) After the user clicks "Refresh Data", the data details will be displayed, and a guiding prompt "Click here" will appear near the New Dashboard on the toolbar at this time.
3) The "Refresh Data" button in the data details is optimized to the form of icon and tooltip, as shown in the figure below:

4) After each upload of the Excel, the data is automatically refreshed, making the Excel data set more convenient to use.
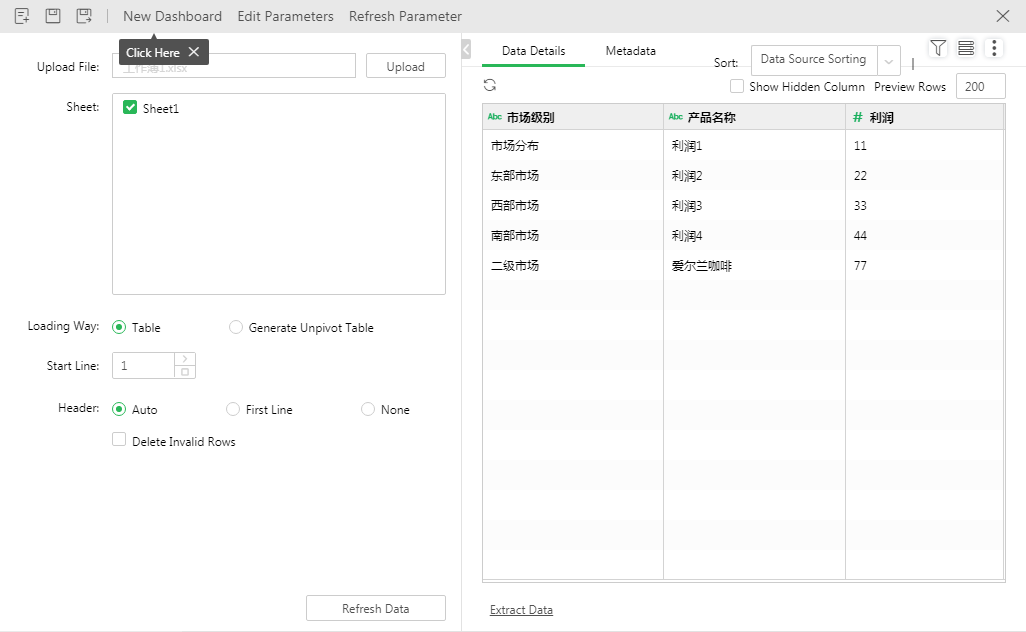
5) In the data set and data source interface, the texts of "New", "Save" and "Save As" are optimized for icon display.
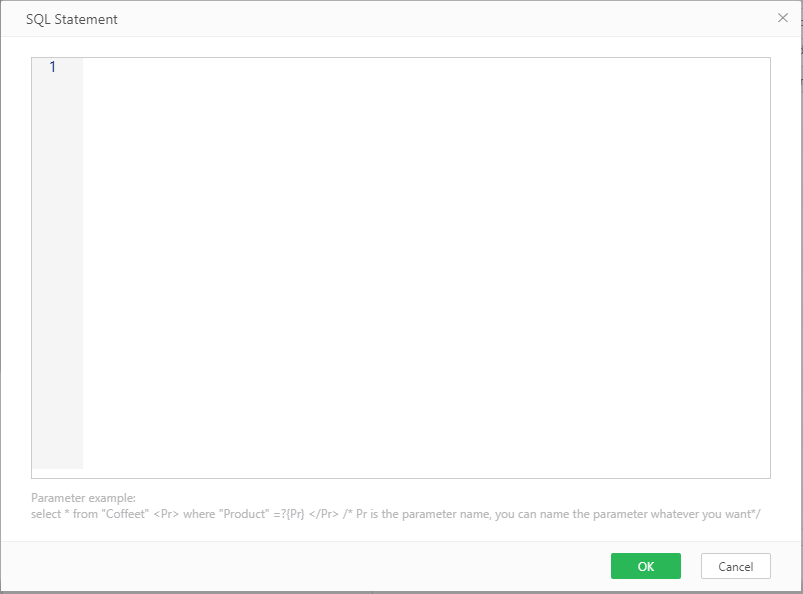
6) New parameter examples for SQL data sets to strengthen guidance and assistance to users. The sql data set provides parameter examples of SQL statements to help users standardize and write SQL statements correctly.
•Interactive optimization of moving columns in data set page

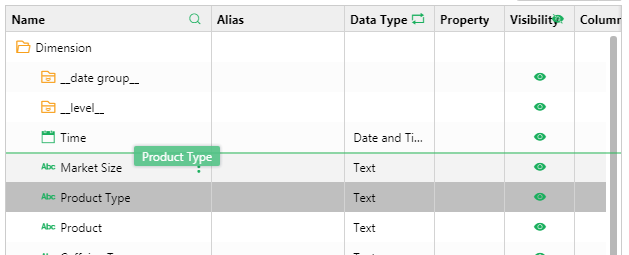
Yonghong supports drag and drop to change the order of columns in version 7.0, provided that manual.sort.repository=true is configured.
In the new version V9.0, the interactive style of dragging and moving columns has been optimized.
Logic Optimization of Date
1) When the date is filtered and fetched, it used to be grouped, and then the maximum and minimum are obtained. 9.0 is optimized to directly take the maximum and minimum values of this column of dates.
2) For date filtering and range filtering components, if it is bound to the date and time type data of the SQL dataset, we will create a new date expression by default to discretize the data, but when spelling SQL and pushed down to the database, both columns are found. In the new version, it is optimized to only spell date expression columns for supported databases. And the date access is no longer affected by list.qry.maxrow (recommended to set greater than 2).
SELECT MIN(`Trading time`) AS LONG_COL_0, MAX(`Trading time`) AS LONG_COL_1
FROM celina.coffee_zhcn
3) If you add multiple columns to the filter, keep the grouping logic as before.
Continue to Enhance the Function of Calculated Columns For More Databases
Starting from version 9.0.1, the calculation column enhancement are enabled by default. If you don't need to turn it on, you can set use.yonghong.script=false.
•Calculated columns are enhanced, and the following databases are newly supported
The newly supported databases in version 9.0 are db2, derby (product built-in demo), gbase8a, hana, mysql, postgresql, gaussdb100, gaussdb200, greenplum, max compute.
Basically ensure that every function of every supported database is pushed down.
•Version 9.0 supports more fine-grained syntax detection, and provides different prompts for different functions and data types
9.0 supports more fine-grained syntax detection, and prompts for the number of parameters and parameter data types according to different functions and data types.
Example 1:
When the data type of the parameter is used incorrectly, it will be prompted at the syntax check. For example, dateGap(col['caffeine type']), dategap uses the parameter (string) incorrectly, and the correct parameter type is (datetime, datetime, string).
Example 2:
The parameter data type of some functions is universal, and we will use expression instead in the syntax check.
For example, if only input ifNull(), it will prompt ifNull uses the parameter () incorrectly, and the correct parameter type is (expression, expression).
•The version 9.0 of the data set module can prompt the invalid state of the calculated column
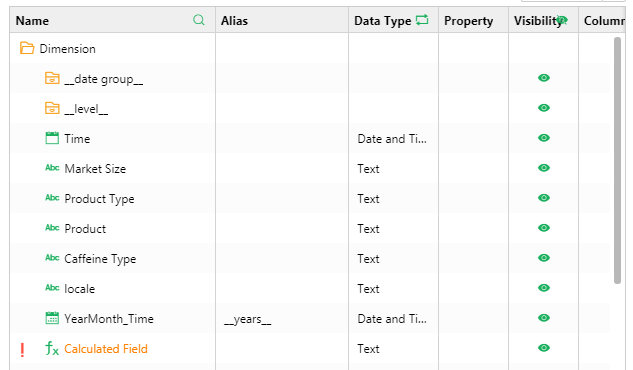
In the 9.0 version of the data set interface, if the user directly saves a grammatically incorrect expression, a red exclamation mark will appear after the data column, prompting the user of a calculation error.
The prompt is synchronized with the grammar check: the calculated column with an error in the grammar check is considered invalid. Errors are thrown directly during execution, and invalid columns do not interfere with execution.
Note: Version 8.8 has supported the prompt of invalid calculation columns in the dashboard interface.
Mongo Calculated Columns Support Aggregate Functions
When using the Mongo data set to make dashboard, the mongo calculated column newly supports aggregation functions and supports the pushdown of most Mongo pipeline statements.
Data Levels Setting in Dashboard Module Further Supports Integration Scenarios
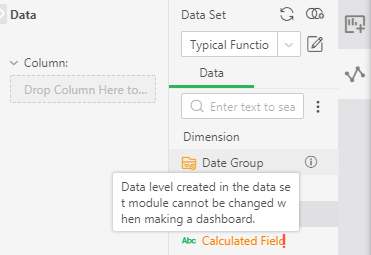
Before performing data analysis and realizing data drilling and drilling, you need to create a data hierarchy first. In the previous version, creating a data hierarchy needed to be done in the data set module.
In the integrated environment, some large customers only integrate the dashboard module, but not the integrated data set, which makes it difficult for these customers to perform data drilling. In order to make it easier for those customers to drill up and down data, the new version opens the function of creating a data hierarchy to the dashboard module.
1. The user can directly select multiple columns to create a data hierarchy when making a dashboard.
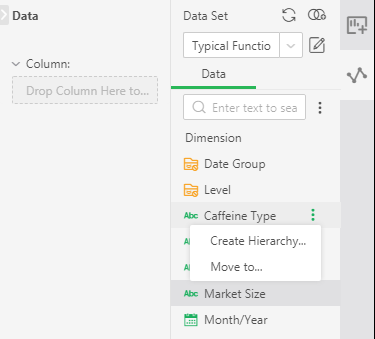
2. If the user has created a data hierarchy in the data set, the level column created in the data set cannot be changed when making a dashboard, as shown in the following figure:
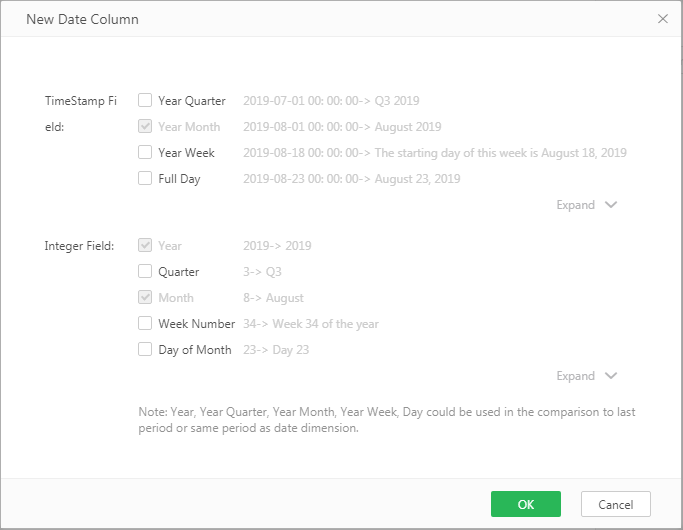
The Dashboard Module Supports the Creation of Date Expressions\Date Levels, Making Self-service Analysis More Convenient
The dashboard module supports to create new date expressions and date levels, and each type of date field is explained to improve ease of use.
Common date expressions are displayed by default, and the interface is as follows:
Add the Property, max.permit.rows, to Control the Termination of Non-sql Calculations (V9.0.1)
System Settings>System Parameter Configuration adds max.permit.rows to control the maximum number of rows of summary calculation in data mart calculation or memory processing. The default value is 5000000. If it exceeds, the calculation will be terminated.
2. Dashboard
Optimization of Right Settings Pane
The new version optimizes the classification of the component settings pane, which is mainly divided into component, data, format, axis, graphics, settings, etc. As shown below:
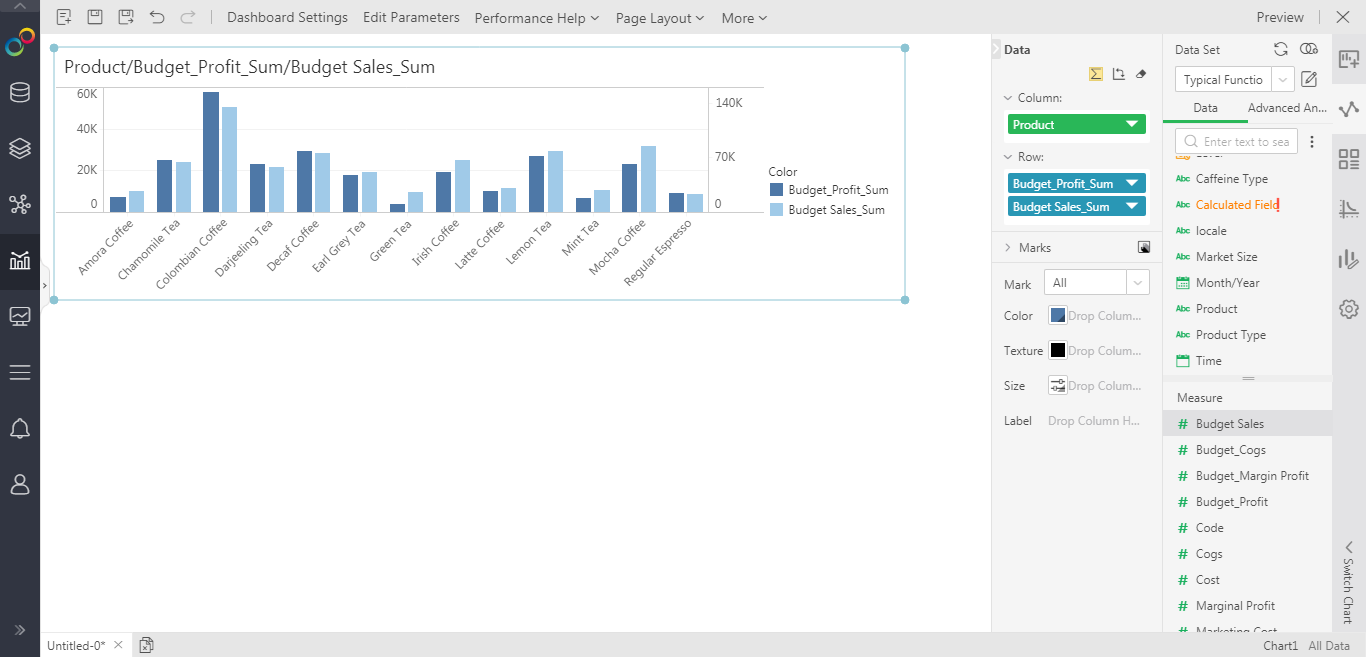
Format: Contains some basic formatting related to components and component elements, as well as component styles.
Axis: The setting items related to the row and column axis.
Graphics: Contains graphics and legends, as well as graphics drawing related settings.
Settings: Contains component property settings and analysis functions (highlight, hyperlink, warning, target line, trend line).
Support Component Full Screen and Dashboard Full Screen
When editing or viewing dashboards in the new version, component full screen and dashboard full screen are supported. When the component is full-screen, it will be enlarged to the size of the dashboard area, which is convenient for users to edit and view partial graphics. As shown below:
Component full screen when making dashboard:
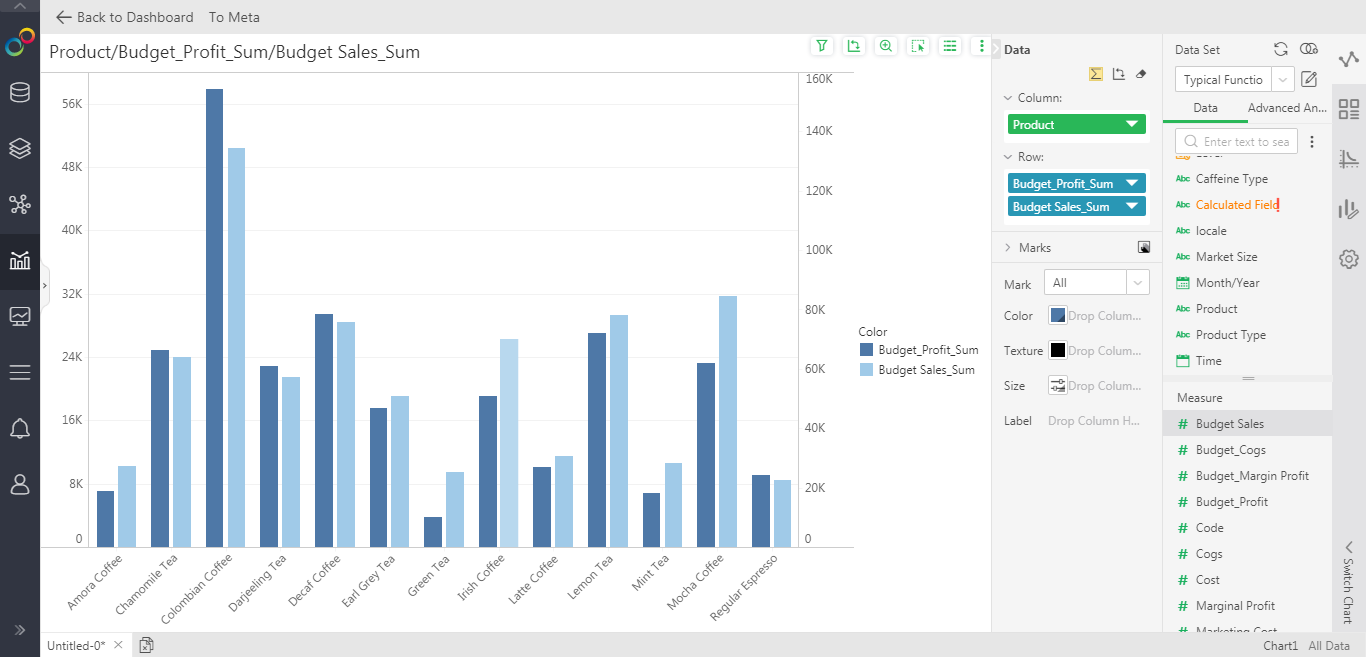
Component full screen when viewing dashboard:
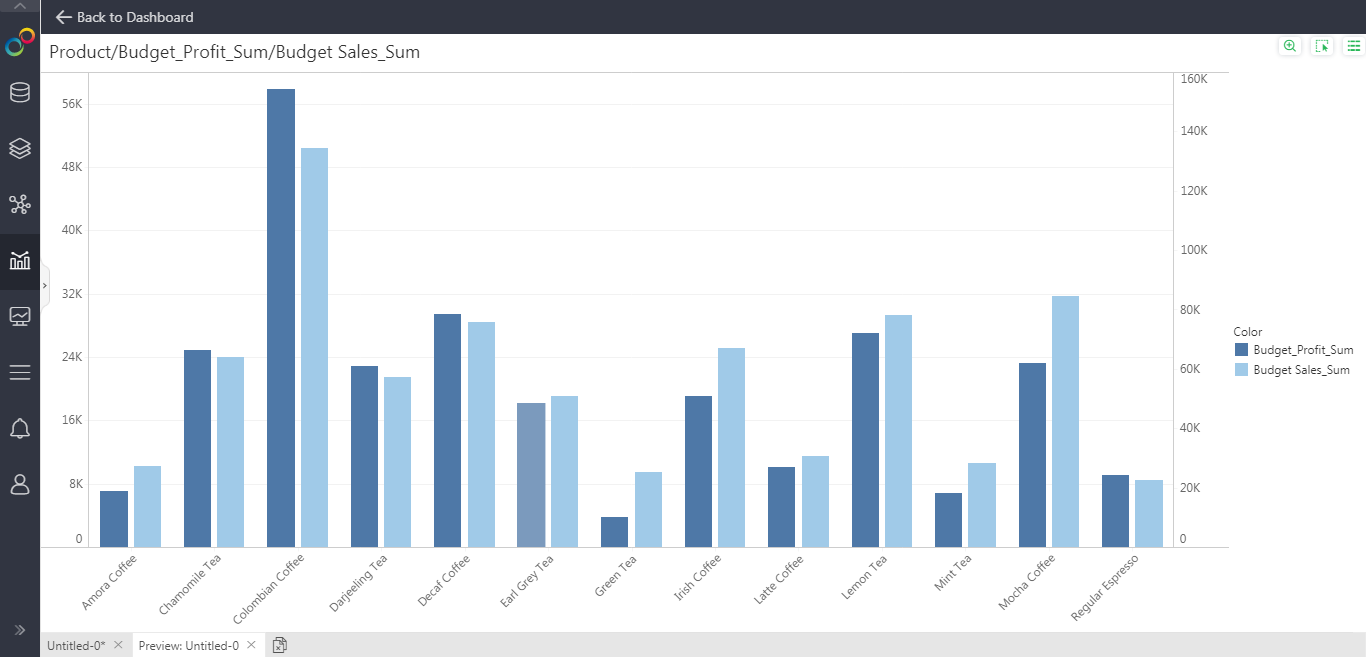
Table Supports the Highlight Applied to the Entire Row
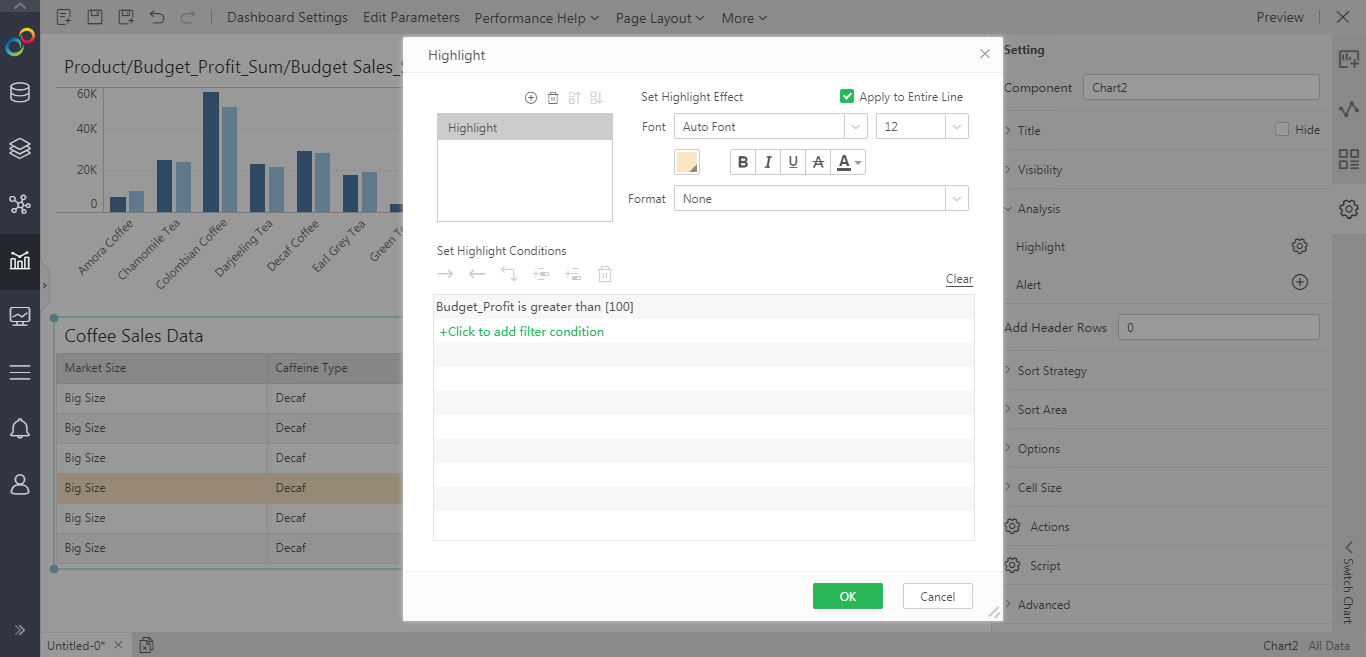
The new version of the ordinary table supports enabling the highlight to the entire row (row highlighting for short) when setting the highlight, which is convenient for users to highlight data in a certain dimension. Row highlighting can be edited in any column of the row. The priority of row highlighting is lower than that of cell highlighting.
Freestyle Table Functions are Simplified, and the Ease of Calculation Between Grids is Improved
The new version has made the following optimizations to the freestyle table:
Shorten the cell name, and no longer automatically add the data set name when the cell is bound to the column.
In the metadata mode, the cells are displayed according to the "↓cell name: column name" rule.
When the Cell function refers to a non-expanded cell, it supports data access.
Four functions left(int: offset), right(int: offset), up(int: offset), and down(int: offset) are added to the calculation between grids. Users can use these four functions to refer to the cells in the left, right, top, and bottom directions of the current cell when calculating between grids.
The function description is as follows:
•left(int num)
The function of the reference grid in the calculation between grids represents the numth cell from the left of the current cell.
Note: num needs to be greater than 0.
For example: left(1) means the first cell to the left of the current cell.
•right(int num)
The function that refers to the grid in the calculation between grids represents the numth cell to the right of the current cell.
Note: num needs to be greater than 0.
For example: right(1) means the first cell to the right of the current cell.
•up(int num)
The function that refers to the grid in the calculation between grids represents the numth cell above the current cell.
Note: num needs to be greater than 0.
For example: up(1) means the first cell above the current cell.
•down(int num)
The function of the reference grid in the calculation between grids represents the numth cell below the current cell.
Note: num needs to be greater than 0.
For example: down(1) means the first cell below the current cell.
Parameters Could be Used in TopN Sorting, Table Rendering, Warning Detailed Information, Target Line
The new version of topN sorting, table rendering, warning detailed information, target line supports reference parameters, which meets scenarios such as dynamic sorting, dynamic rendering and sending different warning information.
Optimize Portal Settings to Improve Portal Personalization Capabilities
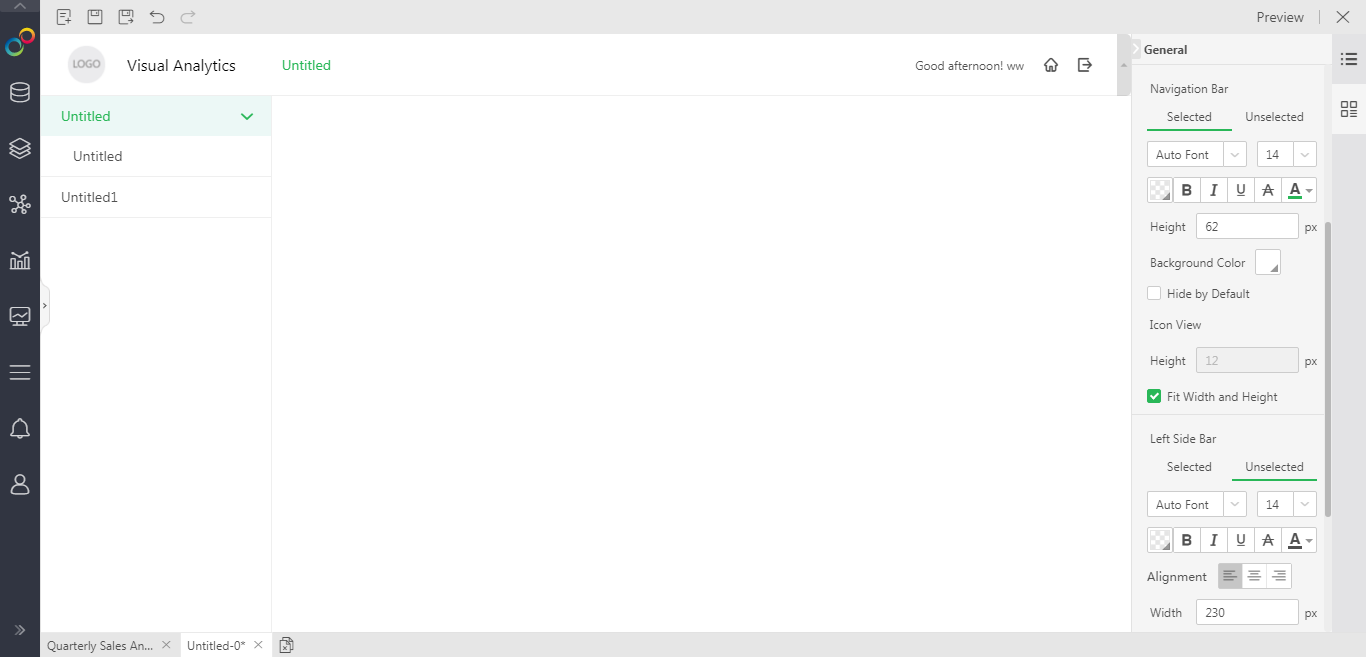
Both the portal navigation bar and the left side bar have added selected and unselected format settings, and the corresponding icons support defined sizes. As shown below:
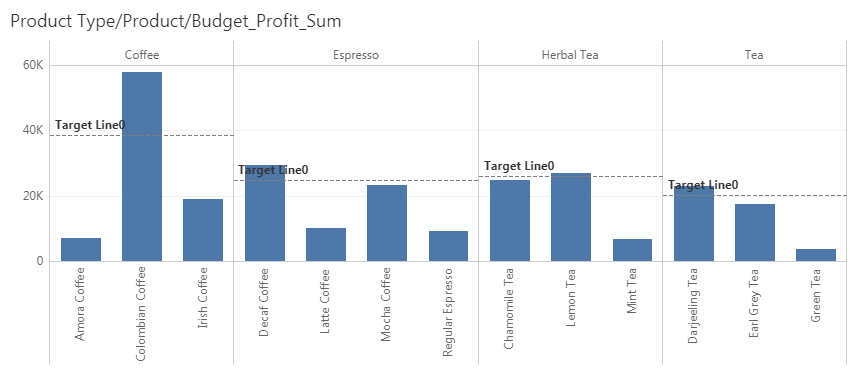
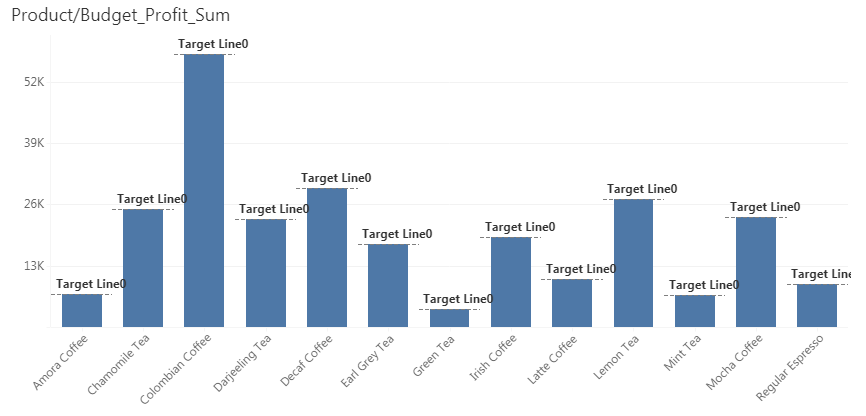
Support Table/ Area/ Cell Target Line
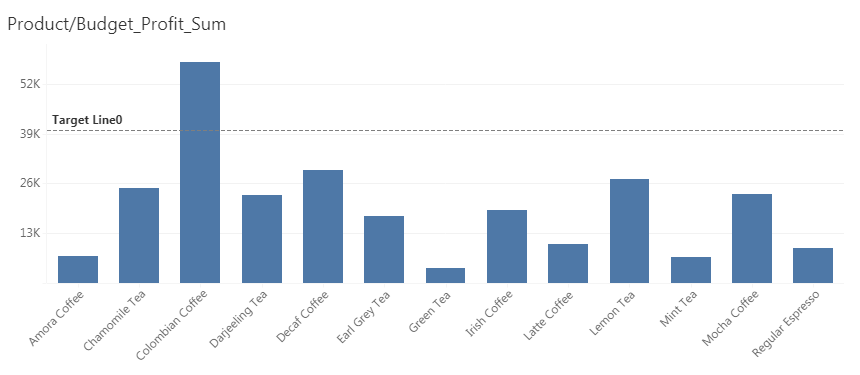
The new version optimizes the target line interaction, and divides the target line to three modes, that is table, area, and cell. Both target line and interval line support these three modes.
Target line-table:
Target line-area:
Target line-cell:
Hyperlink Hides the Parameters to Solve the Problem of Access Error for Too Many Parameters
In the new version of the hyperlink, parameters are no longer displayed in the URL, shorten the length of the URL, and solve the problem of inaccessibility due to too many parameters and too deep levels.
The Table Adds Height Self-adaptation and Paging Settings to Enhance the Flexibility of the Table
Common tables, cross tables, and freestyle tables have height self-adaptive functions. The tables can be expanded and displayed based on actual data. It is not recommended to use when there are too many data.
Table paging supports switching the number of pages when viewing, and users can increase or decrease the number of page rows according to the scene.
Support Configuration Loading Animation for Dashboard Viewing
The new version has redesigned the loading style of viewing dashboards, and users can customize the style by configuring viewer.loading.name.
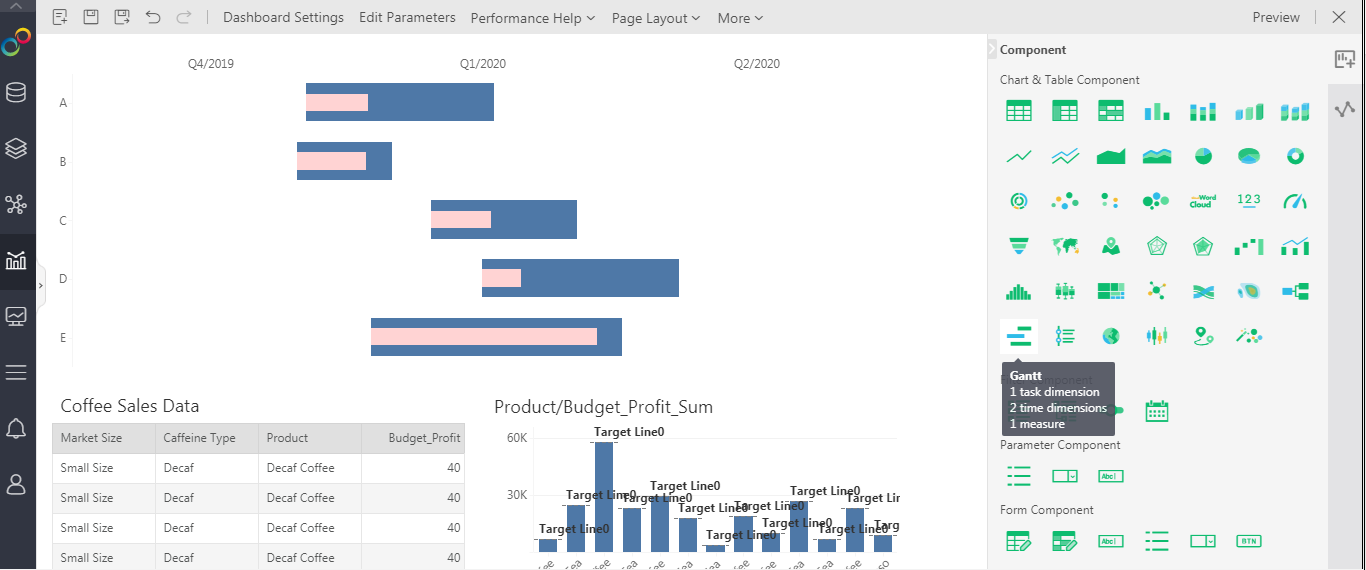
Support Gantt Chart to Help Users View the Progress of Tasks
The new version adds Gantt chart. Users can quickly make the Gantt chart, as shown below:
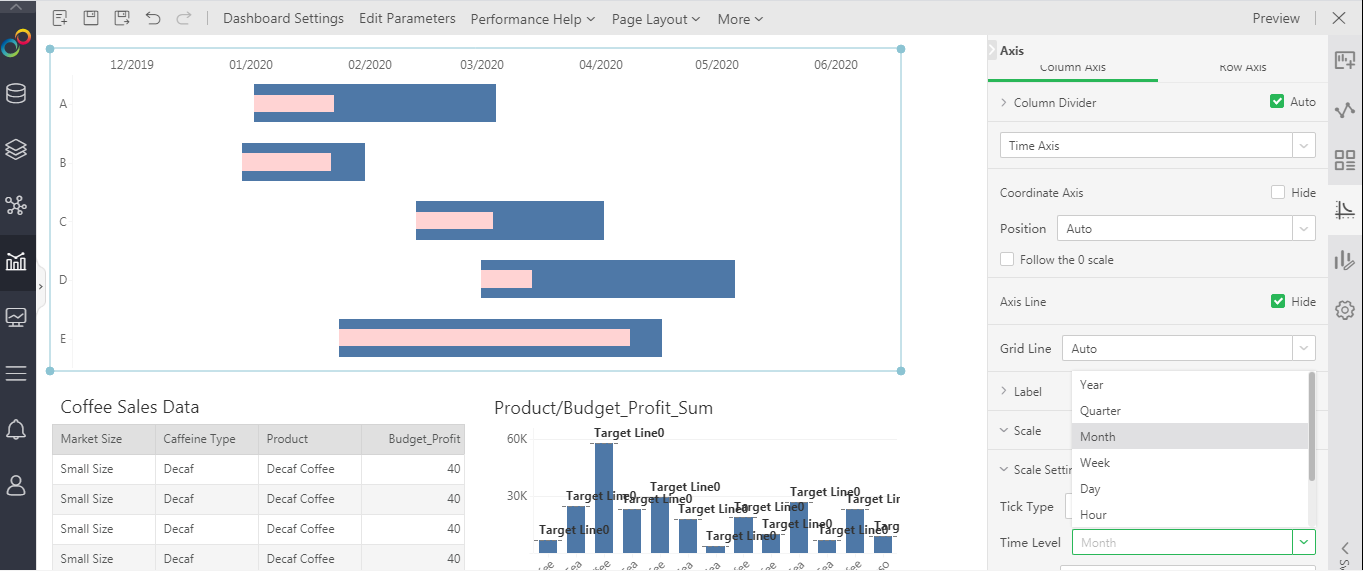
In addition, the Gantt chart also supports time level settings, which can adjust the time axis and graph drawing, as shown in the following figure:
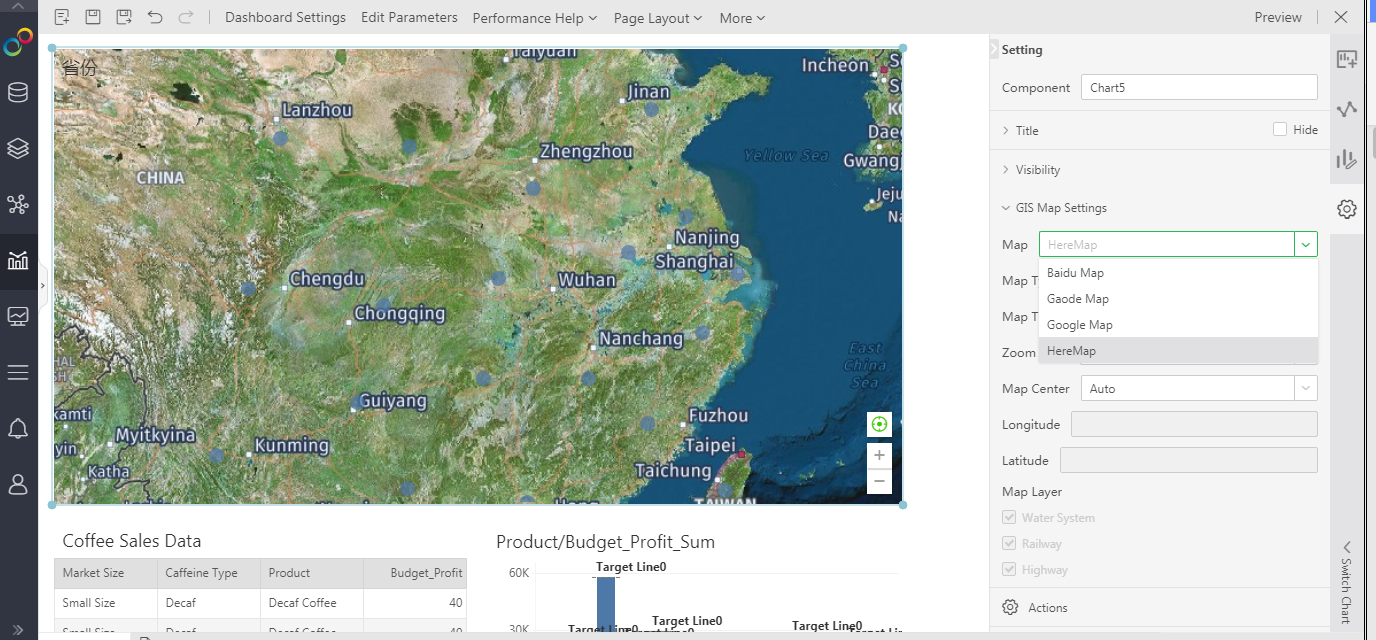
GIS Map Supports HereMap
The new version of GIS map adds support for HereMap, but it is not open by default. Users can configure HereMap map and Key to use.
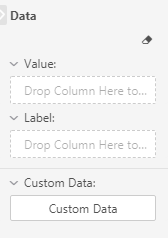
Custom Data Optimization for Parameter Component
The new version adjusts the custom data of list parameter and drop-down parameter components to the data menu, as shown in the following figure:
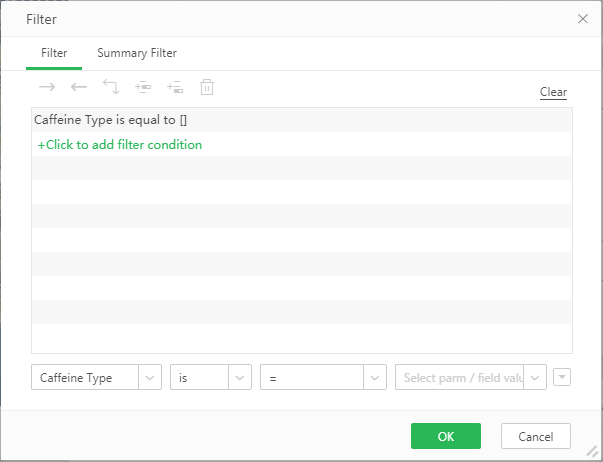
If the user adds custom data, there will be corresponding interactive prompts, as shown below:

Text Format -> Digital Format Adds the Unit, million
The new version adds millions in the digital format by default, and optimizes the format display, shown as below.

Interactive Optimization of Filtering Interface
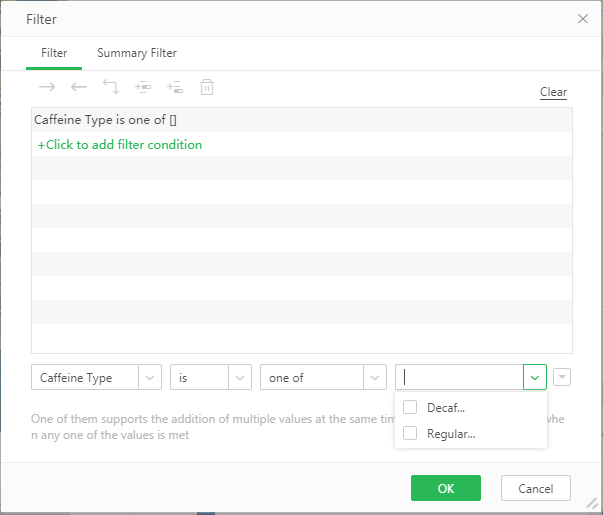
The new version optimizes the filtering interface, gradually guides users to set up filtering, and divides the values into parameters and field values.
In addition, the interactive interface of “one of them” and “including one of them” has been optimized, introductions have been added, and the selection method has been optimized.
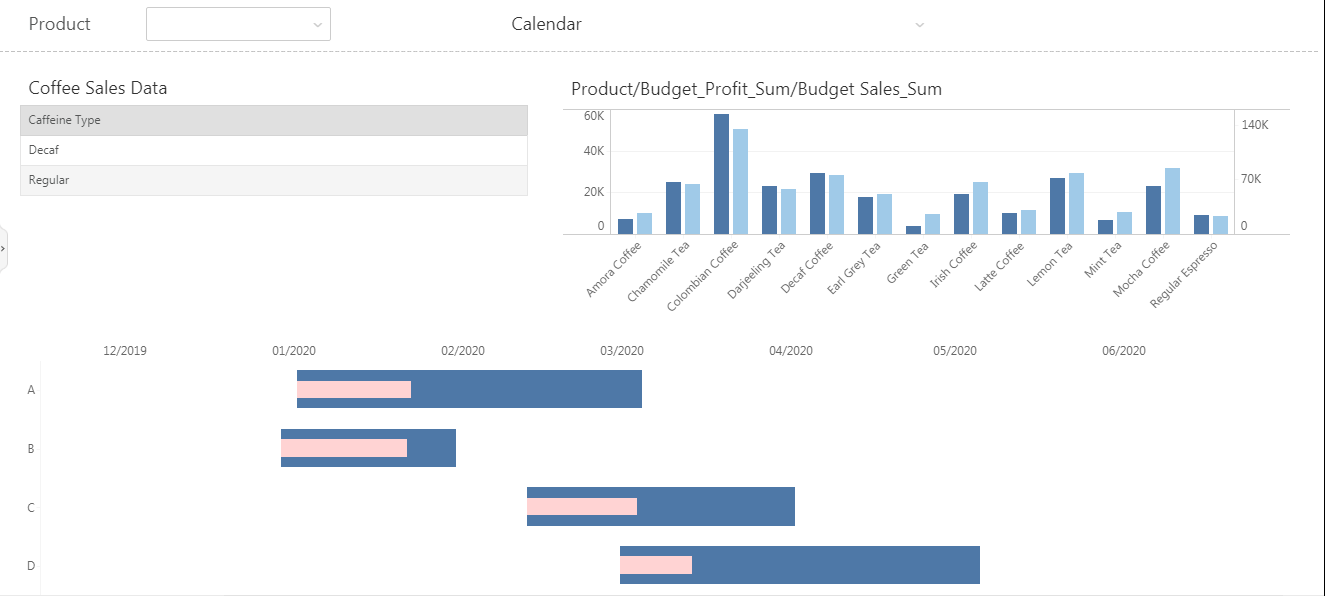
Support Global Filtering, Fixed the Filtering Area (V9.0.1)
The free layout of the new version supports the global filtering function, and the global filtering area is fixedly displayed and does not move as the dashboard slides. Global filtering could be set at the top or left of the dashboard, and supports drag-in filtering components, parameter components, text components, image components, and submit buttons.
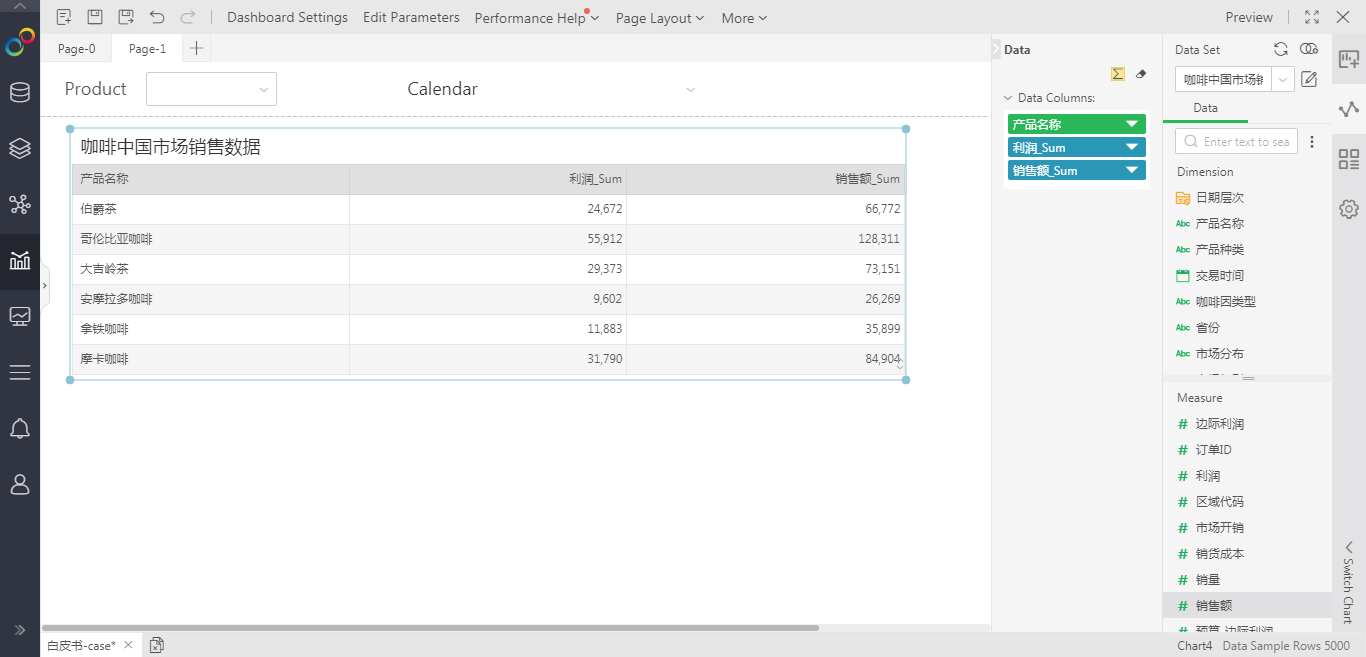
The Dashboard Supports Multiple Tabs, Which is Convenient for Dashboard Management (V9.0.1)
The free layout of the new version supports the function of multiple tabs. Multiple tabs can be set in a dashboard, which is convenient for users to manage dashboards. The tab bar can be displayed at the top and bottom of the dashboard. In addition, multiple tabs share a global filter. When adapting the width and height, the overall maximum width and height are used.
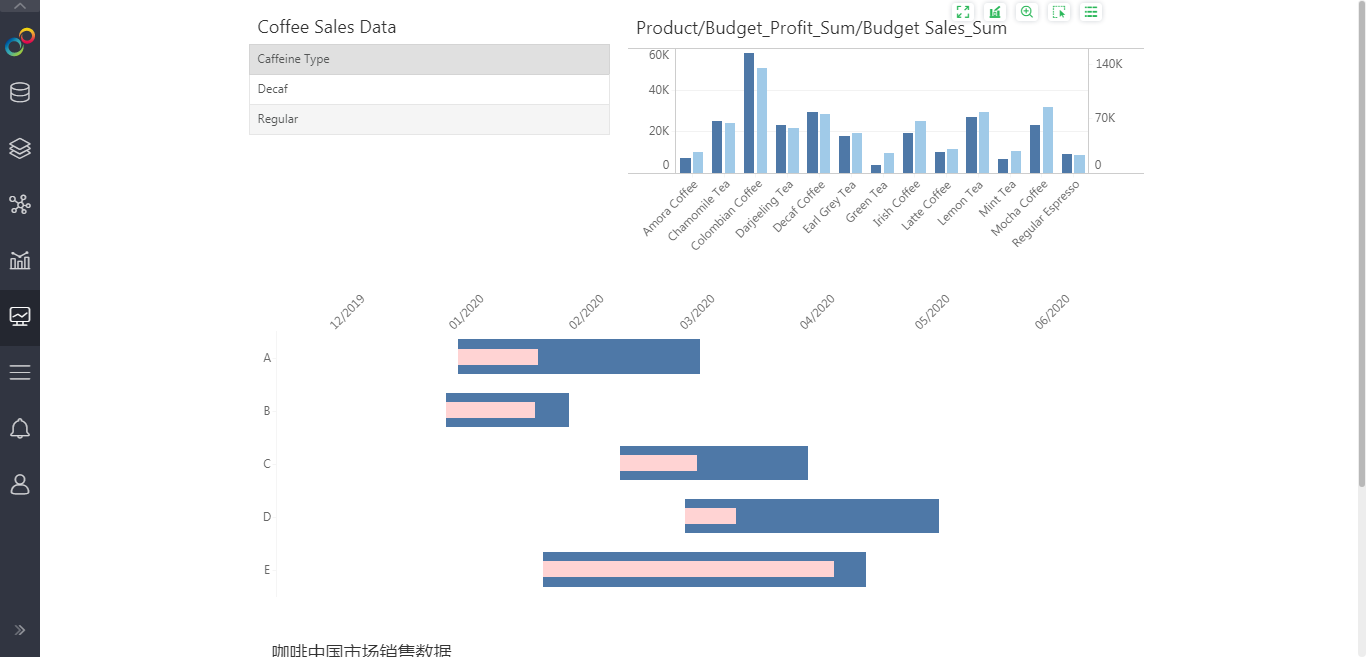
Optimization of Dashboard Scroll Bar Position (V9.0.1)
When the dashboard is not adaptive as shown in the figure below, the scroll bar is displayed on the right to optimize the interface display.
Index Page Supports Hiding Fast Learning and Function Introduction
The new version supports hiding the fast learning and function introduction modules. You can hide the fast learning and function introduction modules by configuring homepage.hiddens=fastLearning,instruction.
Interaction Optimization of Script and Calculated Column
In the script and calculated column editing interface, double-click the entered function, and the corresponding explanation of the function will be automatically displayed, which improves the ease of use.
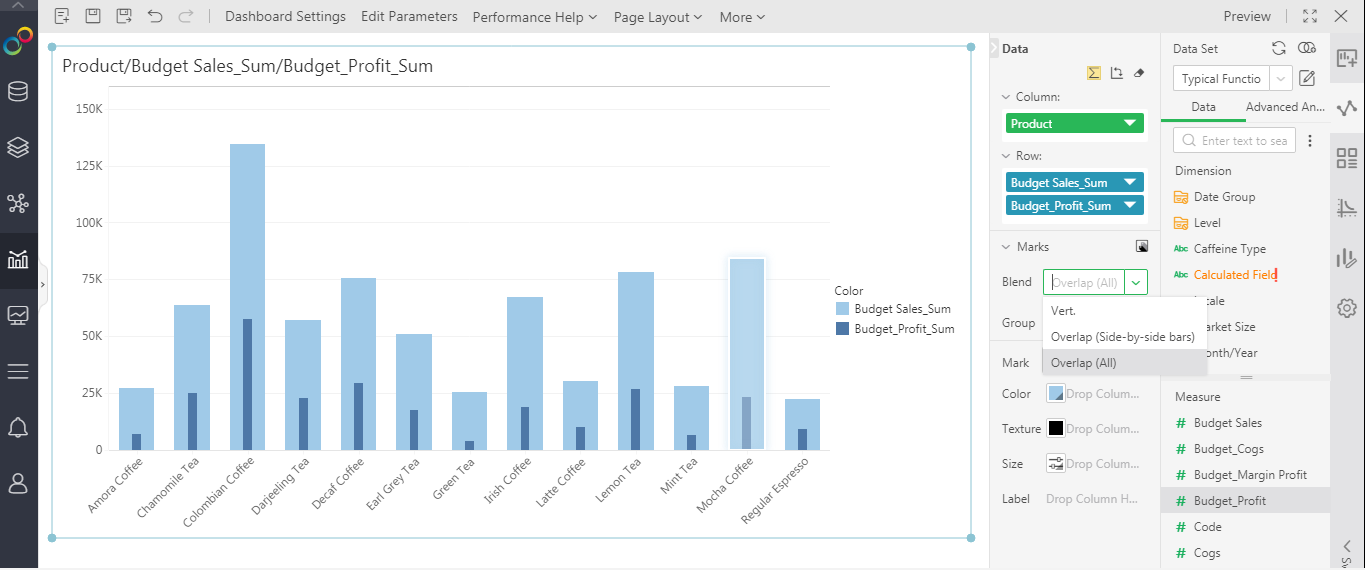
Support Columns Stacking to Meet the Analysis Scenarios of Metric Value Comparison
Support the effect of stacking columns in the same dimension to compare the metric values. At the same time, it can be used to make bullseye chart.
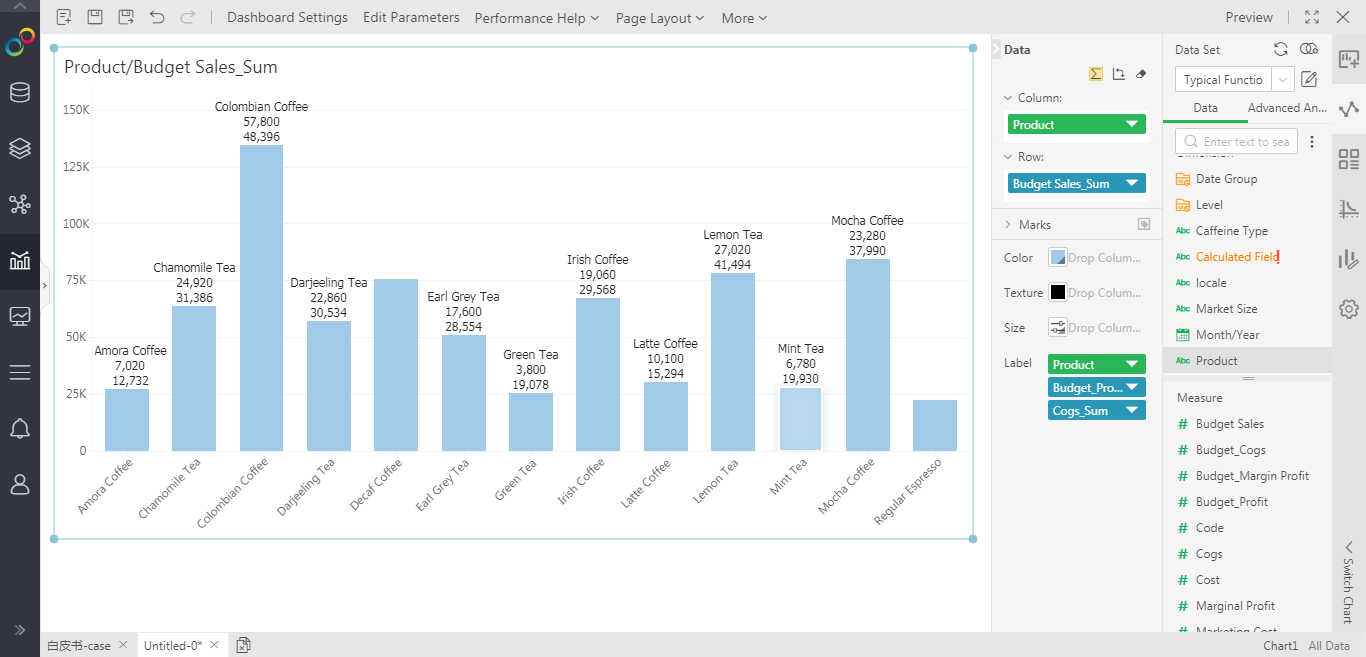
The Chart Label Supports Binding Multiple Fields to Display More Data Information
The "label" at the "label group" of the chart type supports binding multiple columns, and the maximum number of binding columns is 10.
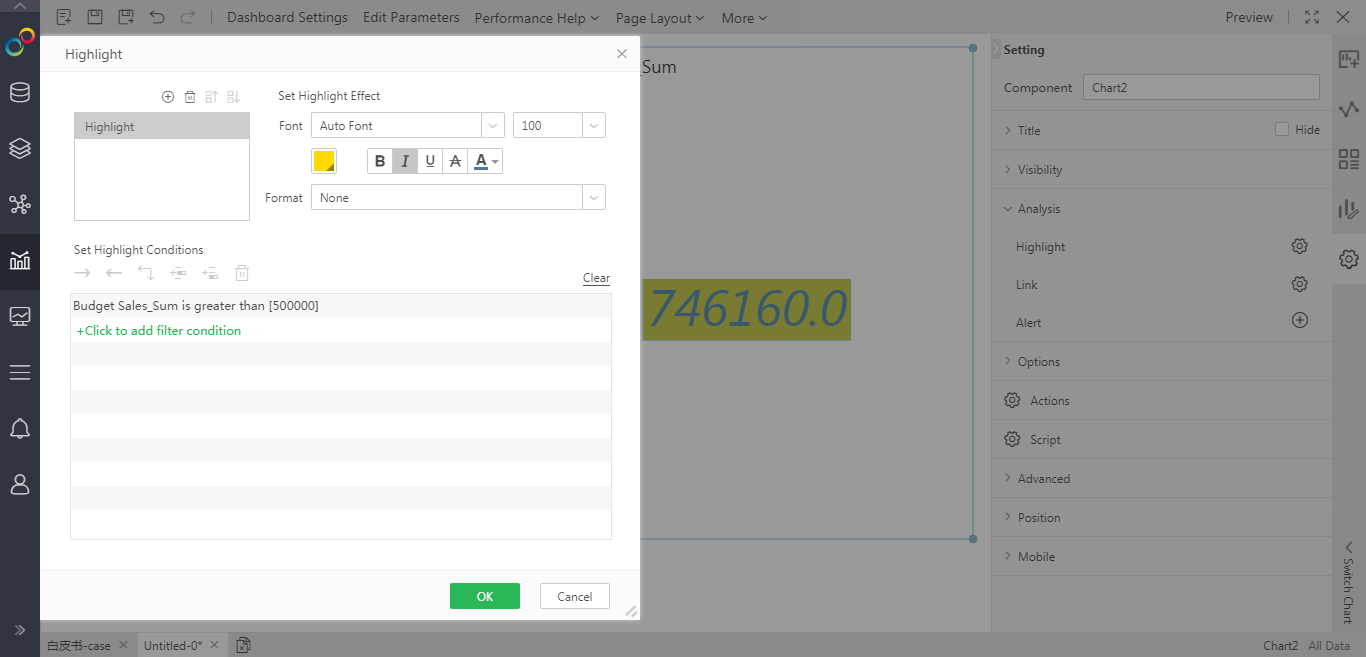
Indicator Card Supports More Highlight Formats
The indicator card provides a richer text style for the highlight setting of the numerical mark.
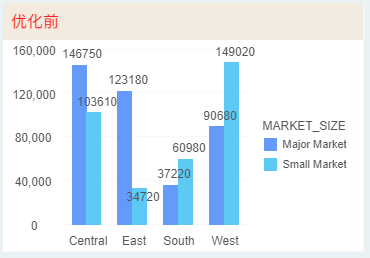
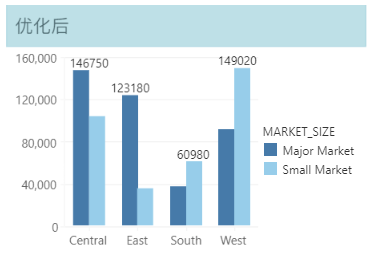
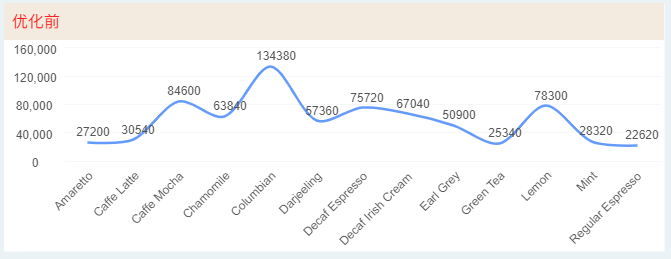
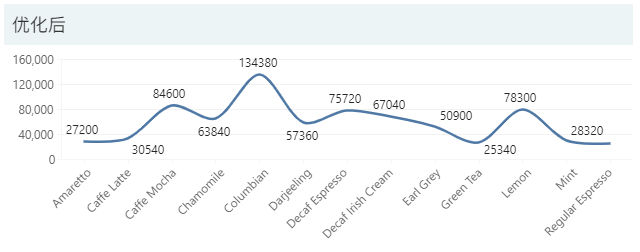
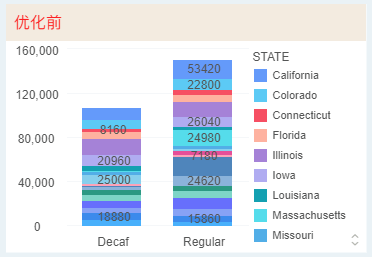
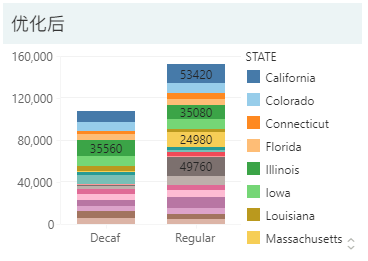
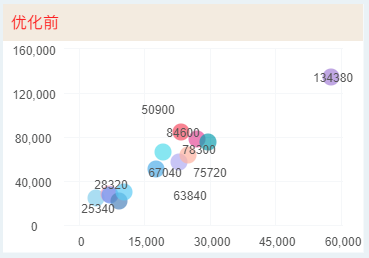
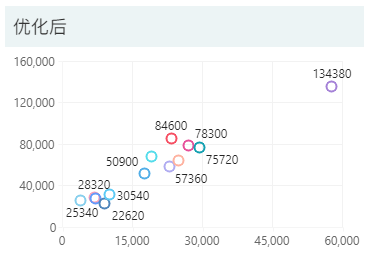
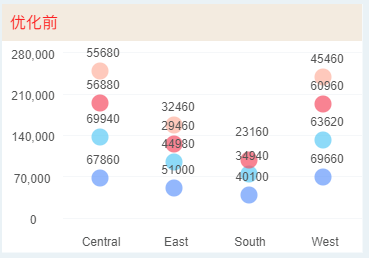
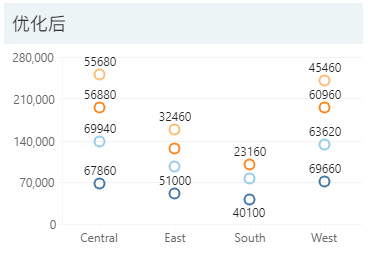
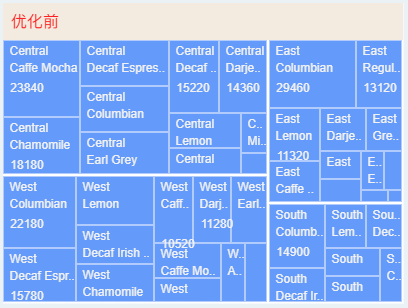
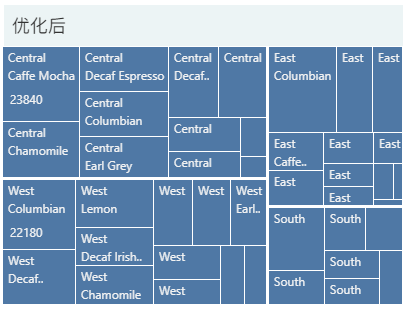
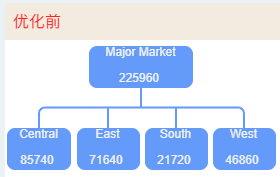
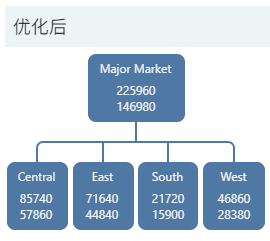
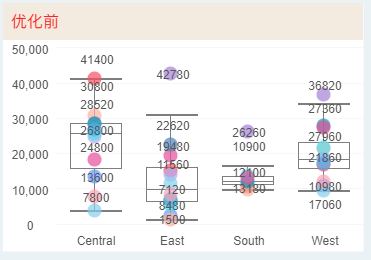
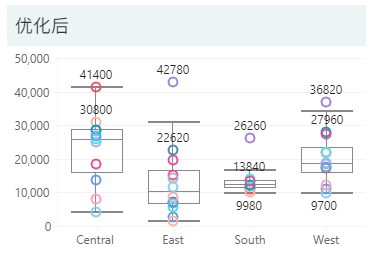
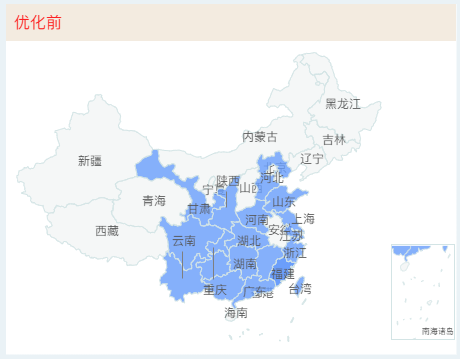
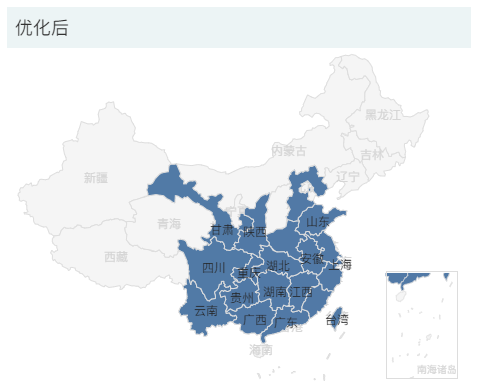
Optimized Algorithm for Intelligent Display of Chart Labels
The algorithm is optimized for the label "automatic" display of the chart types such as bar, point, line, area and the corresponding stacked type, box and whisker chart, radar, rectangular tree chart, organization chart, and map.
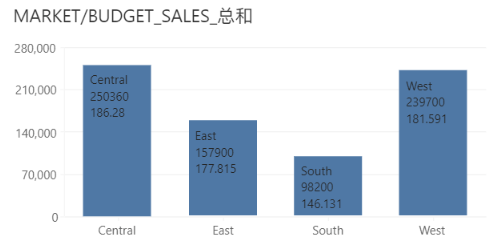
Labels Support Alignment
Yonghong's self-developed chart supports the label alignment function, which can be based on the relative position of the label and the graphic, and the alignment relationship between multiple labels.
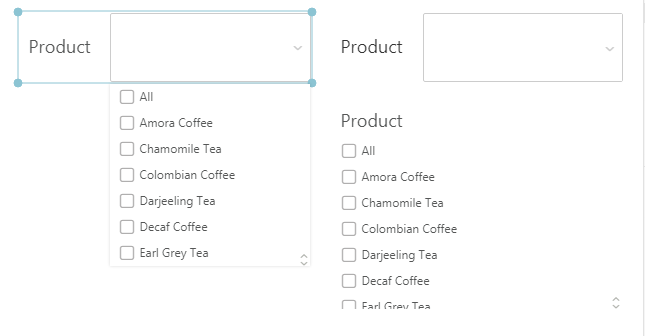
Uniform Style of Drop-down Parameters
The drop-down layout of the filter/parameter component is consistent with the style of the drop-down parameter component.
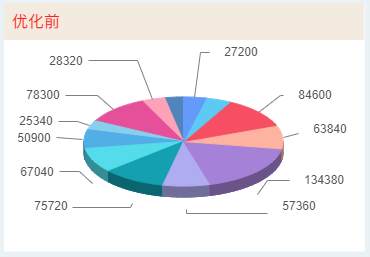
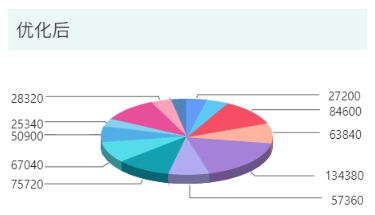
Guide Line Style Optimization of 3D Pie Chart
Optimize the guide line style of the 3D pie chart so that it has the same display logic as the normal pie chart guide line.
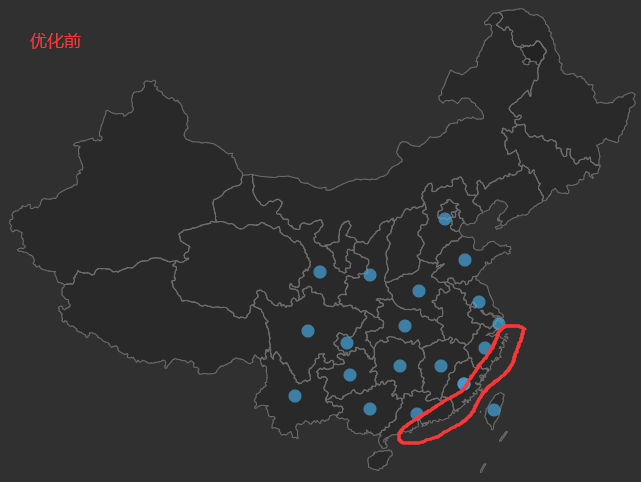
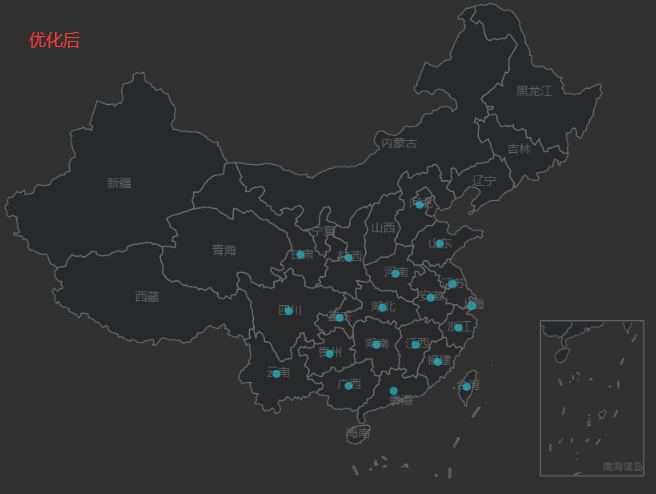
Display Optimization of Yonghong Autonomous Map Boundary
Smooth display optimization for the boundaries of Yonghong's autonomous map, including continents, China, the United States, Japan, Australia, Canada, and Singapore.
Add Color Divergence
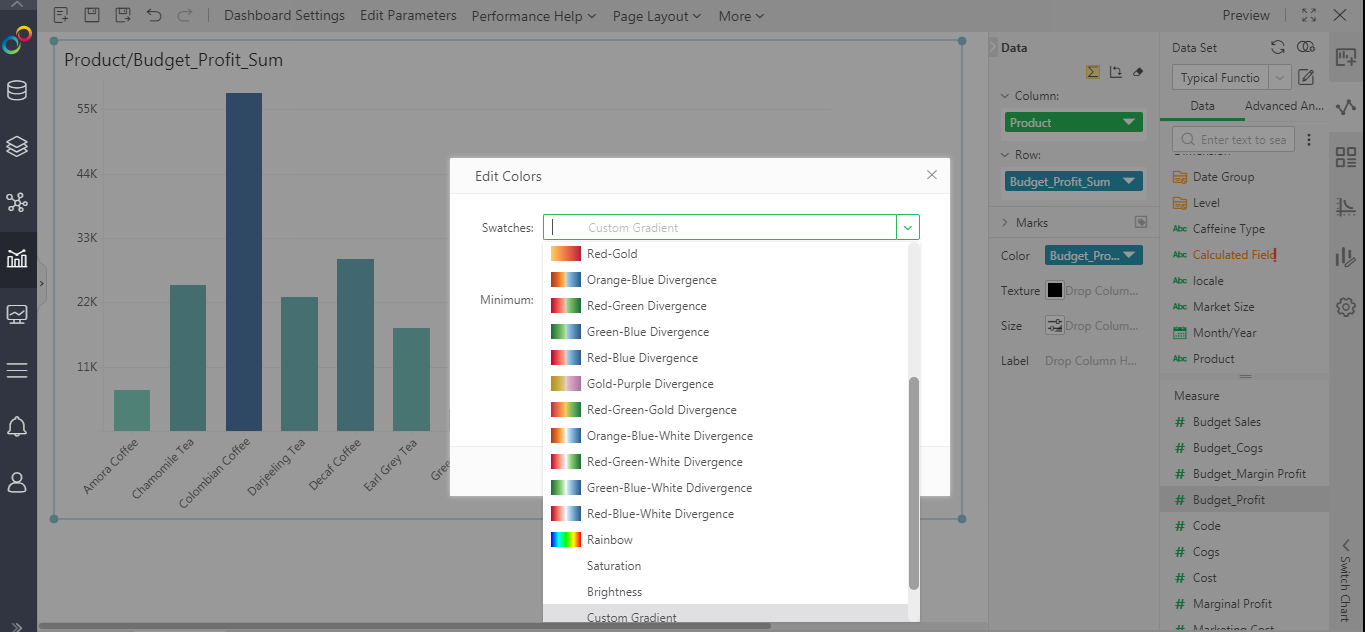
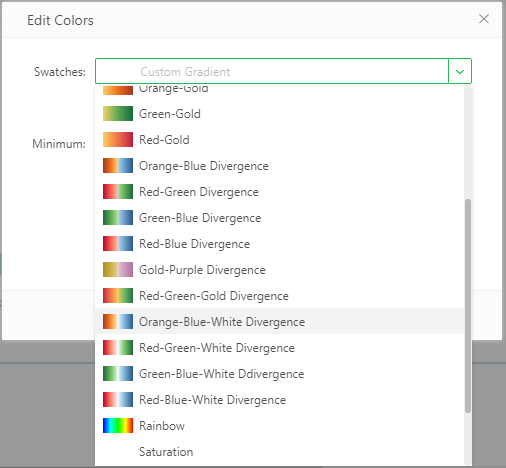
Adds a new form of color-"divergence". Not only built-in multiple divergent color templates, but also supports user-defined divergence, and provides setting divergence effects in custom themes.
Add More Built-in Color Schemes
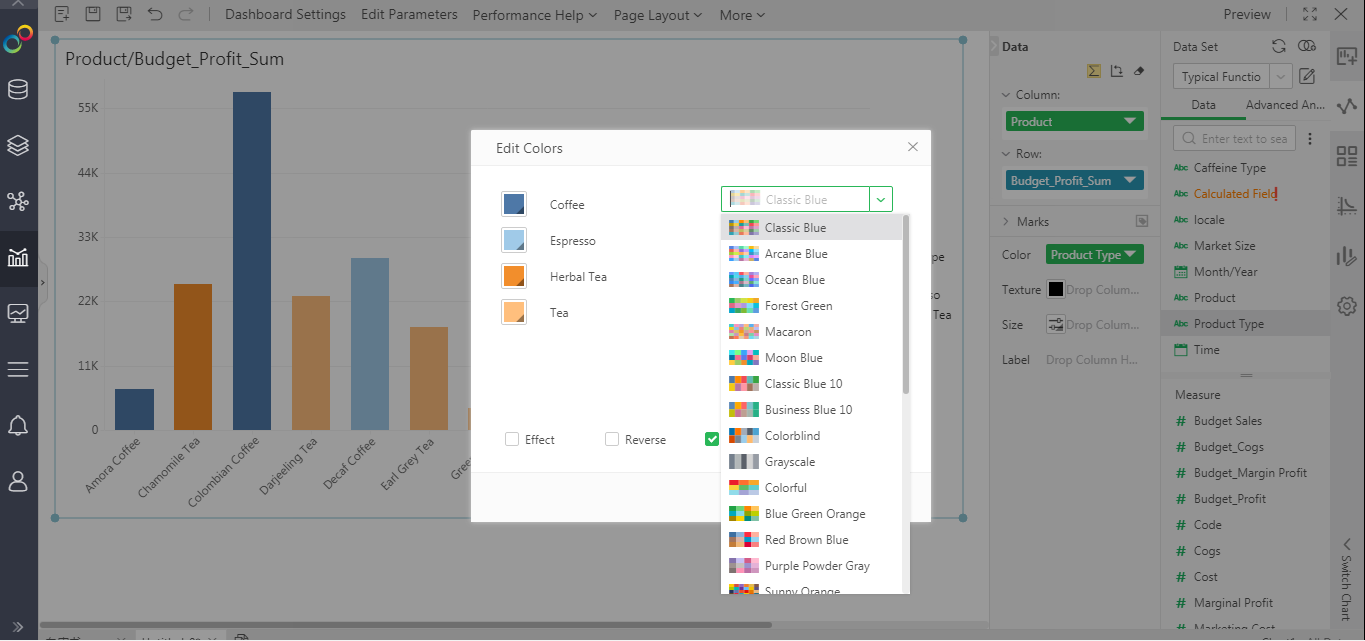
The discrete color edit box adds multiple sets of built-in color schemes, including monochrome and gradient color schemes. It also includes more friendly color-blindness, grayscale and other special scene color schemes to meet the needs of different color-matching styles.
Optimized the Layout of the Color Matching Edit Box of the Measurement Column
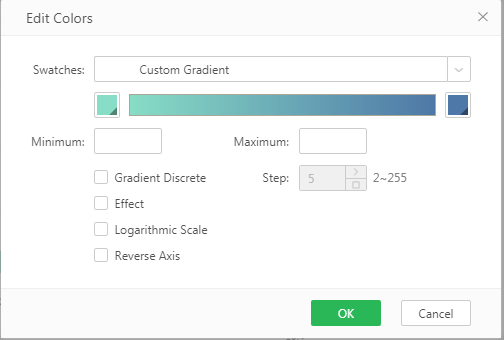
Adjusted the functional layout in the gradient edit box, incorporated the original color setting into the "color palette" drop-down option, added multiple sets of built-in gradient schemes, and optimized the gradient color display effect.
Optimization of Color Gradient Algorithm for Dimension Column
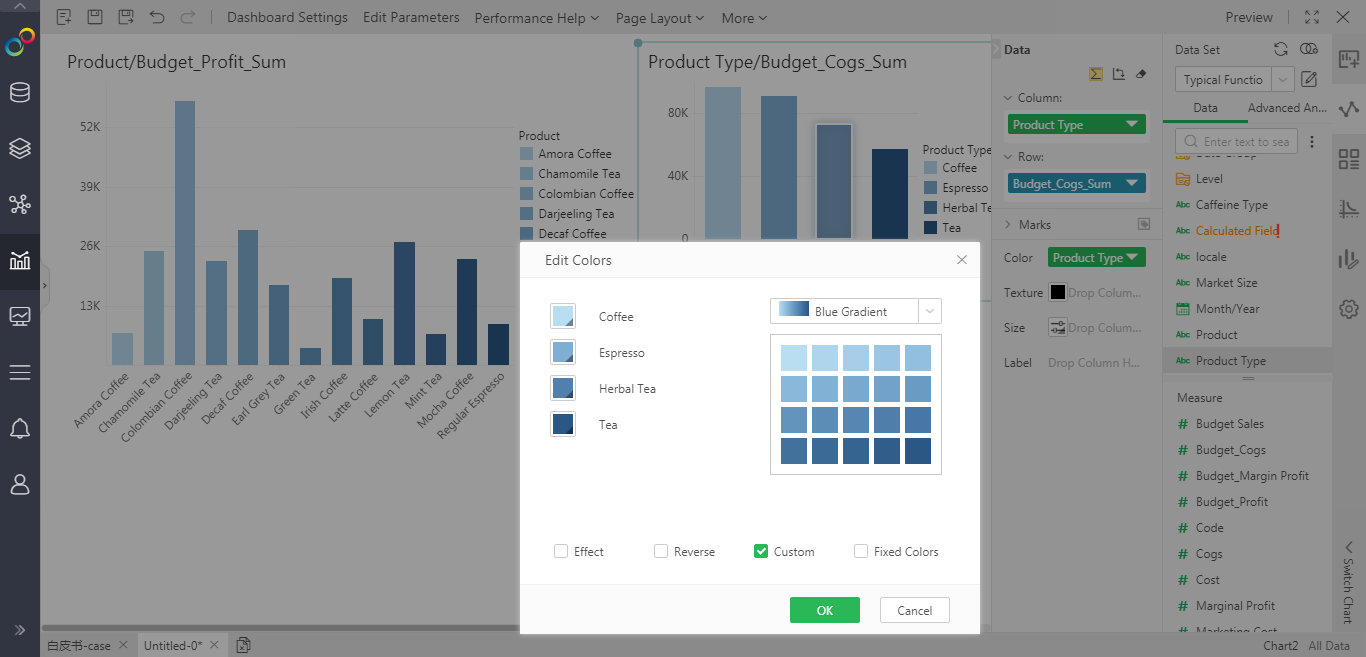
Optimize the gradient color scheme of the dimension column so that it can perform "dynamic" color matching according to the number of dimensions.
Optimization of Discrete Display Area of Dimension Column Color
The color scheme increases the preview icon, and at the same time increases the length of the drop-down display area to display more preview color schemes.
3. Reporting Form
The new version adds a lightweight reporting function. The lightweight reporting system is a form-filling system that supports high concurrency, supports enterprise customized services, and has a friendly interface and interaction. It can meet the scenarios of registration, questionnaire survey, online evaluation, activity voting, online examination, online order, invitation letter, filling in form and data storage.
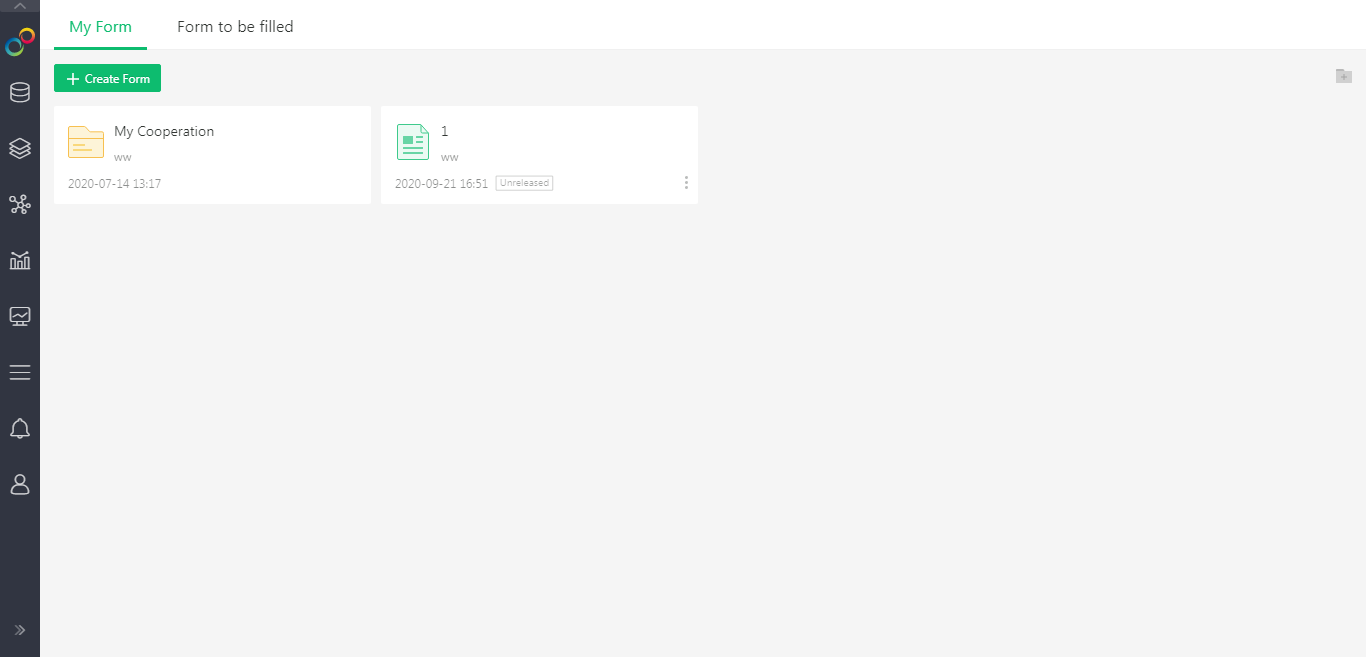
Form Management Supports Card-style Files and Shuttle Folders
Support Rich Components
Including single-line text, multi-line text, numbers, date and time, radio buttons, check boxes, drop-down boxes, pictures, text descriptions, addresses, positioning, etc., and supports rich settings to meet various demand scenarios.
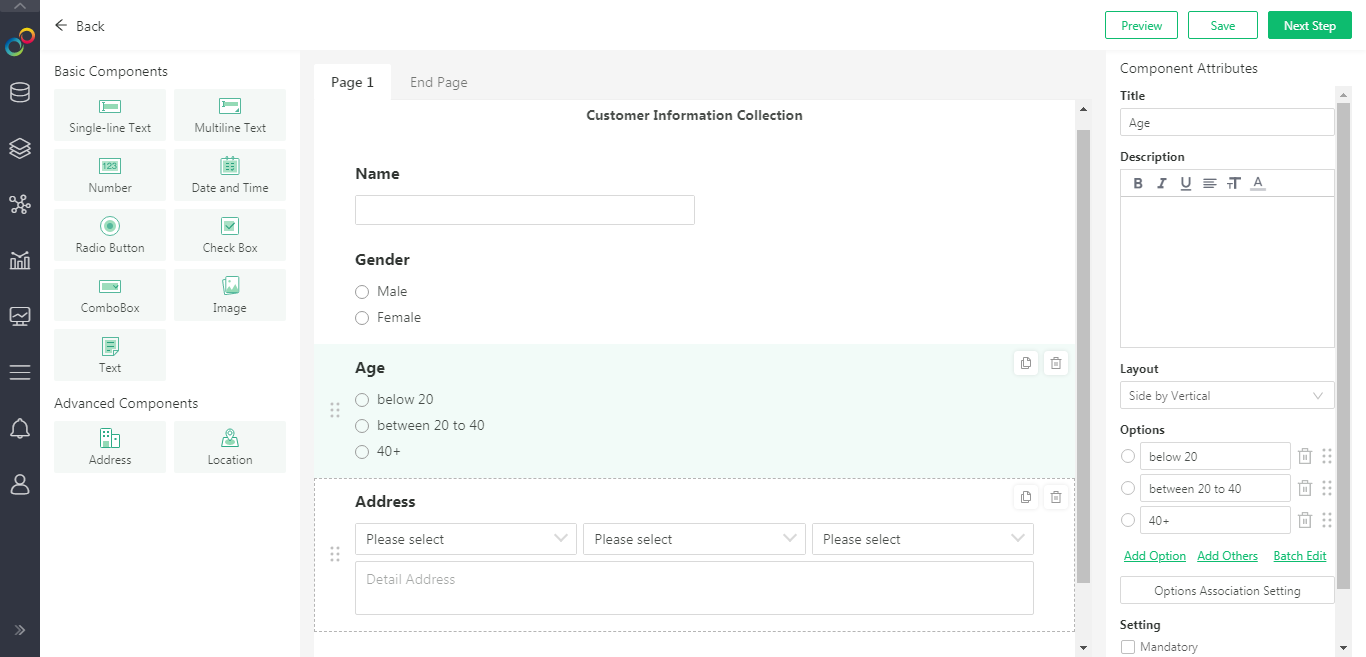
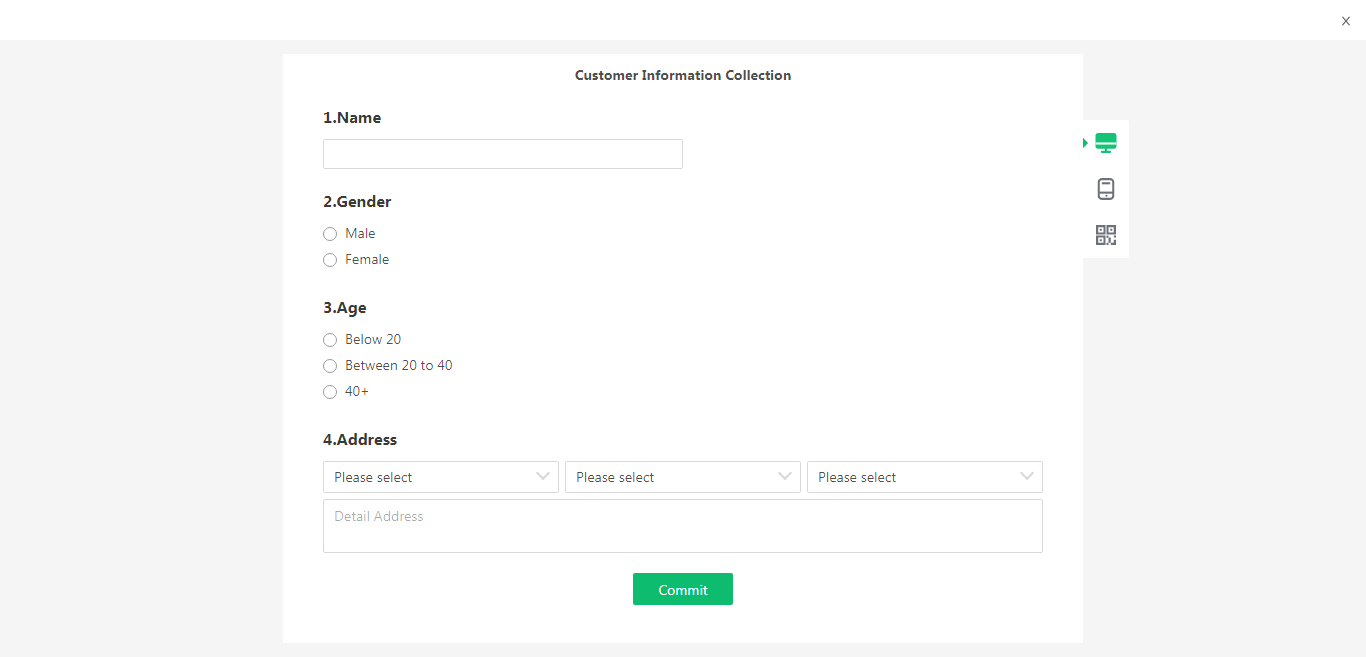
Support Real-time Preview of the Output Effect on Computer and Mobile Terminal
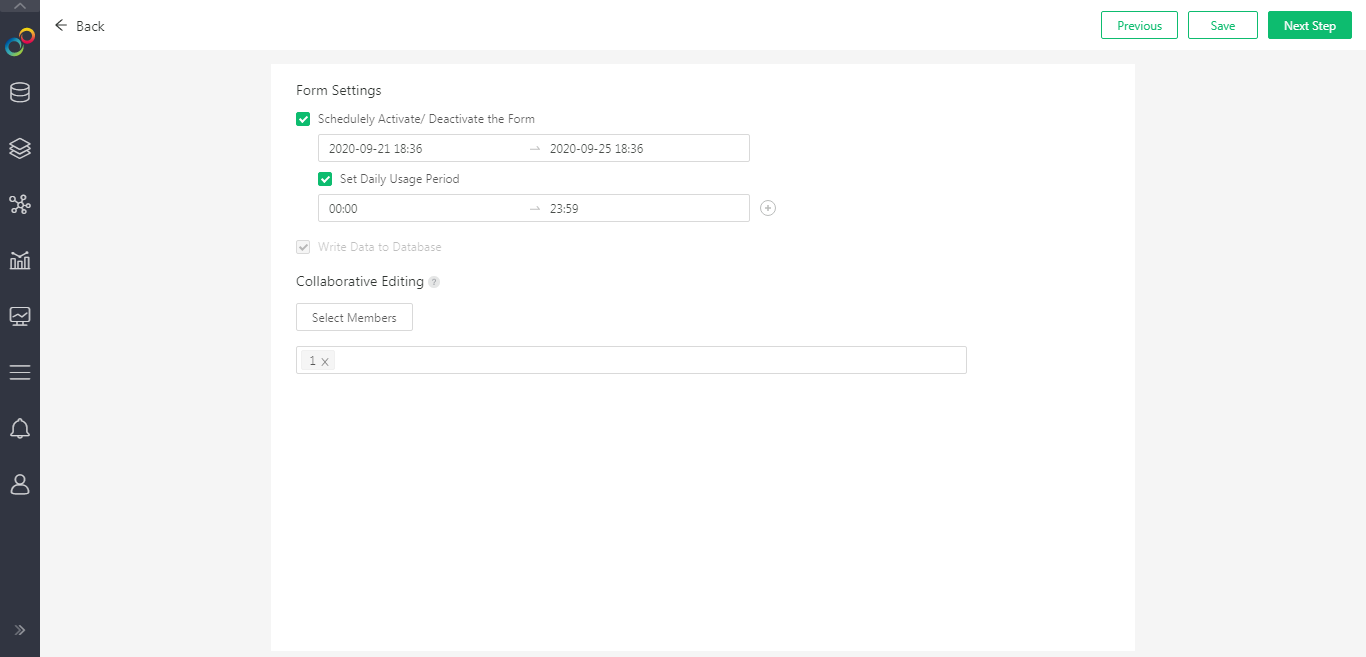
Support Control Data Collection Time by Setting the Start and End Time
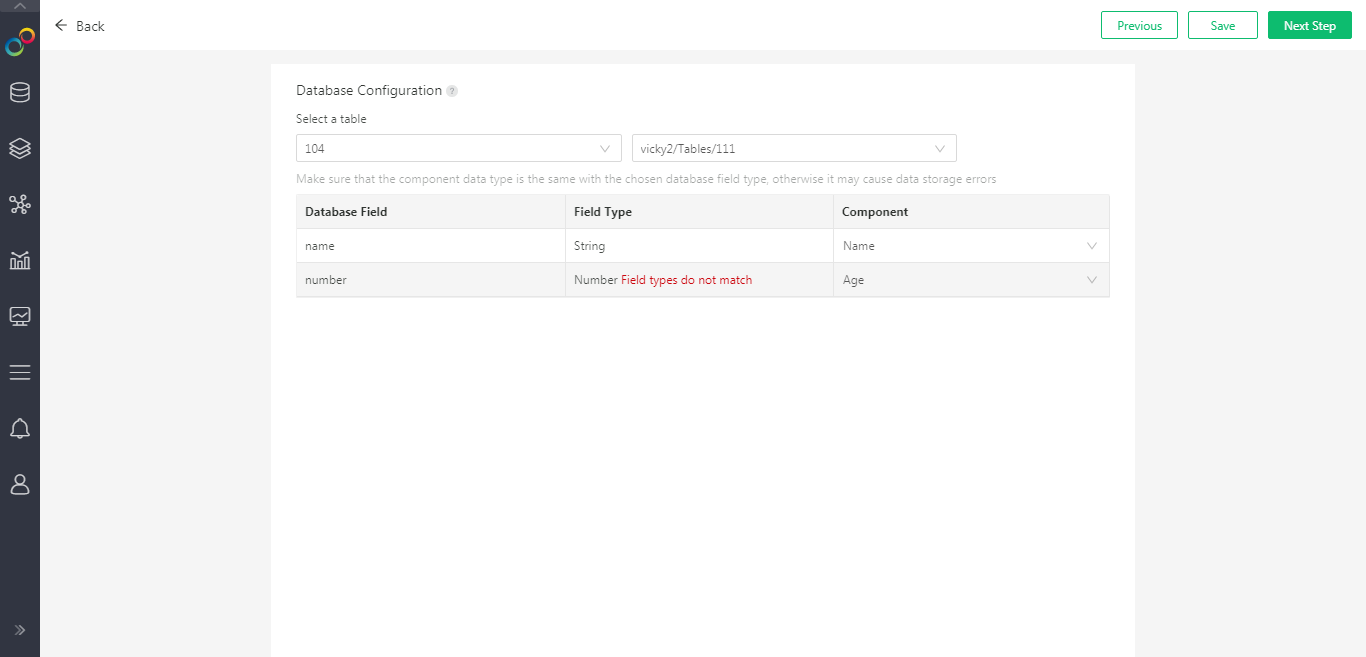
Support Directly Filling in the Database to Facilitate Data Management
Support Setting up Collaborative Editors to Improve Office Collaboration Efficiency
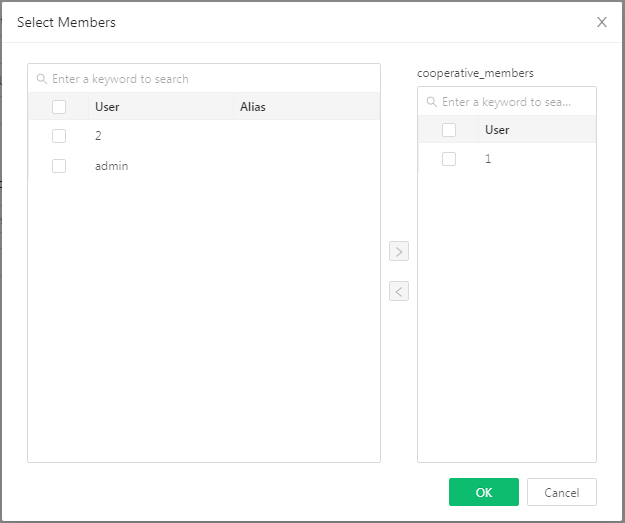
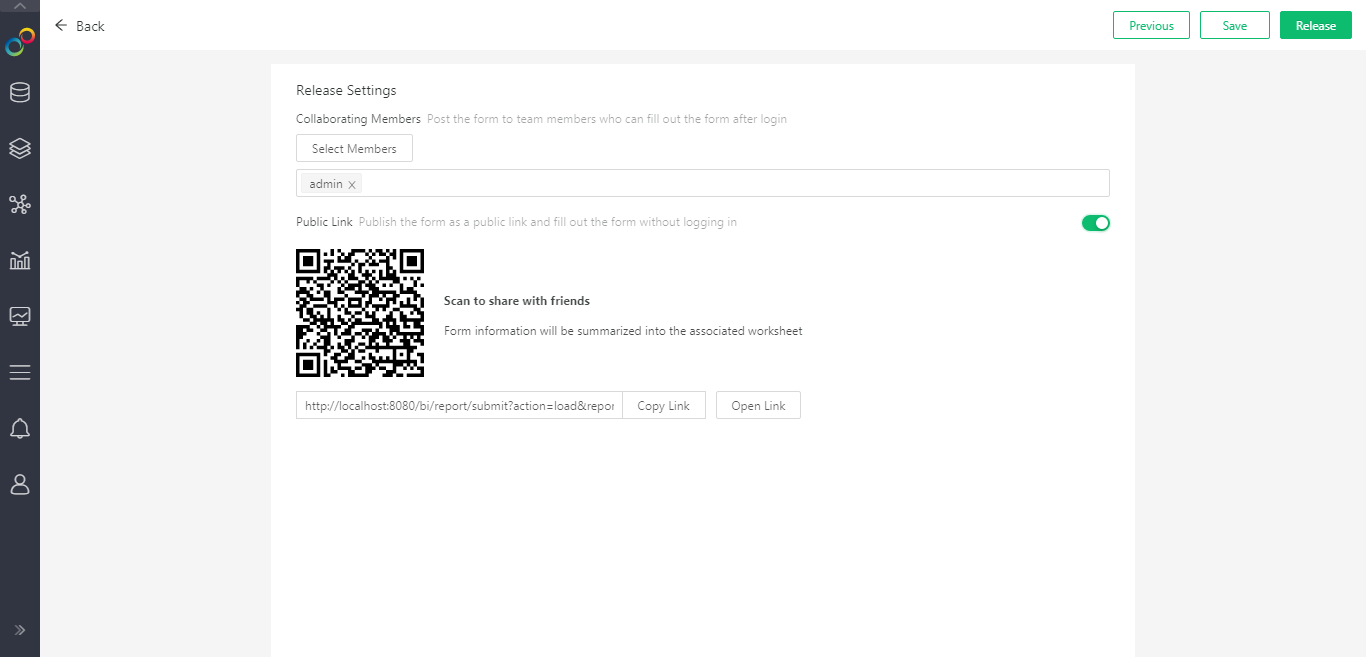
Support Both Inner Release and Public Release
Inner release means only the system users could fill in the forms. While public release means everyone who get the url could fill in the form.
4. Advanced Analytics
Support Plug-in Operators to Improve Scalability
The new version supports the installation of operators into the advanced analytics module in the form of plug-ins. We provides many built-in operators, which can be used through permission control. Users can also develop their own plug-in operators and install them into the system according to their needs.
The plug-in operators are all binaural operators, and users can write algorithm names, algorithm function descriptions, parameter lists, independent variables, dependent variables, output lists, etc. as needed.
The plug-in operation directory includes data transformation, statistical analysis, algorithm, model integration, verification and evaluation, and also supports user-defined plug-in folder names.
If the experimental data is changed, the operator that has been run can reset the result of the execution, and use the new data to perform the calculation again.
Add Running Records to View the Running Result
After running the experiment, select the running record in the menu bar-more, you can view the running result of the experiment, including the start\end time of the run, the running time, the running result, the operator and the running information, so as to facilitate the understanding of the historical running of the experiment .
Support Get Data Through Restful API to the Experiment
Add WEB service in operation, including REST request and REST response node. After dragging the node into the canvas and connecting nodes, select the service configuration in the menu bar-more, enter the parameter code to get the experiment result, and debug it. The experiment can be deployed through the API interface and API key provided by the parameter configuration.
Some Experimental Tasks of Advanced Analytics Support Execution Through Scheduling Tasks
Scheduling task supports tasks of advanced analytics experiment type, including save as data set, export to database and deploy as REST service.
Realize the Recovery of Unsaved Experiments
When the entire browser is closed or the browser crashes and exits, the unsaved experiment would be automatically saved and be recovered when the advanced analytics module is opened again. The user can select the experiments that need to be restored.
Realize Automatic Layout, Make the Experiment Layout Neat and Clear
The automatic layout is added to the top navigation bar, which can realize the neat and clear layout of the nodes in the canvas, which is convenient to view and use.
5. Enterprise Management
Support Data Download, Which is Convenient for Desktop Version to Do Offline Data Analysis
The 9.0 version is one step closer to get through the server and desktop, and supports downloading data packages from the server to the local, and then use the desktop version to open it with double click. After the analysis is completed locally, the analysis results can be uploaded back to the server.
•Data download
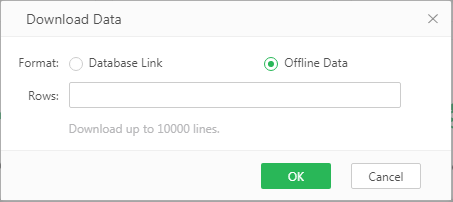
Two forms of data download is provided: database connection and offline data.
All data sets with read permission support downloading offline data, which can be used for offline analysis when there is no network. Downloading offline data requires the user to enter the number of lines to be downloaded. The administrator can set the maximum number of lines that the user is allowed to download. The default is up to 10,000 lines. When downloading offline data, it will perform rank filtering and data desensitization first, and extract the specified number of rows from the execution result.
If it is SQL data set and Mongo data set without adding row and column filtering and data desensitization, it also supports downloading database connection, that is, the data set and dependent connection, and access data by the connection on the local machine. The administrator can set whether to clear the password for the downloaded data connection, which is cleared by default to prevent users who don't know the database connection configuration from arbitrarily derivative locally.
•Resource files
After the server downloads the data to the local, a file with the suffix yhqry will be generated. If the desktop version is installed locally, you can directly open the file by double-clicking it (you need to right-click to open it in the linux system). When opening, the system will detect whether there is a resource with the same name locally. If there is the file with the duplicate name, user could decide whether overwrite the old file and open the new one or give up opening.

•Security control
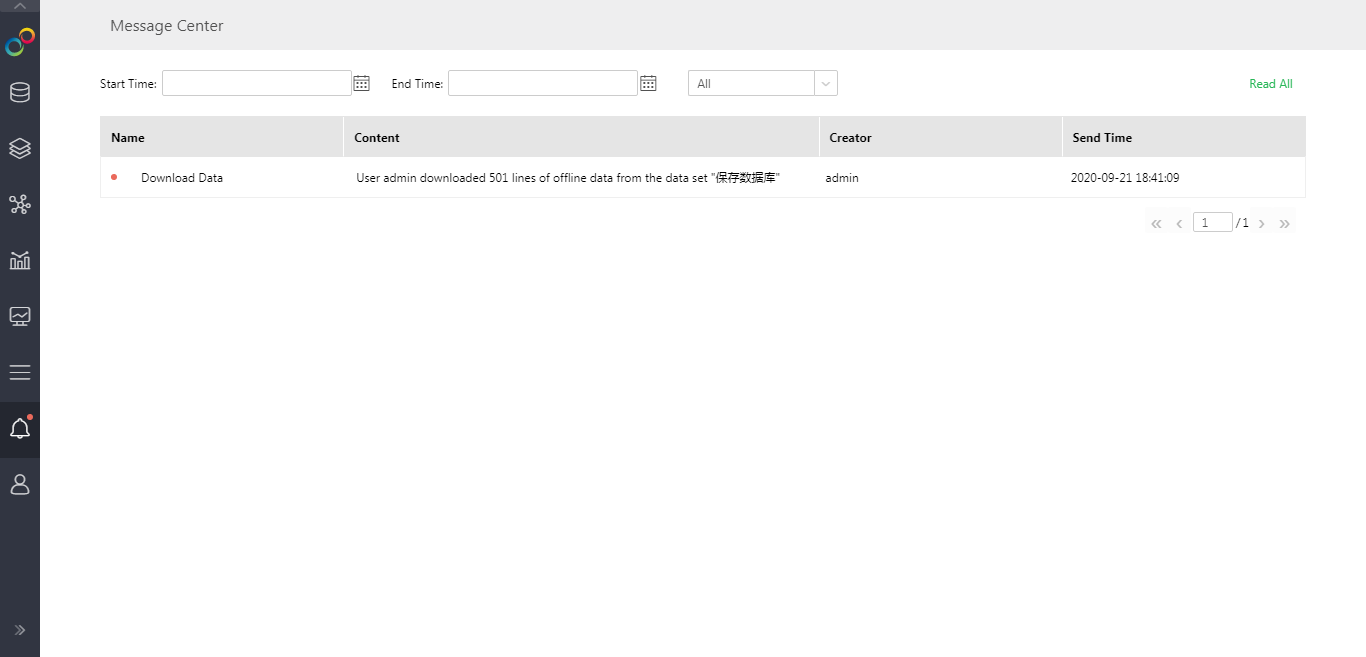
Whether users can download data is controlled by the operation authority. After downloading the data, a message will be sent to the administrator, and the download details will also be recorded in the monitoring system user operation statistics.
User Information Interaction Optimization in Group and Role Management
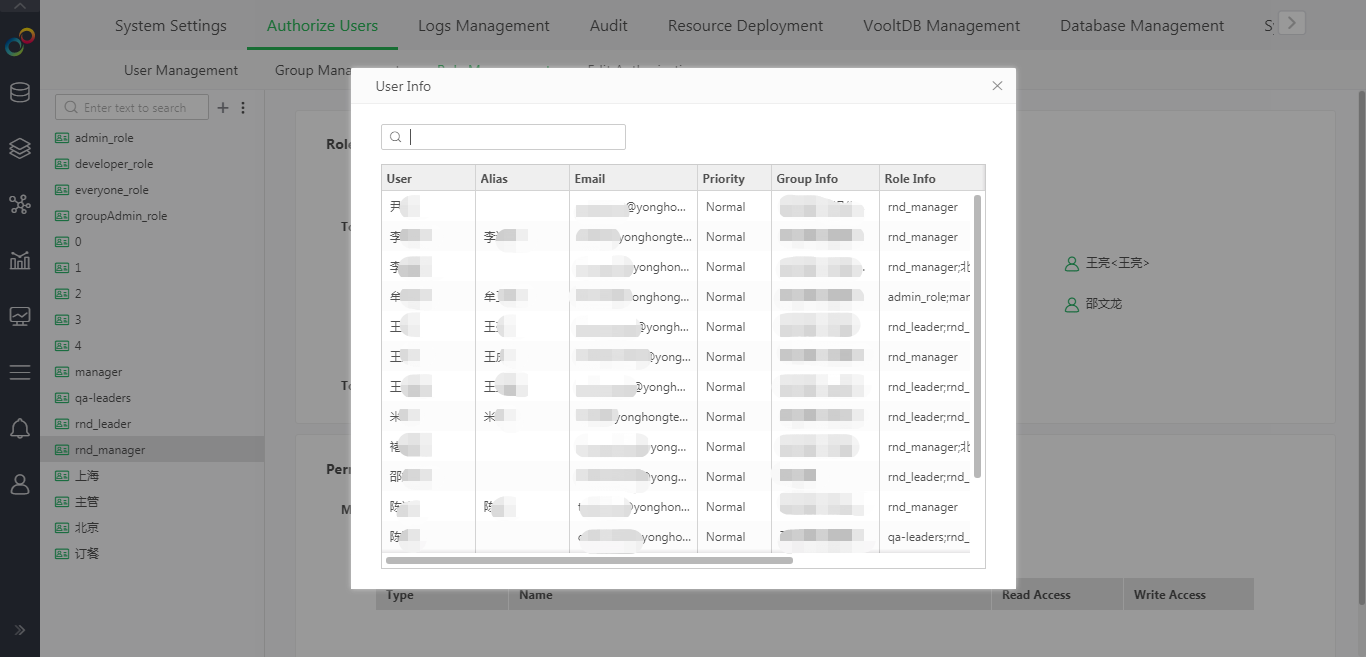
Optimized the user information dialog on the group management and role management pages. In addition to the previous user name and nickname, the new version will also display the user's information such as mailbox, priority, group, role, custom attribute, etc., so that the administrator can review whether the user settings are correct when maintaining groups and roles.
Optimize LDAP to Meet Different Scenarios of User Synchronization
The organizational structure in the LDAP of some customers is different from the organizational structure in the system. Version 9.0 adds the parameter ldap.group.synchronize. When the value is false, LDAP synchronization will not modify the group of existing users in the product.
Yonghong X-Suite Launches Database System and High-availability Solution: X-Backup
X-Suite supports database system and high availability. Unlike Z-Suite, X-Suite's high availability solution supports two servers. You need to set one as the primary node and the other as the secondary node and configure load balancing. The data space is configured with the same database system.
When both servers are available, the user's access will be forwarded to the primary node, and the secondary node is in the standby state at this time. When the primary node fails and becomes unavailable, the secondary node is enabled. When the master node returns to normal, it will automatically switch back to visit the master node.
If X-Suite needs high availability, purchase X-Backup separately.
Verify the Administrator's Password when Changing User's Password
Increase the parameter password.security.check=true/false, the default is false. When modified to true, when admin, admin_role, groupadmin_role modify/reset user passwords on the user management page, you need to verify your identity first: enter your password. The user password can be saved only when your administrator's password is correct.
6. Big Data
New Generation of Data Processing Engine, Greatly Improving Computing Performance (V9.0.1)
The big data processing engine of the 9.0.1 version will no longer divide into the CNMR node, but into the C node and the Vooltdb node. The vooltdb node will undertake the calculation tasks of the data mart, and the computing performance will be greatly improved compared with the old version.
The installation and management of the Vooltdb node are all operated on the C node. For a multi-server cluster environment, the Vooltdb node may or may not assume the role of the C node; for the local data mart, the vooltdb node also needs to assume the role of the C node. Desktop products will install vooltdb by default, and other products need to be installed manually by the administrator.
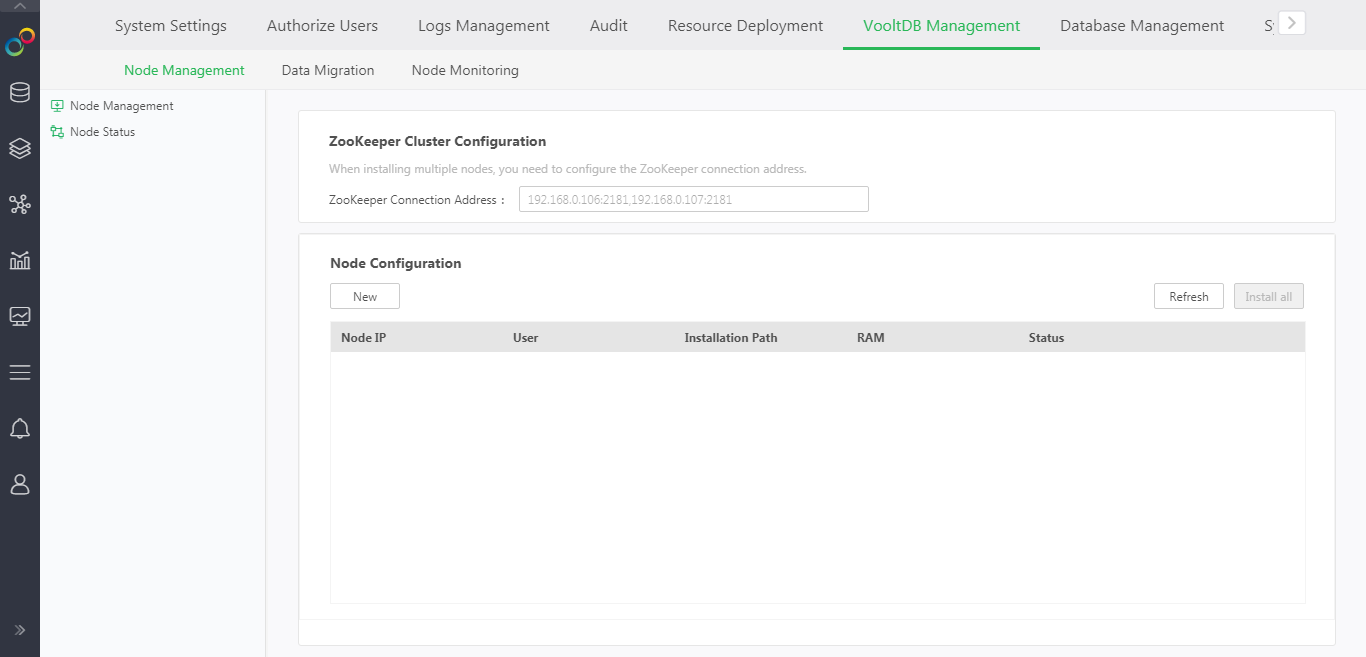
In order to use the vooltdb more conveniently, the management system adds the vooltdb management module, including:
(1) Node management
The node management module can add and delete vooltdb nodes, modify node configuration, etc.
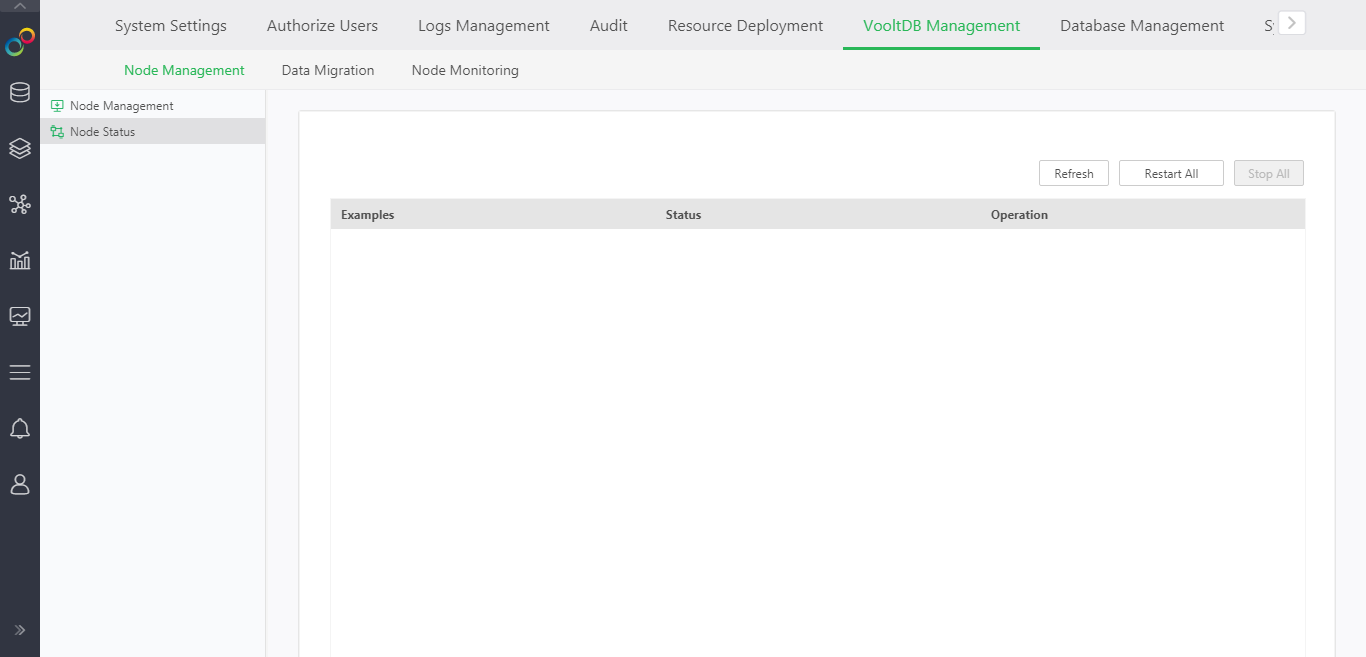
(2) Node status
After the node is successfully installed, you can view the status of the node instance. If the node is down, it can be restarted through this module.
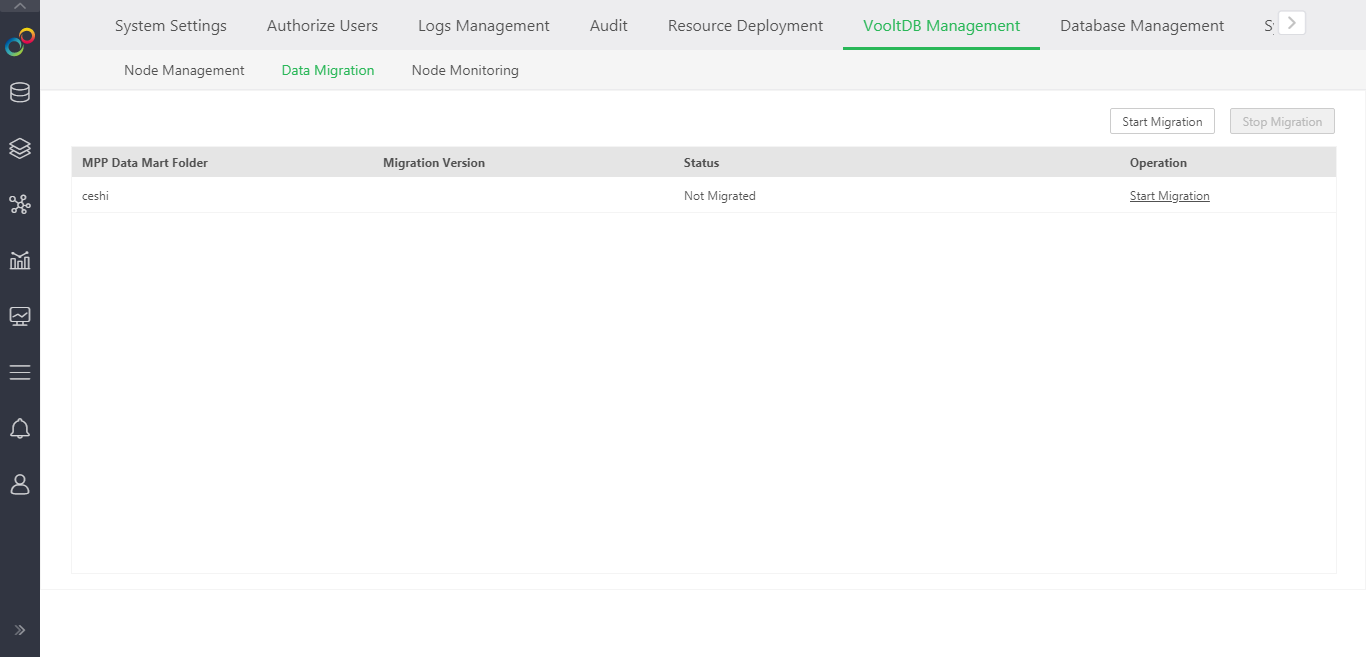
(3) Data migration
After upgrading from the old version to the version 9.0.1, the data in the previous mart can be migrated to vooltdb through data migration, so as not to affect the original data mart query.
(4) Vooltdb monitoring management
•Node occupied resources
Count the CPU usage, memory usage, disk usage, and network speed of the c node and vooltdb node.
•Data mart data set task information statistics
According to the mart folder to count the files that enter the mart regularly, the user can filter the mart folder and whether it runs successfully.
•Data mart folder information statistics
•Data mart file information statistics
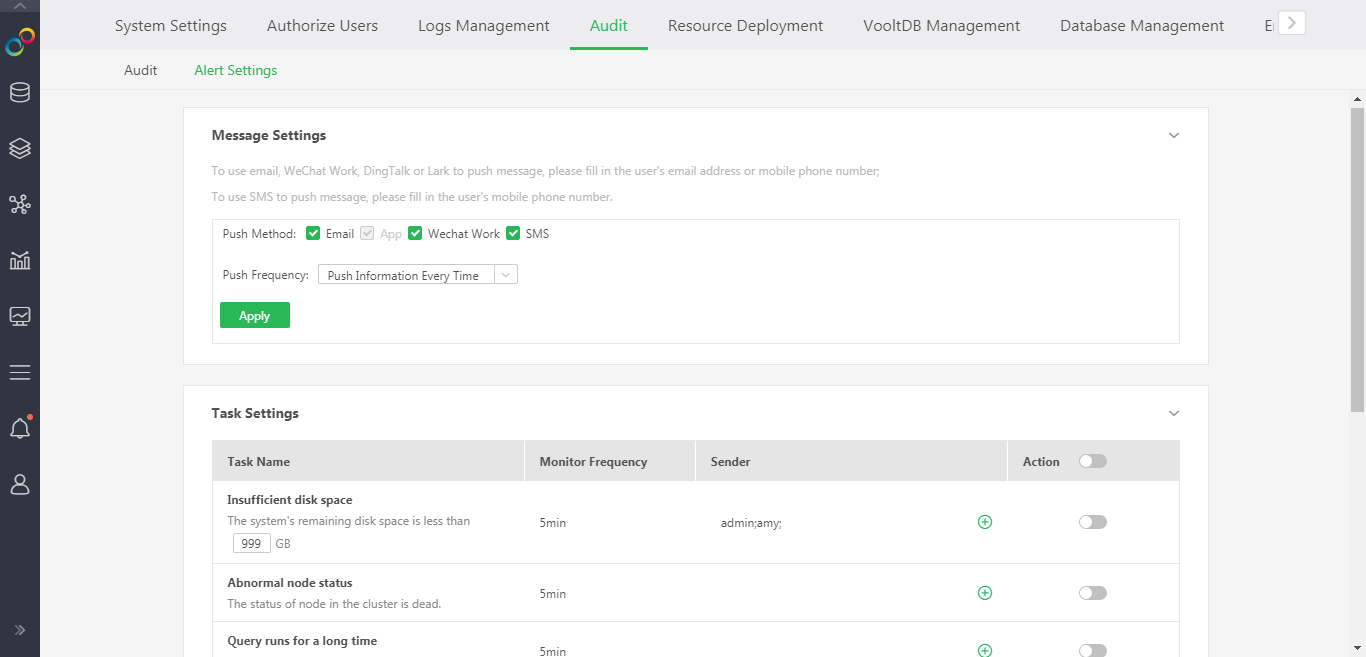
The early warning tasks of the new-generation data processing engine are basically the same as those of the previous mpp mart, including: insufficient disk space, abnormal node status, excessive query execution time, database downtime, account limit, FullGC too frequent, and CPU usage Too high, memory usage is too high.
Removed the network disconnection and node inconsistency.
Functional Enhancement and Ease of Use Optimization of Performance Detection
When making a dashboard in version 8.7, if the user's operations result in slow performance, a small red dot appears beside the "Performance Detection" to remind the user that this operation affects the performance, please modify it as suggested.
In version 9.0, the following optimizations are provided for the performance detection function:
1) The function entrance of performance detection is optimized as Performance Help -> Performance Detection .
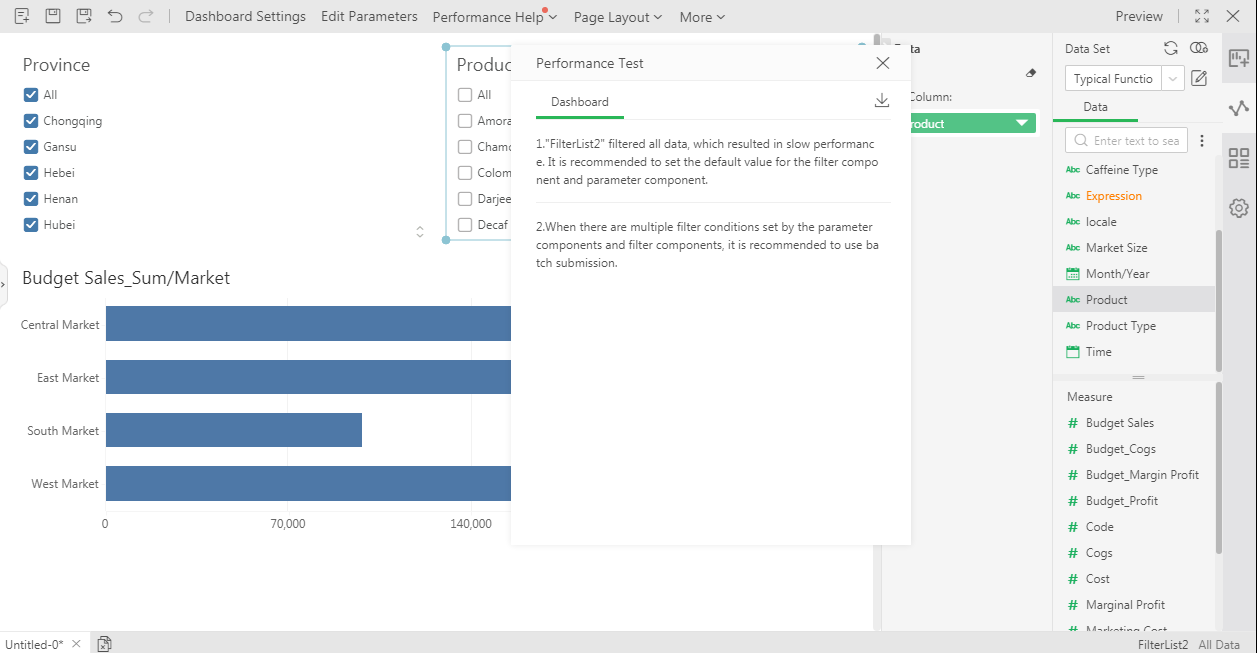
2) Some performance rules have been added to cover more performance issues.
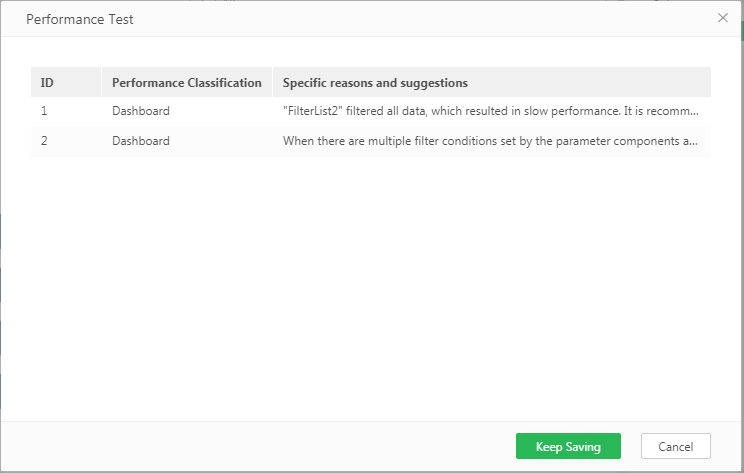
3) When saving or saving as a dashboard, the default pop-up box will prompt specific reasons and suggestions for the slow performance. (This box can be closed through db.save.performance.detail in the system settings)
New Dynamic Performance Analysis Report
The time to open the dashboard has always been the focus of users' concerns. Users care about the key steps of opening a dashboard, the execution time of each step, which step is more time-consuming, and then take certain measures to reduce the time-consuming steps. In version 8.7, we have supported the needs of this scenario. The 9.0 version further enhances this function, allowing users to analyze the data processing performance of the dashboard when making dashboards, and also allows administrator users to view the reasons for the slow opening of the dashboard in the monitoring system.
The dynamic performance analysis report includes two parts:
1) The top navigation bar -> Performance Help -> Dynamic Performance Analysis Report.
Currently, it will simulate the data execution process of opening a dashboard, and display the data execution process with a Gantt chart. The dashboard maker can clearly understand the whole process of opening the dashboard and the data execution time.
2) Monitoring system -> "Running resource information monitoring statistics" records the stage and time of data execution of each dashboard.
It is still controlled by audit.performance.record.limit, now the default value is 10*1000 (default unit ms),
When the execution data request time exceeds 10s, the procedure will be recorded by the monitoring system. The user selects the dashboard in the "Running Resource Information Statistics" and selects "Running Resource" as the indicator. Clicking it will see the running time analysis of the execution process of each dashboard.
7. App
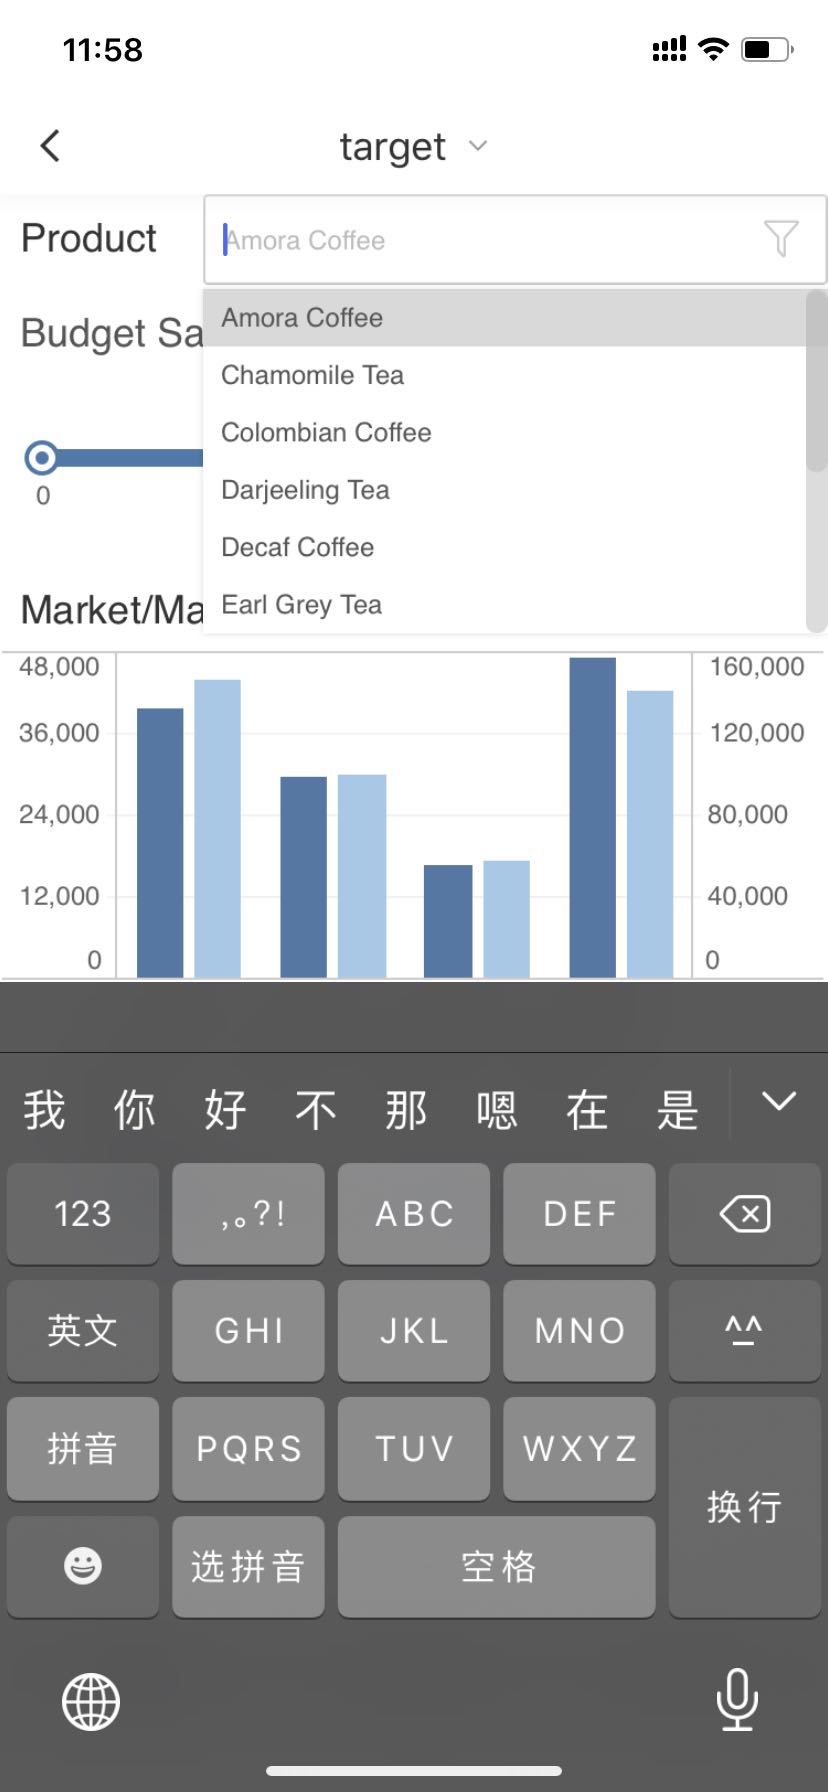
The Drop-down Parameter Component Supports Changing to the PC Interactive Form(V9.0.1)
The drop-down parameter component supports changing to the PC interactive form through configuration. By default, mobile.fullscreen.textParamElem=true. Configure its value to false, you can modify the interactive form of the drop-down parameter component to the interactive form of the PC.
More Convenient to View the Data Analysis Results on the Mobile Phone
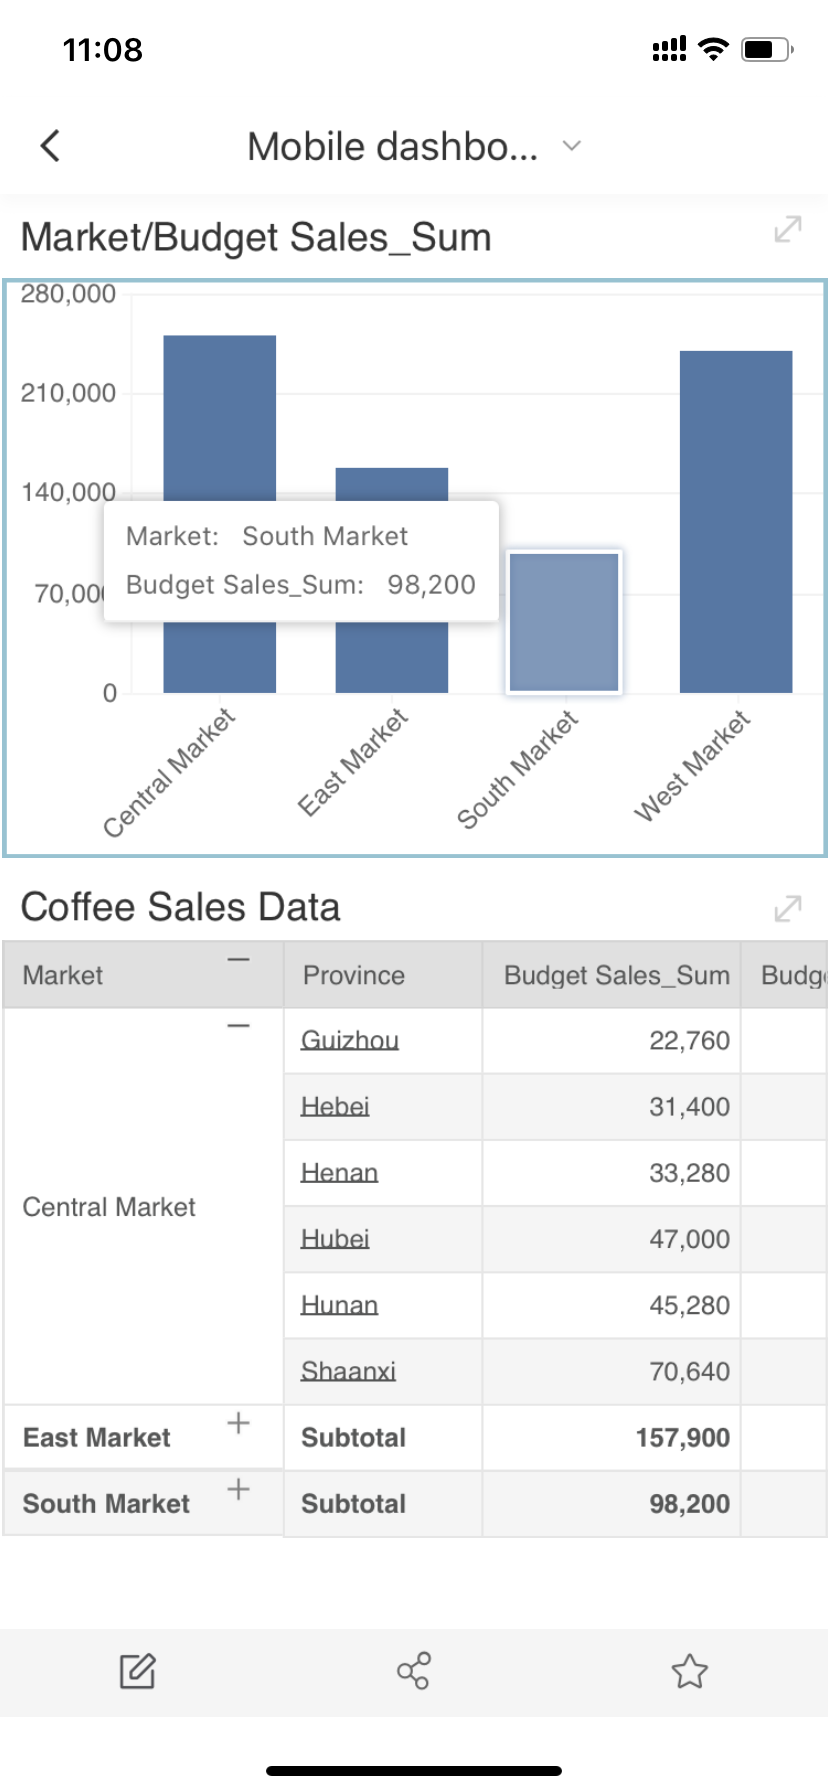
Some common full-screen analysis operations are opened to the dashboard page, allowing users to view the analysis data with no need to enter the component full-screen page.
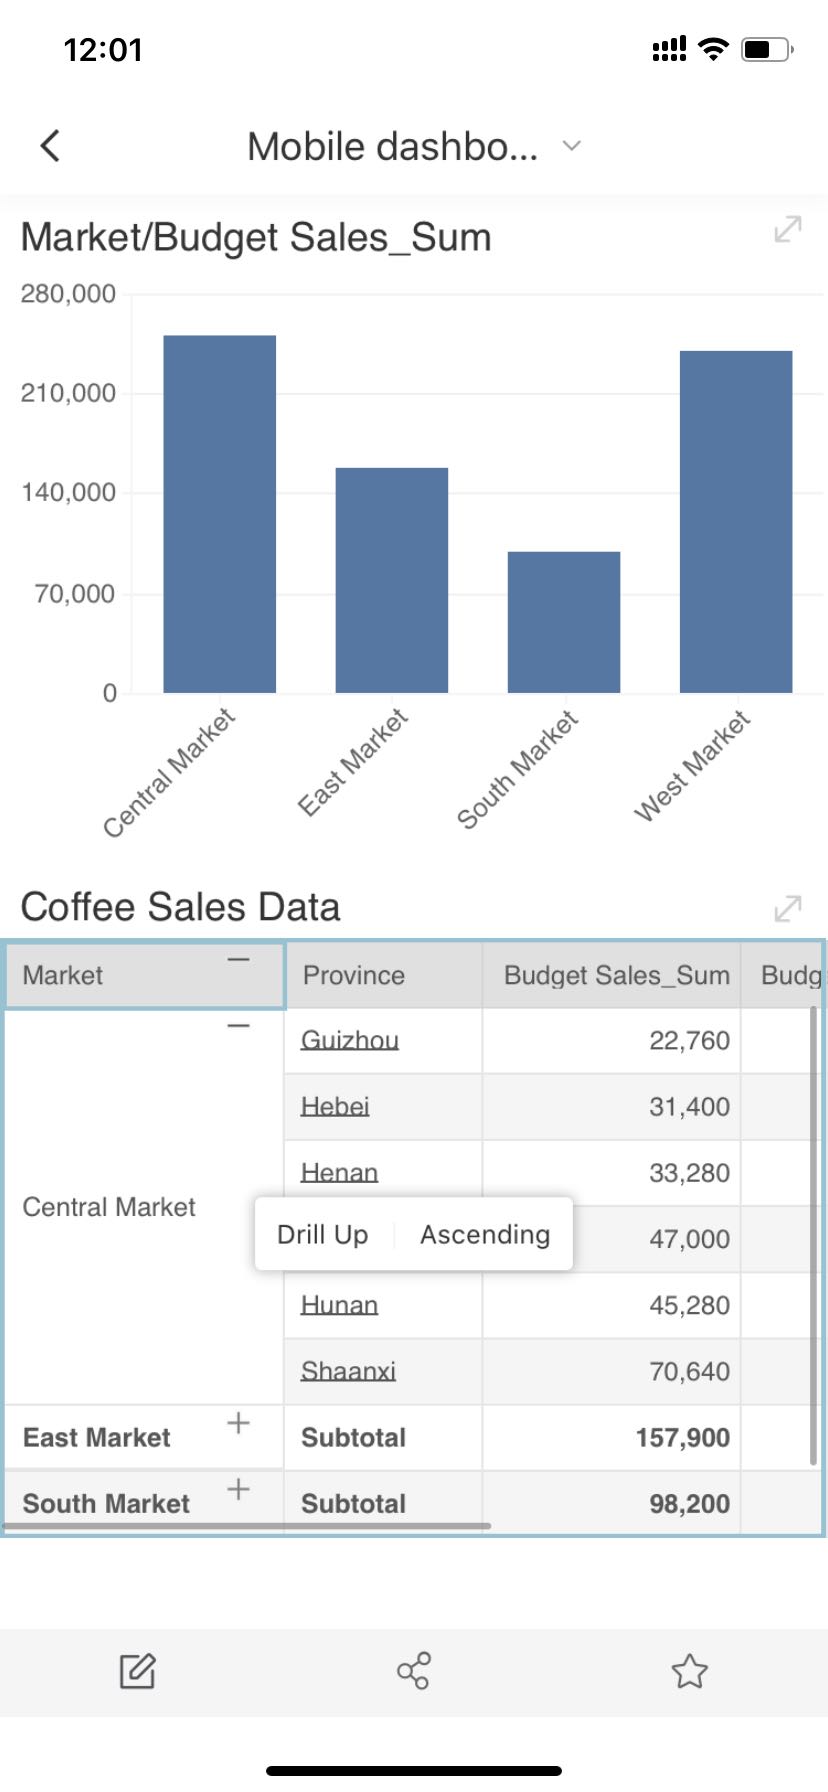
The dashboard page supports the following chart operations: view label, hyperlink jump, chart drilling; supports the following table operations: hyperlink jump, sorting (ascending, descending, unordered), table drilling, and table sliding.
Slide your finger on the screen, you can select a mark of the chart to view the specific value, you can also jump through the hyperlink after the mark is selected, or you can directly drill down the chart.
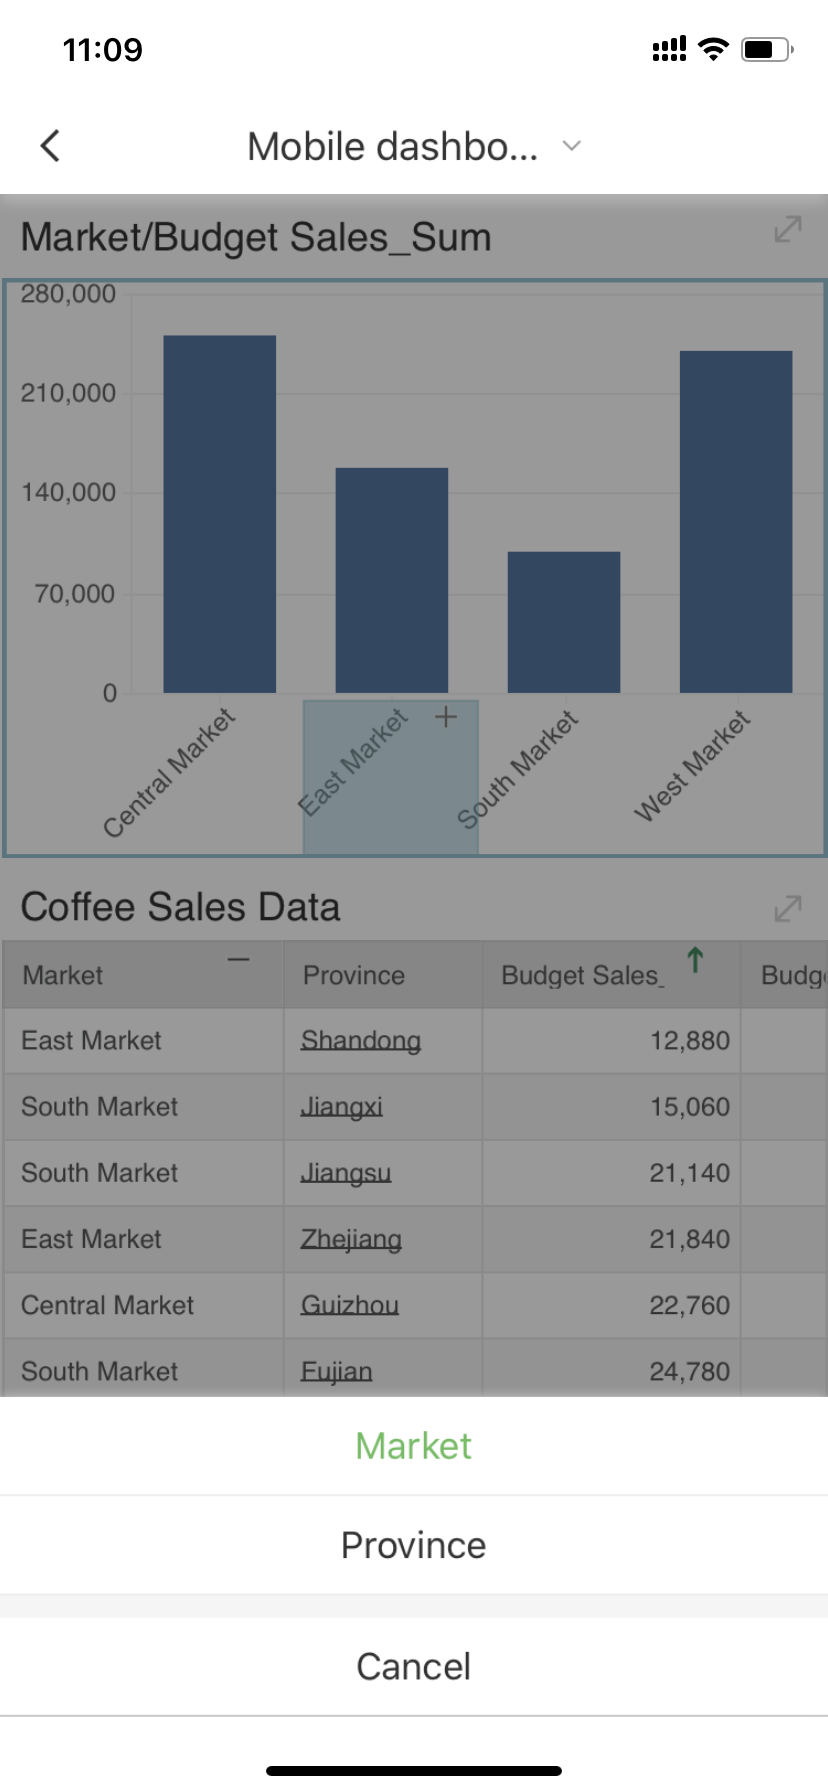
Not only is the analysis of the chart more convenient, some common analysis operations of the table are also open to the dashboard page. Users can directly drill up, drill down, hyperlink and sort the table.
Note: If a component does not want to perform data viewing and analysis operations on the dashboard page, you can uncheck the mobile terminal "selectable" attribute when making the dashboard.
Data Scope Filtering is More Convenient
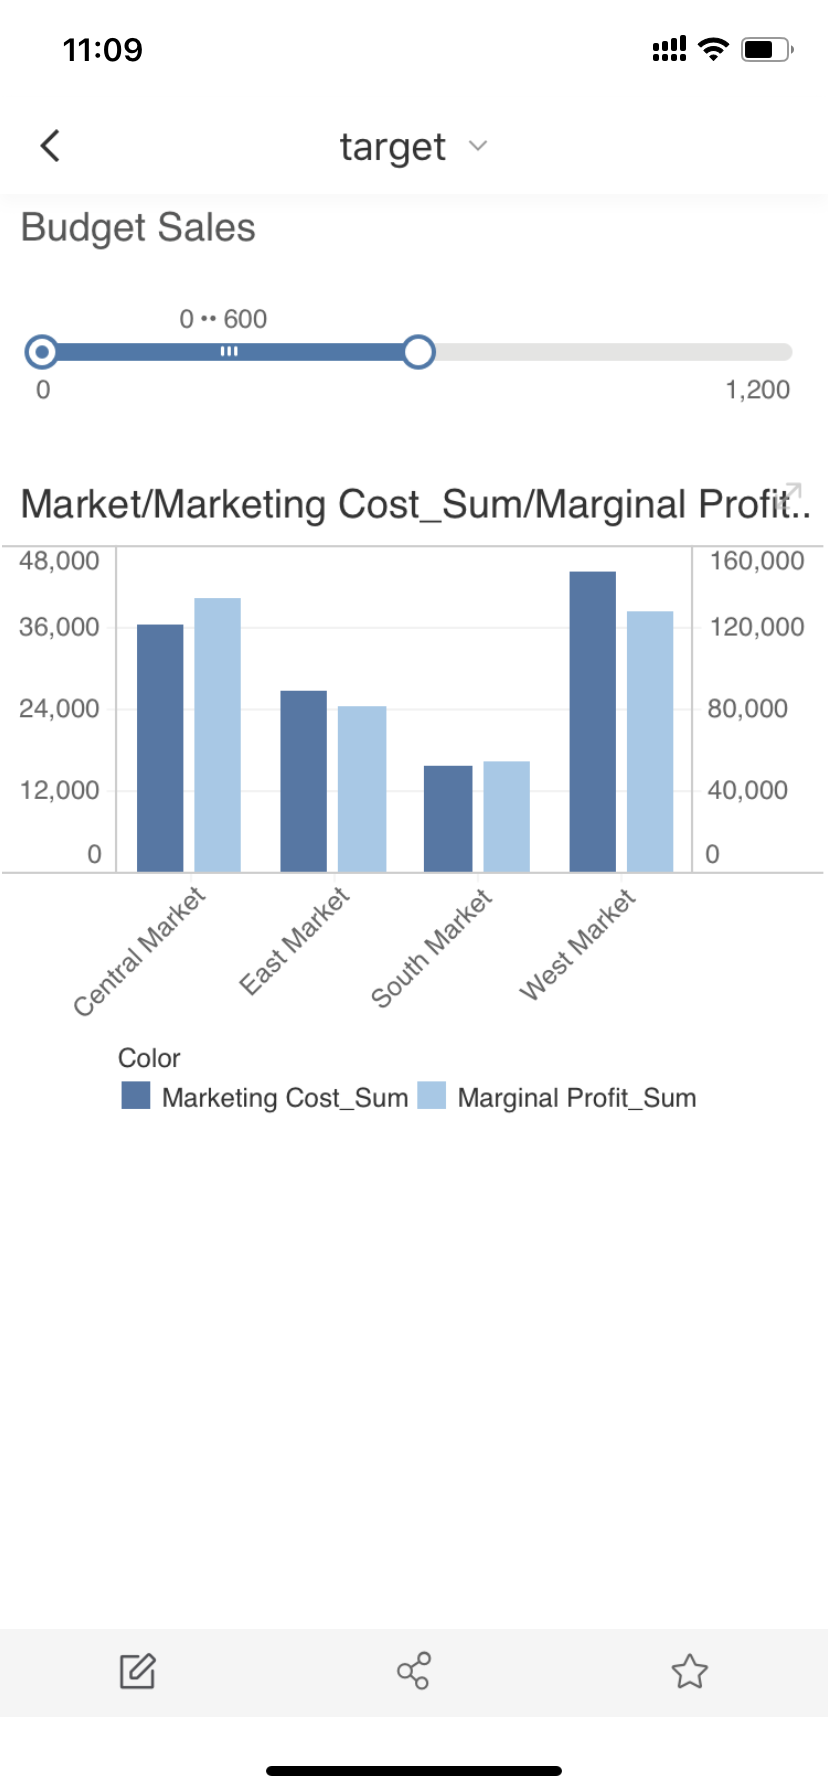
Data scope filtering, without entering the full screen, you can directly drag the scope slider on the dashboard page to filter directly.
❖New Features List
1. Self-Service Data Preparation
No. |
New Features |
Version |
1 |
Interaction Optimization of Data Source and Data Set Page |
V9.0 |
2 |
Display Detail Data by Default |
V9.0 |
3 |
Logic Optimization of Date |
V9.0 |
4 |
Continue to Enhance the Function of Calculated Columns For More Databases |
V9.0 |
5 |
Mongo Calculated Columns Support Aggregate Functions |
V9.0 |
6 |
Data Levels Setting in Dashboard Module Further Supports Integration Scenarios |
V9.0 |
7 |
The Dashboard Module Supports the Creation of Date Expressions\Date Levels, Making Self-service Analysis More Convenient |
V9.0 |
8 |
Add the Property, max.permit.rows, to Control the Termination of Non-sql Calculations (V9.0.1) |
V9.0.1 |
2. Dashboard
No. |
New Features |
Version |
1 |
Optimization of Right Settings Pane |
V9.0 |
2 |
Support Component Full Screen and Dashboard Full Screen |
V9.0 |
3 |
Table Supports the Highlight Applied to the Entire Row |
V9.0 |
4 |
Freestyle Table Functions are Simplified, and the Ease of Calculation Between Grids is Improved |
V9.0 |
5 |
Parameters Could be Used in TopN Sorting, Table Rendering, Warning Detailed Information, Target Line |
V9.0 |
6 |
Optimize Portal Settings to Improve Portal Personalization Capabilities |
V9.0 |
7 |
Support Table/ Area/ Cell Target Line |
V9.0 |
8 |
Hyperlink Hides the Parameters to Solve the Problem of Access Error for Too Many Parameters |
V9.0 |
9 |
The Table Adds Height Self-adaptation and Paging Settings to Enhance the Flexibility of the Table |
V9.0 |
10 |
Support Configuration Loading Animation for Dashboard Viewing |
V9.0 |
11 |
Support Gantt Chart to Help Users View the Progress of Tasks |
V9.0 |
12 |
GIS Map Supports HereMap |
V9.0 |
13 |
Custom Data Optimization for Parameter Component |
V9.0 |
14 |
Select All Optimization of List Component |
V9.0 |
15 |
Text Format -> Digital Format Adds the Unit, million |
V9.0 |
16 |
Interactive Optimization of Filtering Interface |
V9.0 |
17 |
Index Page Supports Hiding Fast Learning and Function Introduction |
V9.0 |
18 |
Time Trajectory Graph Adds Axis Label Format Settings |
V9.0 |
19 |
Module Jump Interaction Optimization |
V9.0 |
20 |
Interaction Optimization of Script and Calculated Column |
V9.0 |
21 |
Support Global Filtering, Fixed the Filtering Area |
V9.0.1 |
22 |
The Dashboard Supports Multiple Tabs, Which is Convenient for Dashboard Management |
V9.0.1 |
23 |
Optimization of Dashboard Scroll Bar Position |
V9.0.1 |
24 |
Optimization of Hyperlink Export |
V9.0 |
25 |
Optimization of Making Dashboard Page |
V9.0 |
26 |
Support Columns Stacking to Meet the Analysis Scenarios of Metric Value Comparison |
V9.0 |
27 |
The Chart Label Supports Binding Multiple Fields to Display More Data Information |
V9.0 |
28 |
Indicator Card Supports More Highlight Formats |
V9.0 |
29 |
Optimized Algorithm for Intelligent Display of Chart Labels |
V9.0 |
30 |
Labels Support Alignment |
V9.0 |
31 |
Optimization of Table Style |
V9.0 |
32 |
Uniform Style of Drop-down Parameters |
V9.0 |
33 |
Guide Line Style Optimization of 3D Pie Chart |
V9.0 |
34 |
Display Optimization of Yonghong Autonomous Map Boundary |
V9.0 |
35 |
Add Color Divergence |
V9.0 |
36 |
Add More Built-in Color Schemes |
V9.0 |
37 |
Optimized the Layout of the Color Matching Edit Box of the Measurement Column |
V9.0 |
38 |
Optimization of Color Gradient Algorithm for Dimension Column |
V9.0 |
39 |
Optimization of Discrete Display Area of Dimension Column Color |
V9.0 |
3. Reporting Form
No. |
New Features |
Version |
1 |
Form Management Supports Card-style Files and Shuttle Folders |
V9.0.1 |
2 |
Support Rich Components |
V9.0.1 |
3 |
Support Real-time Preview of the Output Effect on Computer and Mobile Terminal |
V9.0.1 |
4 |
Support Control Data Collection Time by Setting the Start and End Time |
V9.0.1 |
5 |
Support Directly Filling in the Database to Facilitate Data Management |
V9.0.1 |
6 |
Support Setting up Collaborative Editors to Improve Office Collaboration Efficiency |
V9.0.1 |
7 |
Support Both Inner Release and Public Release |
V9.0.1 |
4. Advanced Analytics
No. |
New Features |
Version |
1 |
Support Plug-in Operators to Improve Scalability |
V9.0 |
2 |
Add Running Records to View the Running Result |
V9.0 |
3 |
Support Get Data Through Restful API to the Experiment |
V9.0 |
4 |
Some Experimental Tasks of Advanced Analytics Support Execution Through Scheduling Tasks |
V9.0 |
5 |
Realize the Recovery of Unsaved Experiments |
V9.0 |
6 |
Realize Automatic Layout, Make the Experiment Layout Neat and Clear |
V9.0 |
5. Enterprise Management
No. |
New Features |
Version |
1 |
Support Data Download, Which is Convenient for Desktop Version to Do Offline Data Analysis |
V9.0 |
2 |
User Information Interaction Optimization in Group and Role Management |
V9.0 |
3 |
Optimize LDAP to Meet Different Scenarios of User Synchronization |
V9.0 |
4 |
Optimize the Execution Result Display of the Scheduled Task after the System Relunched |
V9.0 |
5 |
Yonghong X-Suite Launches Database System and High-availability Solution: X-Backup |
V9.0 |
6 |
Verify the Administrator's Password when Changing User's Password |
V9.0 |
7 |
Optimization of Authorization Display |
V9.0 |
8 |
Optimization of Link between Modules in Integration Scenario |
V9.0 |
6. Big Data
No. |
New Features |
Version |
1 |
New Generation of Data Processing Engine, Greatly Improving Computing Performance |
V9.0.1 |
2 |
Functional Enhancement and Ease of Use Optimization of Performance Detection |
V9.0 |
3 |
New Dynamic Performance Analysis Report |
V9.0 |
7. App
No. |
New Features |
Version |
1 |
The Drop-down Parameter Component Supports Changing to the PC Interactive Form |
V9.0.1 |
2 |
More Convenient to View the Data Analysis Results on the Mobile Phone |
V9.0 |
3 |
Data Scope Filtering is More Convenient |
V9.0 |
4 |
Optimization of Filtering Style |
V9.0 |