|
<< Click to Display Table of Contents >> Yonghong Z-Suite V8.8 |
  
|
|
<< Click to Display Table of Contents >> Yonghong Z-Suite V8.8 |
  
|
❖New Key Features
1. Self-Service Data Preparation
Composed Data Set Optimization
Optimize the hidden logic of composed data set fields, solve the problem of invalid display when changing from Join to Union, so as to improve the ease of use of composed data sets.
Optimization points include the following aspects:
•When the data set is dragged into the composed data set, the expression column is optimized from the original default hiding to not hidden by default.
•For the data sets added to the composed data set, their columns are sorted by dictionary column (column name).
•Remove the logic of hiding and sinking the Join field of the second Join table. The column order after join or union remains unchanged.
•The hidden field is no longer sinking.
New Data Source: GaussDB 100
Added support for the database of Huawei,GaussDB 100, to meet the user's need to connect to the GaussDB 100 database.
Enhanced Advanced Attribute "Transaction Isolation Level" of Data Source
In the 8.8 version, "Transaction Isolation Level" is added to Advanced Settings of Connection to support users to set the transaction isolation level for a single data source.
In previous versions, Yonghong also supports transaction isolation level, but it needs to be configured in bi.properties (conn.transaction.level = 2) and acts on all data sources. The new version not only supports setting transaction isolation level for each single data source in the interface, but also supports multiple transaction isolation levels, users can choose which transaction isolation level they need.
Note: If the user has previously set conn.transaction.level = 2 in bi.properties, then after the upgrade, the "Transaction Isolation Level" property will automatically select "prevent dirty data read".
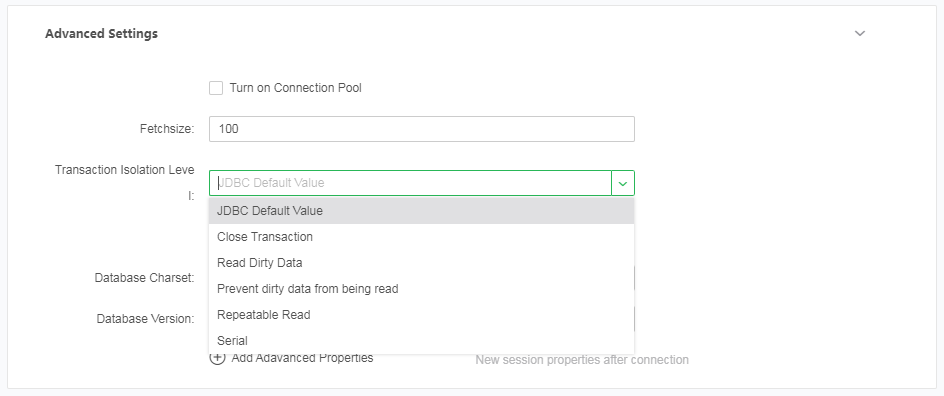
Support the following transaction isolation levels:
Drop-down Menu Options of Transaction Isolation Level |
Description |
The default value of JDBC |
Adopt the method of JDBC |
Close transaction |
Execute query without enabling transaction |
Dirty data read |
Allows reading data being updated by other transactions, reducing locking tables |
Prevent dirty data read |
If the read data is locked, it will wait |
Read repeatable |
The data can be locked when the data are read repeatedly to avoid other transaction updates |
Serial |
transactions are executed one by one |
Expression Function Enhancement and Usability Improvement
In order to better support the customer's needs for using expressions, Yonghong has enhanced and optimized the functions and ease of use of expressions. You need to set use.yonghong.script = true to enable the following function enhancements. Not enabled by default.
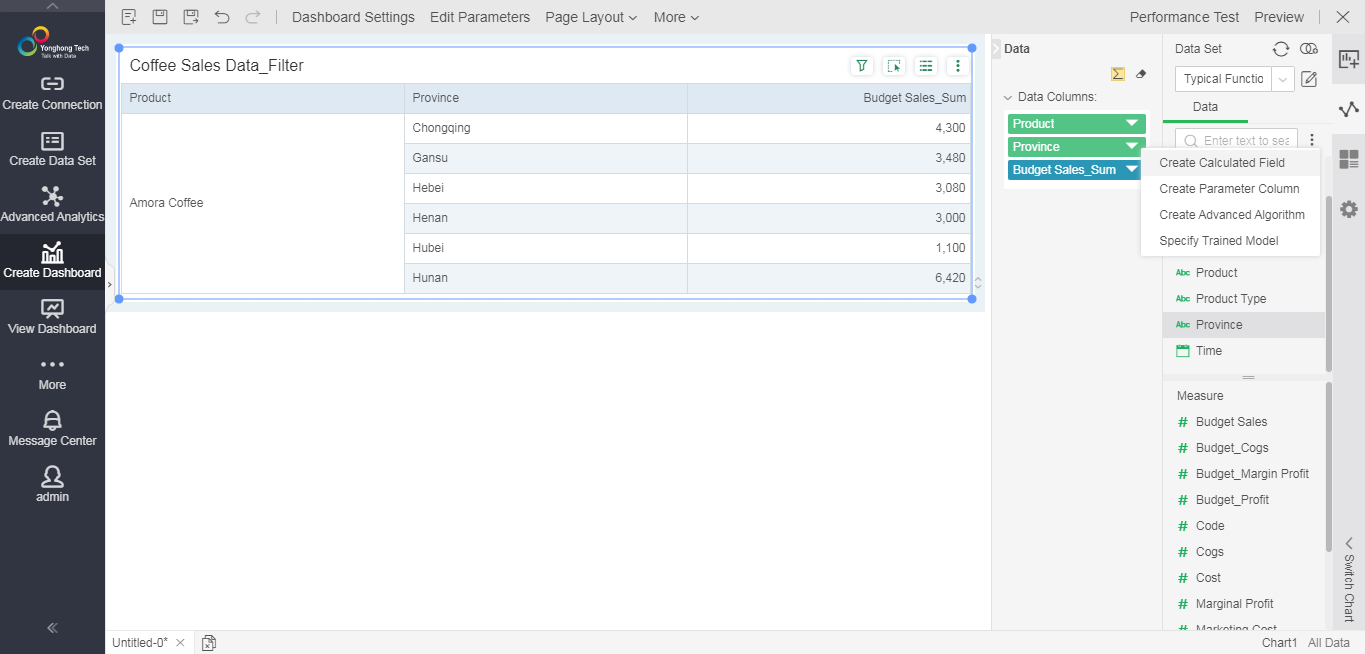
1. The two expressions are unified into a "calculated field"
Before version 8.8, Yonghong had two kinds of expression entrances: "new expression" and "new aggregation expression". In version 8.8, the entrances of the two types of expressions were unified into "Create Calculated Field". Users no longer need to distinguish between details and aggregate expressions, which optimizes the user's experience in building calculated columns.
2. Enhance calculated columns
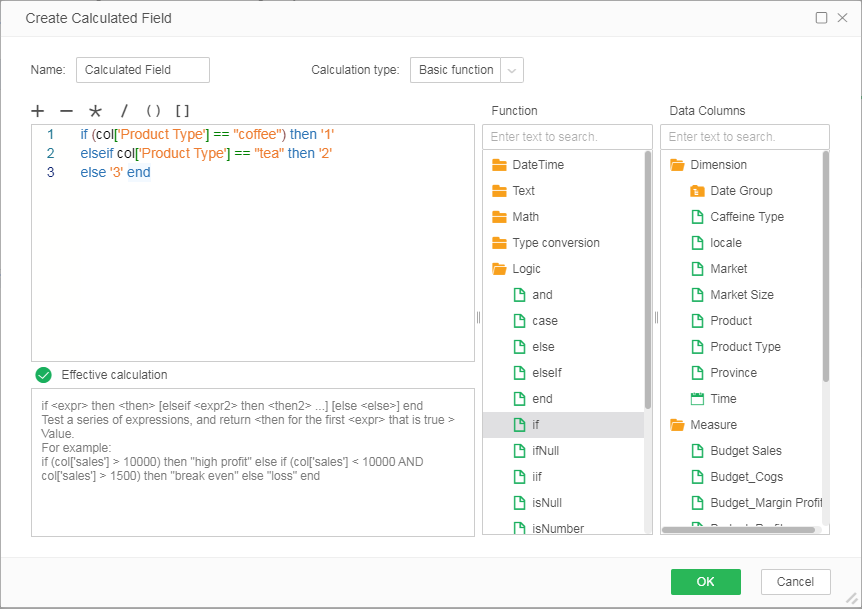
Functions are divided into the following categories: date time, text, math, type conversion, logic, aggregation, and detail expression. The function description has been optimized for ease of use to help users quickly find and understand the correct usage of the function. Currently supported databases are Oracle, SybaseIQ.
You can also directly see the built-in parameters of Yonghong.
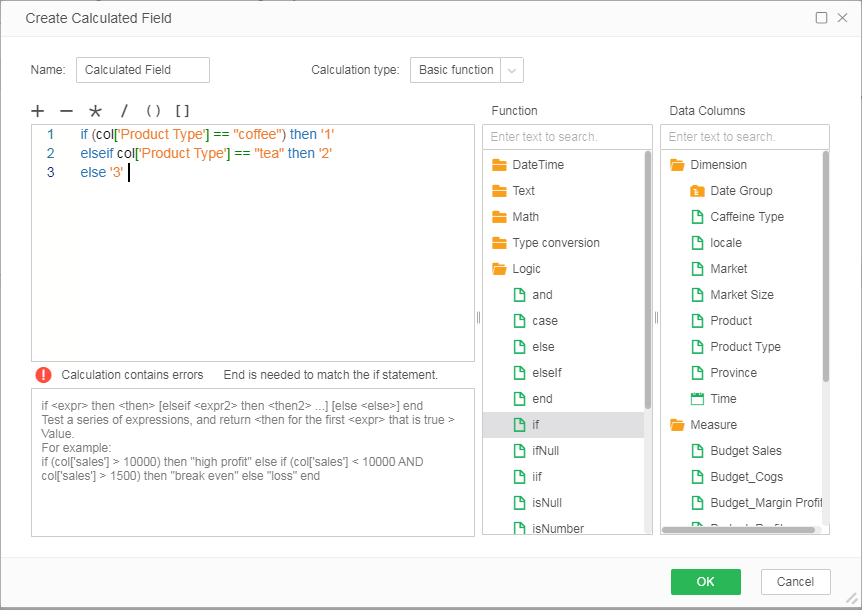
3. New grammar check
When the user writes the calculated column, a grammar detection prompt will be conducted to guide the user to write the correct keyword.
For example, when the written sentence is incomplete, the user is prompted "end is required to match the if sentence"
if (col['product type'] == "coffee") then '1'
elseif col['product type'] == "tea" then '2'
else '3'
4. Friendly performance testing tips
If the user uses the SQL data set, the calculated columns pushed down to the database will be displayed normally.
If the new calculated column is not pushed down, the column will be displayed in orange, and it will prompt that the calculated column cannot be pushed down to the database for execution, and will be handed over to the memory for processing. At the same time, all the information in this dashboard that has not been pushed down will be collected in the "Performance Test" of the toolbar.
5. Judgment of invalid calculated column
If the user directly saves the grammatically incorrect expression, a red exclamation mark will appear behind the data column, prompting the error.
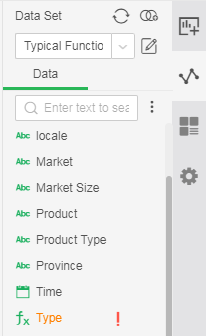
Note:In the previous versions (V8.0, V8.5, V8.6, V8.7), when creating a new expression in the dashboard, you can create an expression with the same name. Version 8.8 does not allow you to create a calculated column with the same name.
6. Automatically get the data type of the calculated column
In the basic functions supported by Yonghong, each calculated column will automatically return the data type according to the result.
For example: The caculated column dateAdd(col['transaction time'],'dayofyear',1), the data type will be automatically returned as date and time after writing, and it will be placed under the dimension by default.
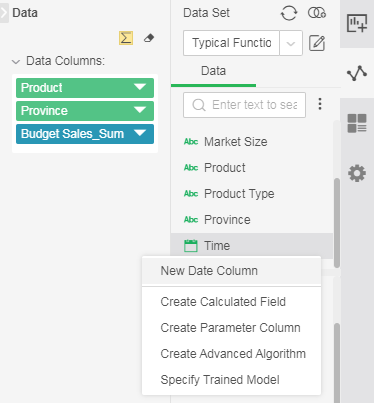
7. In Make Dashboard interface, open the "New Date Column" entry, you can directly create a date expression when creating a dashboard, without having to jump to the data set.
8. List of functions supported by calculated columns:
•Date Time
dateAdd,dateName,datePart,dateTrunc,day,isDate,month,now,quarter,today,year,date,weekNum,getDate,dateGap,weekday,dateValue
•Text
split,substring,indexOf,ascii,char,contains,endsWith,exact,extractNTH,find,left,len,lower,match,mid,replace,replaceRegex,rept,right,search,startsWith,substitute,trim,upper,concat
•Aggregation
avg,correlation,count,distinctCount,covariance,max,median,min,pthPercentile,standardDeviation,populationStandardDeviation,sum,variance,populationVariance,range,product,mode,sumSQ,quartile,standardError,sumWT,weightAvg,approximateCount,countAll
•Math
sqr,abs,acos,asin,atan,atan2,ceiling,cos,cot,degrees,exp,floor,ln,log,pi,power,radians,round,sign,sin,sqrt,tan,trunc,roundUp,randbetween,roundDown
•Logic
isNull,isNumber,and,case,else,elseIf,end,if,ifNull,iif,not,or,then,when
•Type Conversion
str,formatDate,parseDate,formatNumber,parseInt,parseFloat
•Detail Expression
exclude,fixed,include
2. Dashboard
Optimization of Making Dashboard Interface
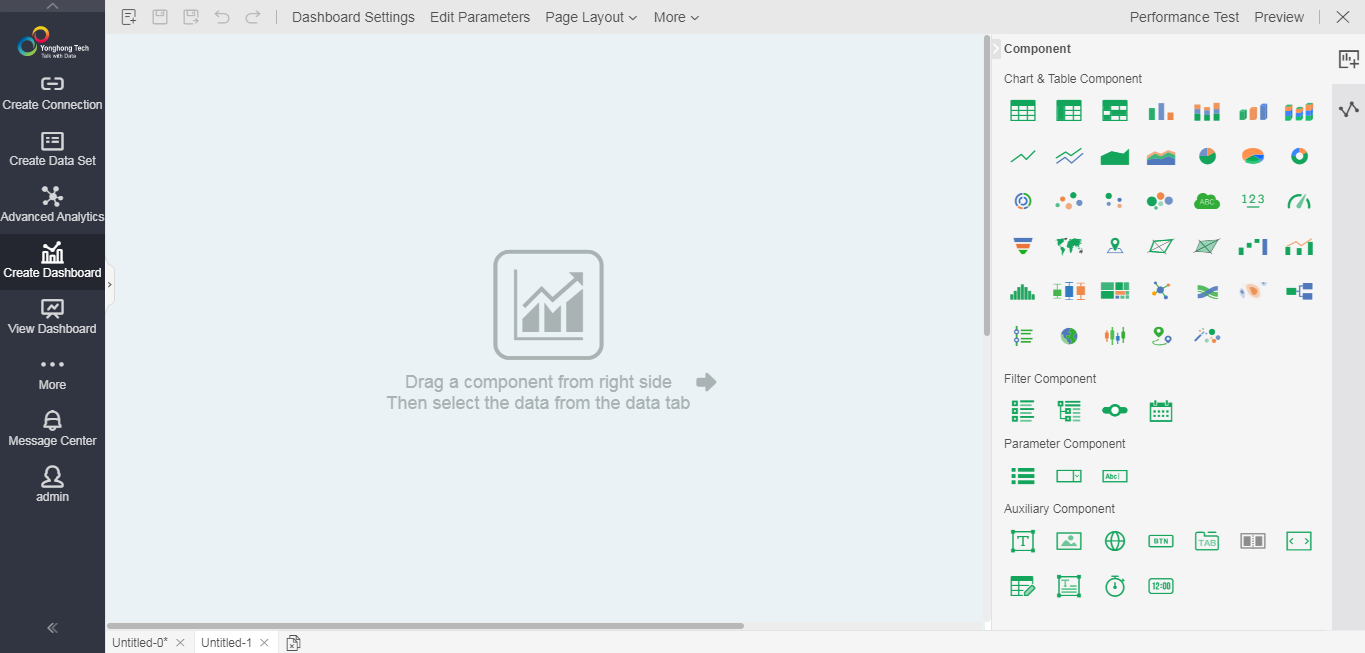
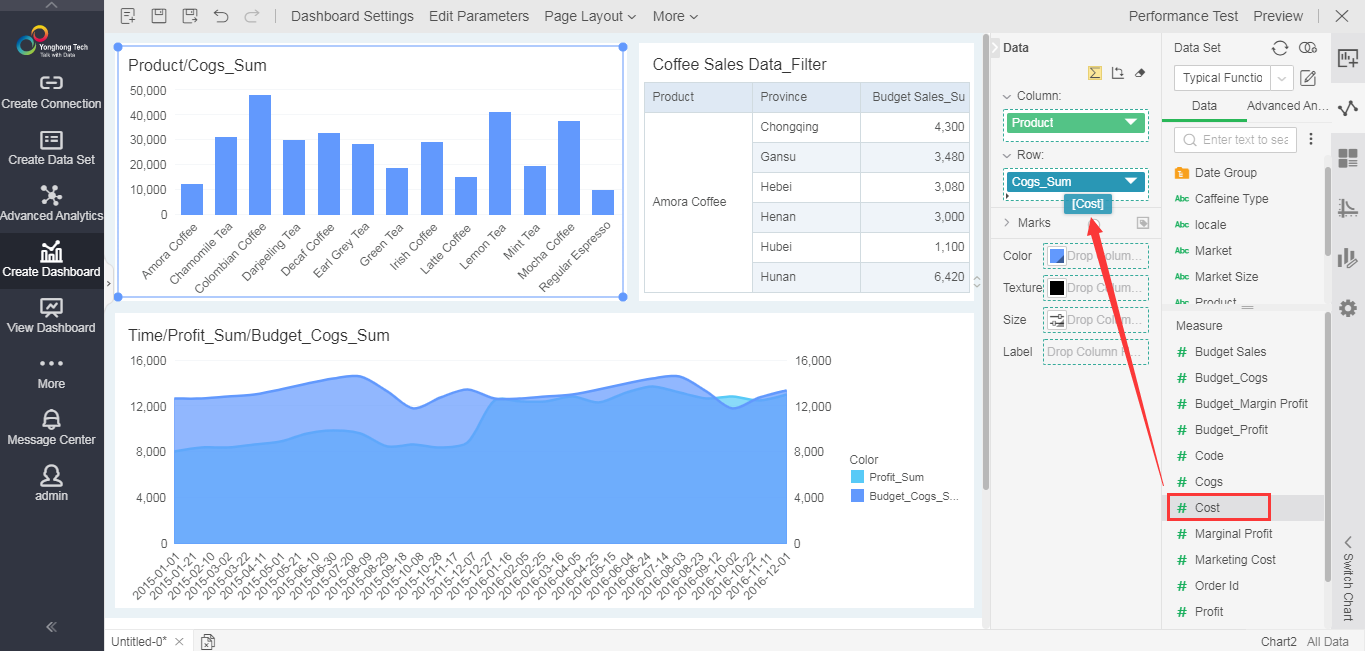
The new version optimizes the interface and interaction of Make Dashboard module to improve the ease of use. These include: increasing the editing area, optimizing the interaction of the data tab and the use of the data tree, adjusting the content of the component tab, optimizing the entry of the chart switching, and the entry of the row and column conversion are more obvious, as shown in the following figure:
Support Intelligent Switching Between Chart and Ordinary Table / Cross Table
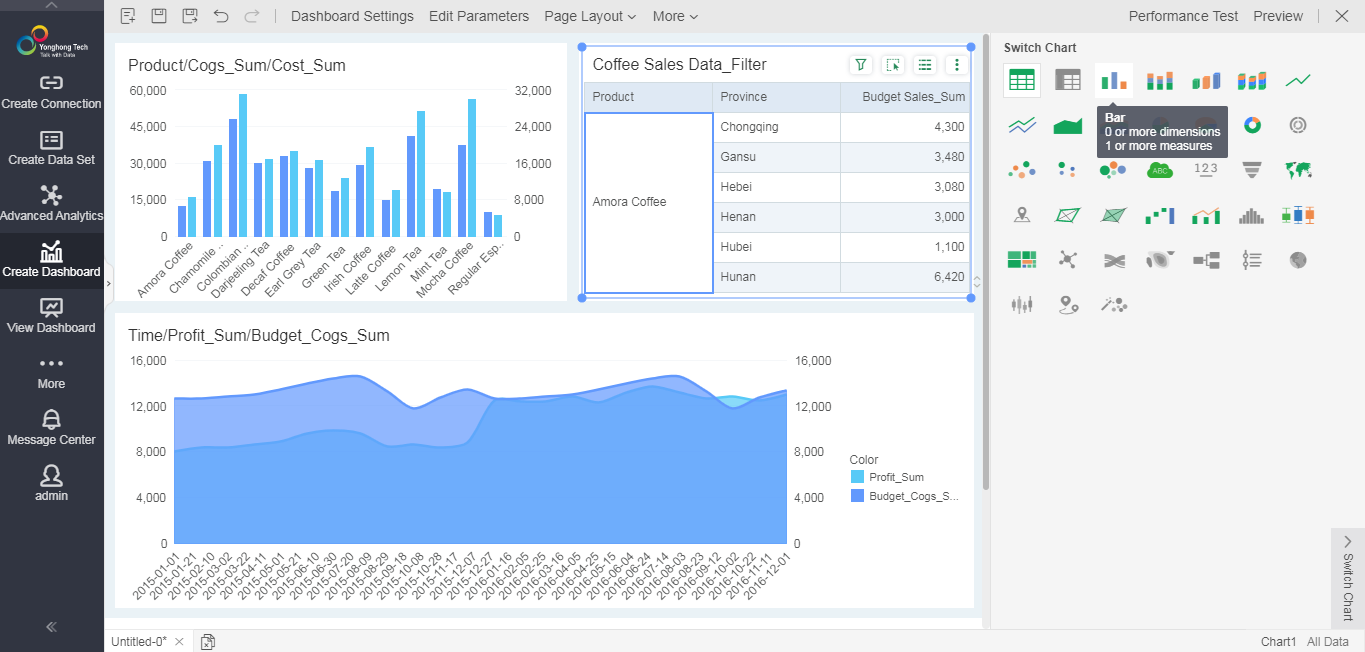
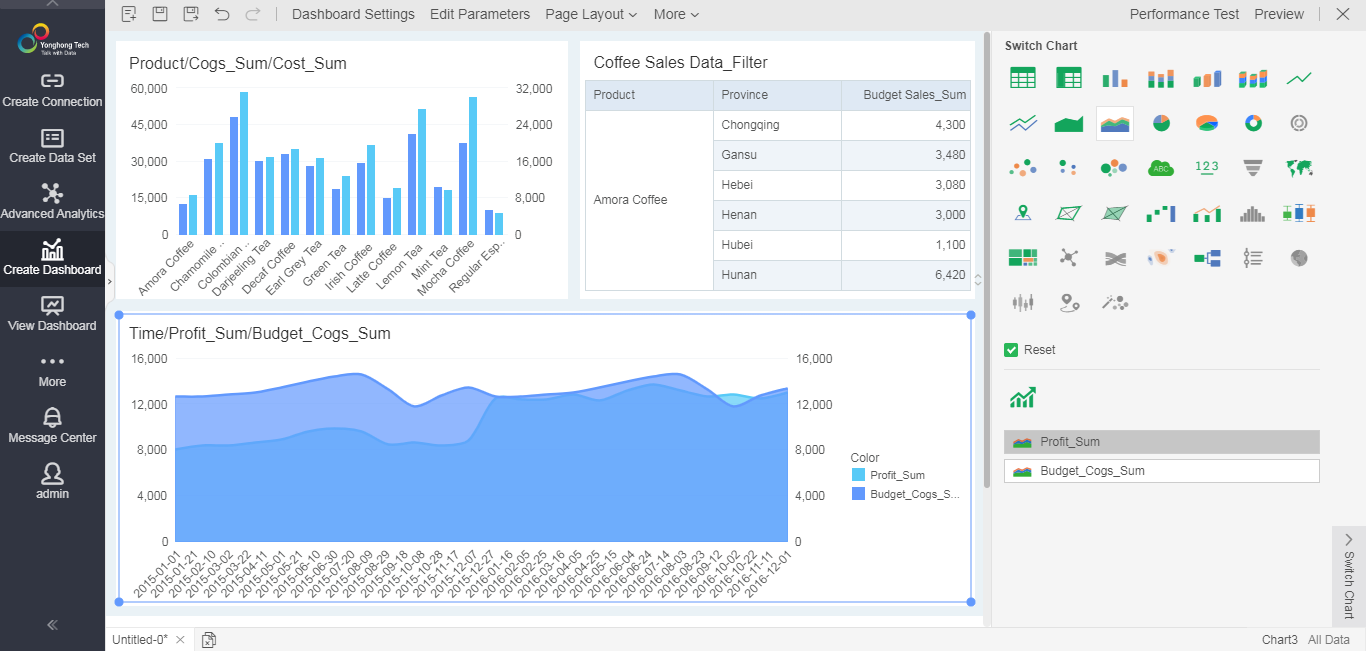
The new version adds an intelligent switching function, which supports the conversion of ordinary tables and cross tables into charts, or charts into ordinary tables and cross tables. At the same time, the interactive interface for switching charts is optimized, and the entrance is more independent and obvious.
Whether it is a built-in chart or a plug-in chart, it can be switched to a normal table or a cross table according to the actual bound data. Ordinary tables or cross tables can also be switched to built-in charts based on the actual bound data.
When performing chart-to-table or table-to-chart conversion, the prompt message will prompt the user the number of measures and dimensions that the target object needs to bind. At the same time, the user is prompted whether the conversion can be performed by whether the icon is grayed out.
note:
1. At present, the conversion between normal table and cross table is not supported yet.
2. Conversion between charts still uses the original logic.
3. At present, only for table-to-chart conversion and chart-to-table conversion, users can be prompted to convert based on whether the icon is grayed out. For conversion between charts, conversion tips have not been added.
Beautify the Styles of the Filter Components and Optimize the User Selection Experience
•Style Optimization
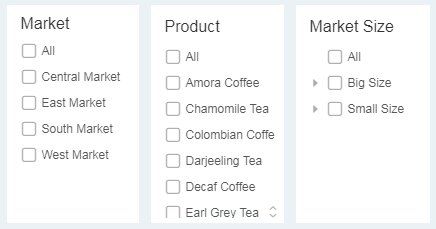
The new version beautifies list filtering, tree filtering, and drop-down layout style of list parameter, making the default style more consistent with the dashboard theme.

•Option State Optimization
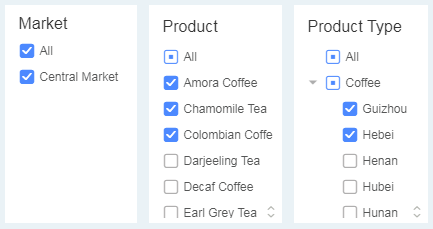
The new version also optimizes the state of the filter component, and the option state has changed from 5 to 3 types: selected, deselected, and semi-selected.
Selected: The user selects an option, which is selected.
Deselected: The user does not check the option, which means it is unchecked.
Semi-selected: The user selects some child nodes under a parent point, which is semi-selected. For example, when selecting some options in the list filtering, the state of “Select All” is semi-selected. When the child node of tree filtering is selected, the parent node is in a semi-selected state.
The filtering interaction between the filtering components has also been optimized accordingly to meet various common scenarios of users, as shown below:
Before selected
Selected
Optimize the Expression Creation of Freestyle Table
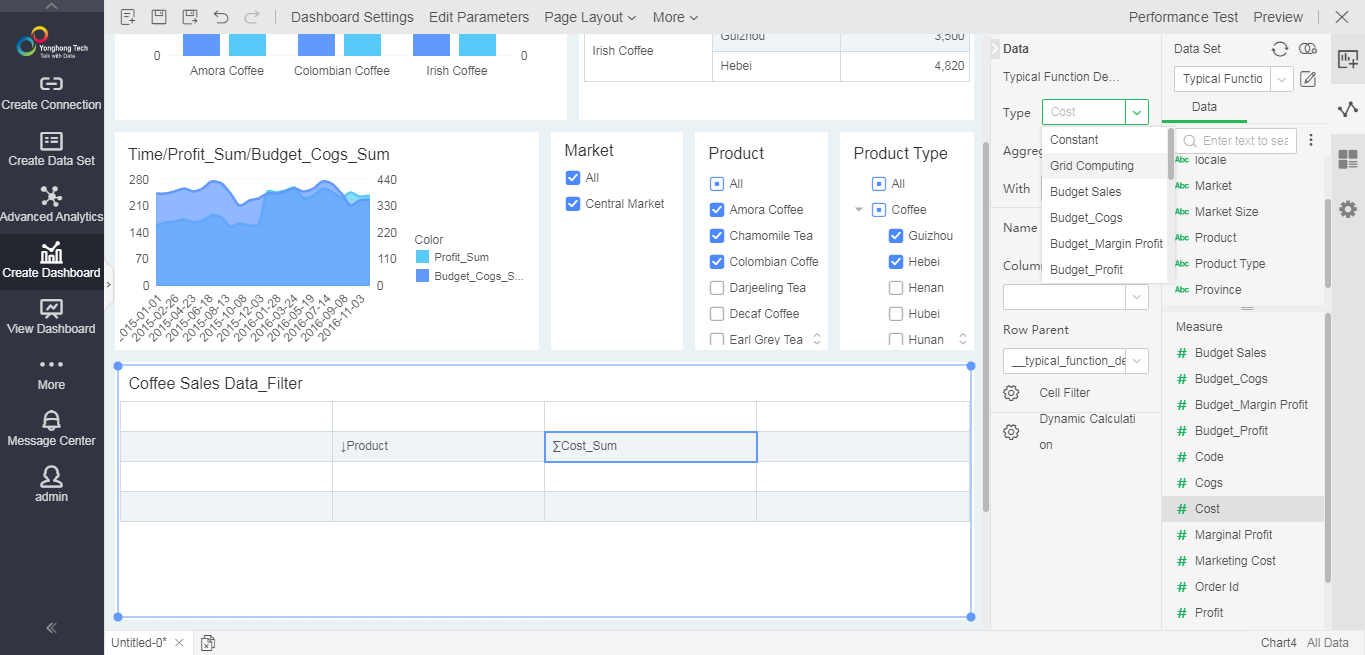
Freestyle tables remove SQL expressions and script expressions. If the user wants to create an expression, directly create a calculated column on the data column tree, and then bind to the corresponding cell of the freestyle table.
Date Format Function Enhancement: Optimize the Display of Date Format, Support Japanese Calendar
The new version enahnces the function of text format-date format, not only optimizes the format display, when users set the date format, they can see the effect to be displayed, which is convenient for users to choose and use, but also adds Japanese calendar date format, which needs to switch the system language to Japanese to see the date format.
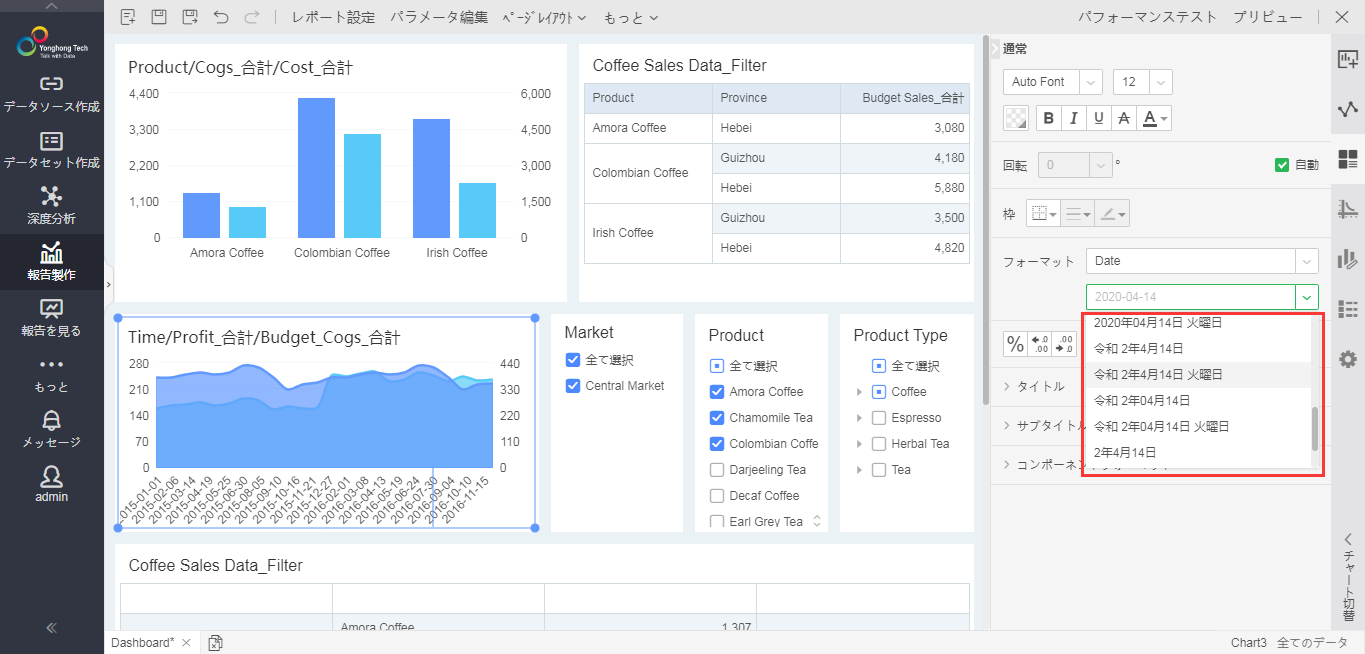
Users can also set the custom date format, as shown below:

Map Component Supports Matching Japanese Postal Codes with Geographic Information
The map component supports Japanese postal code matching, including corporate personal postal codes and address postal codes.
When setting the map column, select the Japanese postal code to match, as shown below:
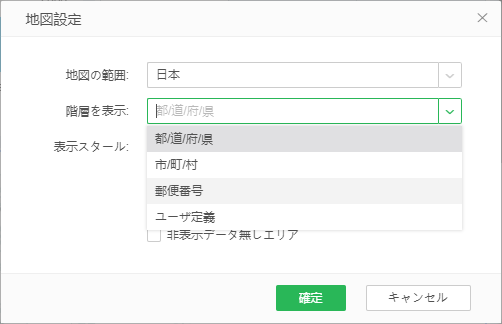
Table Supports Hidding Columns to Meet More Scenarios
The new version adds a hidden column function, the hidden column is not visible when viewing, and can be redisplayed through the component more menu when editing the dashboard.
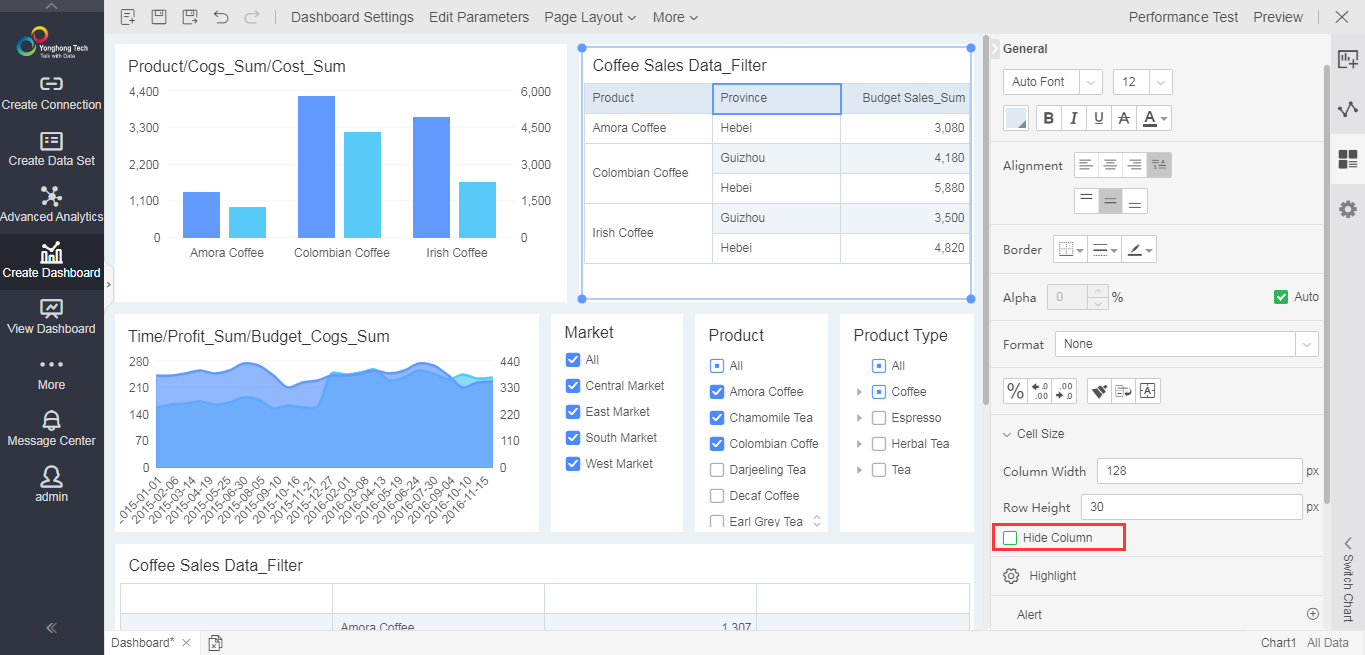
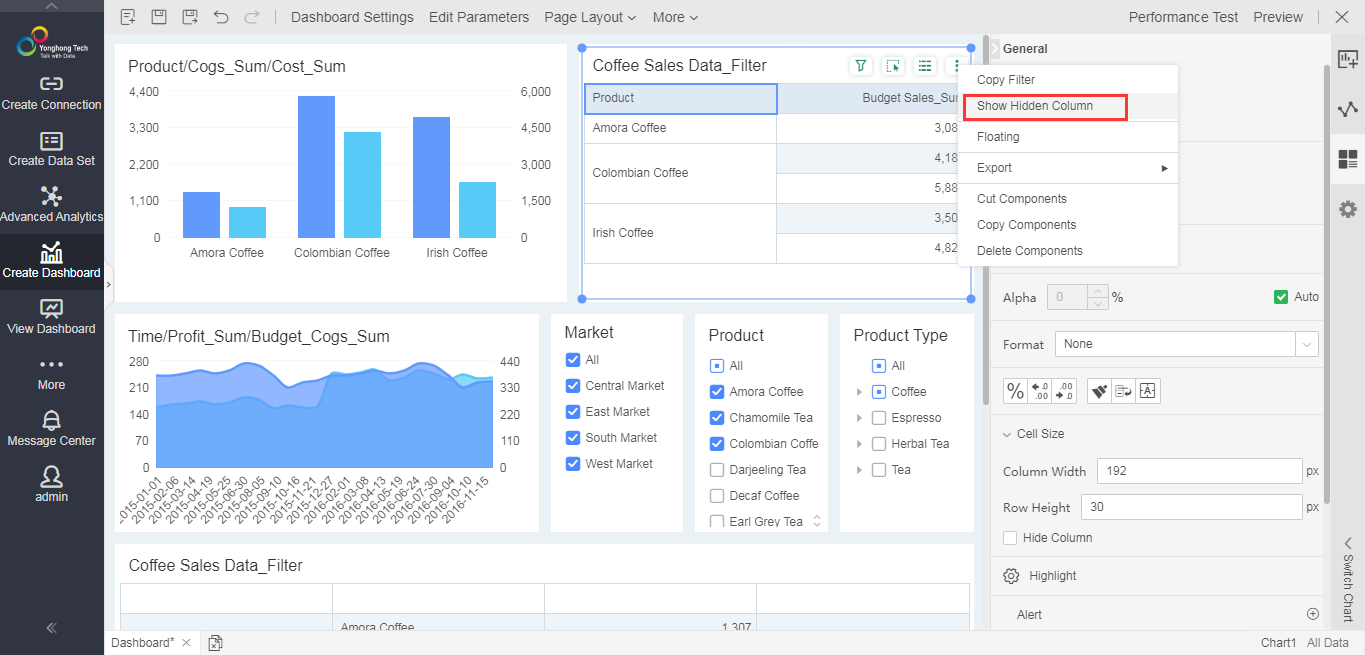
Chart Marker Group Supports Setting Markers for Each Measure
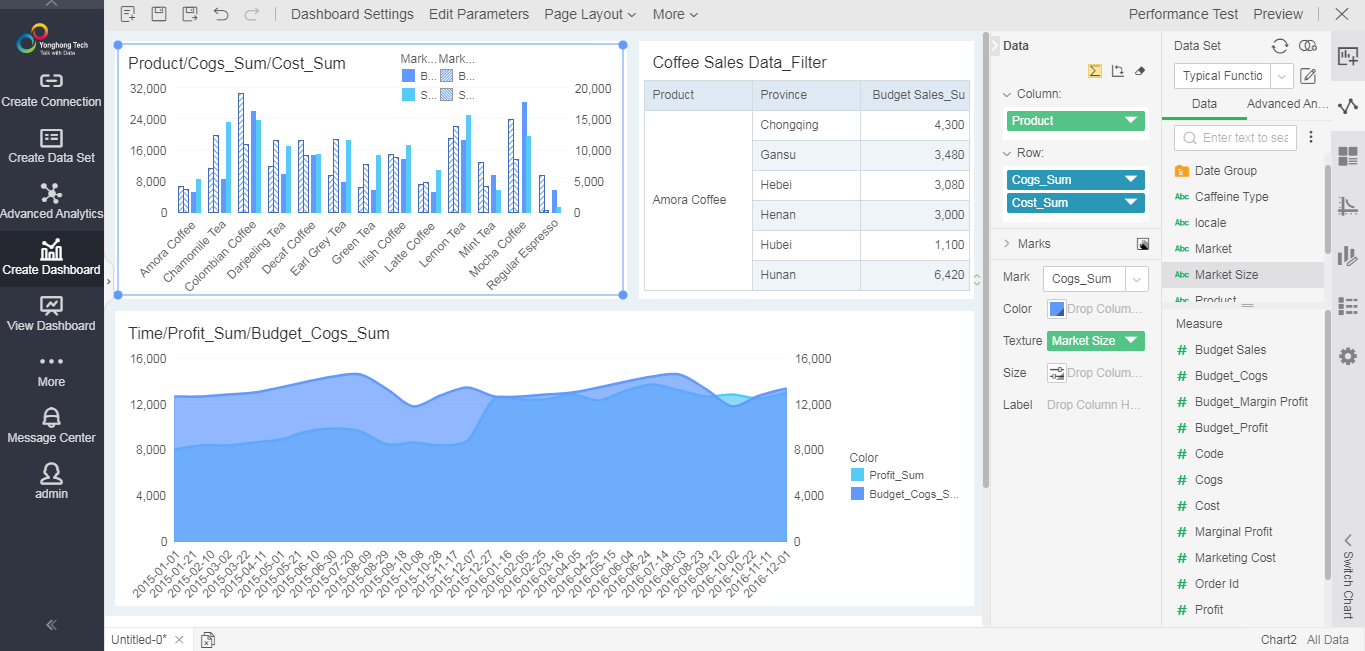
When multiple measures are displayed on the same chart, you can set the marker type separately for different measures, including color, pattern, size, shape, and label.
As shown in the figure below, the color of marginal profit is marked by product type, and the color of sales volume is marked by market distribution.
Dashboard Subscription Supports Enterprise WeChat to Improve Collaboration Ability
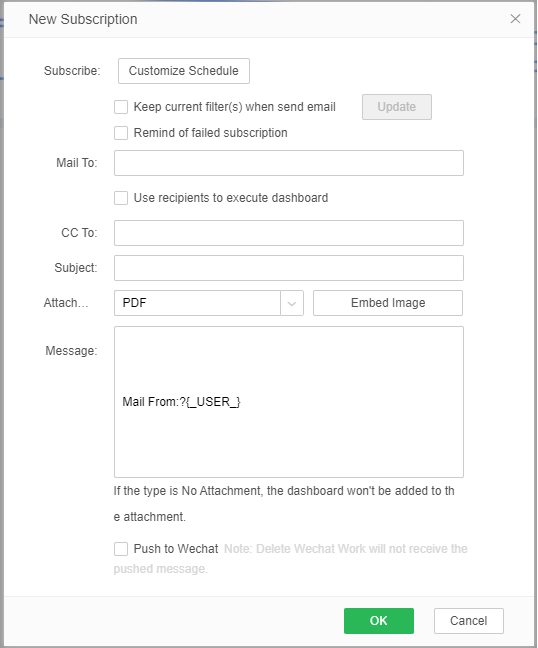
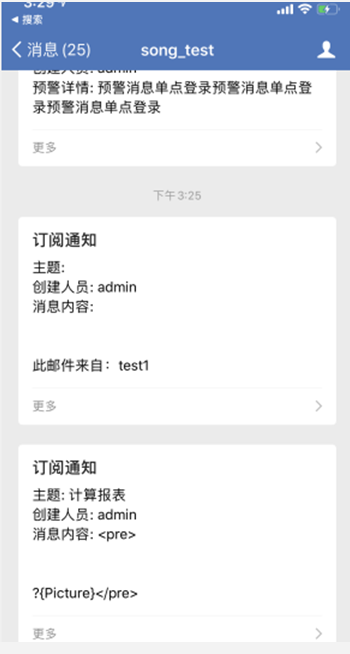
The dashboard subscription supports enterprise WeChat. After checking, the user's subscription message will be sent to the corresponding enterprise WeChat, and users can access the dashboard through enterprise WeChat. The system must be configured with enterprise WeChat before you can see the subscription option.
The message pushed by enterprise WeChat is shown below:
Reporting Function Enhancement, Newly Added Support for GaussDB 100/200, ADS (AnalyticDB) Data Source
In the new version, the database supported by the reporting function has been further increased. Users can fill in the data to GaussDB 100 database, GaussDB 200 database, ADS (AnalyticDB) database.
Provide Upgrade Verification Tool to Help Users Judge the Impact of Upgrade
The new version provides an independent upgrade verification tool. Users can see the difference between the dashboard and data before and after the upgrade through the verification result. Currently, the tool is an independent jar package, which runs through scheduled tasks. For the specific usage method, please refer to "Yonghong Upgrade Verification Tool User Manual".
3. Enterprise Management
User Batch Import and Export
Version 8.8 supports batch import and export of users, that is, users in the system can be exported to excel, or user data in Excel and databases can be imported into the system.
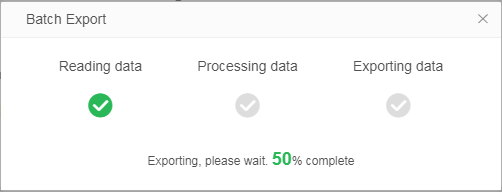
Batch export:
In the user management module, you can export user data in the system to an excel file with one click.
Batch Import:
Batch import is divided into Excel import and data set import.
1. Excel batch import
To select Excel batch import, you need to download the import template first, and fill in the user data according to the template format requirements.

Note: If you need to add user-defined attributes, you need to add user-defined attributes to Yonghong system before downloading the template.
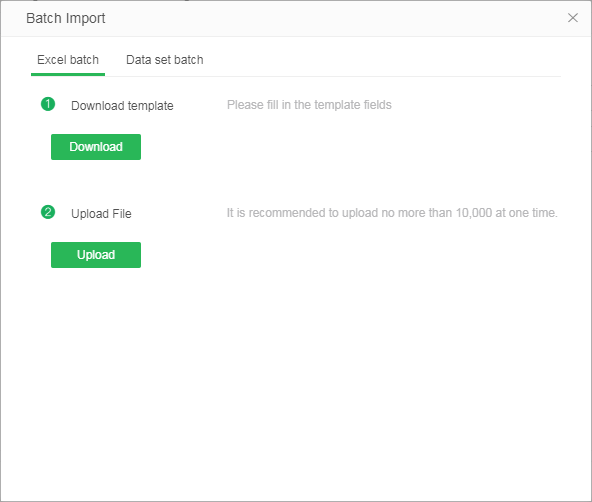
After completing the template, upload Excel to the system. If the user does not exist in the system, the corresponding user, group, and role will be automatically created.
User data that does not meet the template format will fail to upload. After the upload is complete, the user can get a list of all users who failed to upload.
2. Batch import of data sets
To select batch import of data sets, you need to first process user data into Excel data sets or SQL data sets according to the format, and maintain the correspondence between user fields and data set fields in the system.
Similarly, if you need to add user-defined attributes, you need to add user-defined attributes to Yonghong System first, and then select the data set to upload.
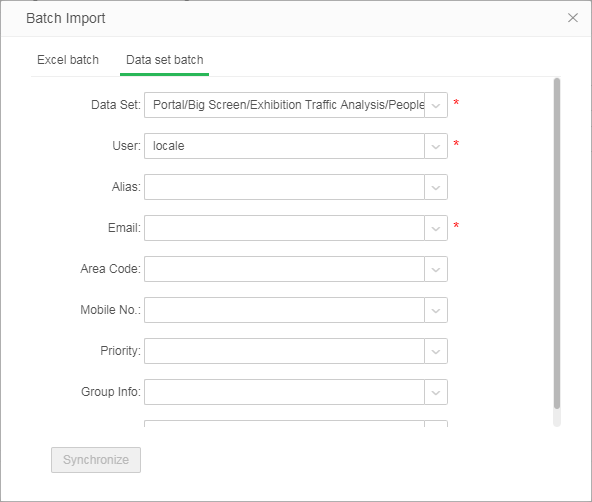
After filling in the correspondence of all required fields, click Sync to synchronize the user data in the data set to the system. User data that does not meet the format requirements will fail to synchronize. After the synchronization is complete, the user can get a list of all users who failed to synchronize.
Support Viewing Dashboards in Huawei WeLink Application
In version 8.8.1, Yonghong docked with WeLink, allowing users to view dashboards in the WeLink application.
Note: 1) WeLink integration plug-in needs to be purchased and installed separately;
2) Use WeLink plug-in need to configure the data space;
Desktop Supports Linux System
Yonghong Desktop V8.8 supports the linux system. The specific supported system versions are: Ubuntu, Centos, Deepin, Red Flag, NeoKylin, Foundation.
4. Big Data
Analysts Can Easily Extract Data into Data Mart
In versions prior to 8.8, when analysts or ordinary data set users want to modify the data and extract modified data to data mart, they need to apply to the administrator. However, in large enterprises, the authority to schedule tasks is generally not open to ordinary users. The application process is very long and the time cost is high. So Yonghong considers optimizing at the product level to help analysts solve this problem.
Version 8.8 adds the function of extracting data to facilitate analysts to import data into the data mart. Users who have write access to the data set can run the operation of extracting data by clicking Extract Data and synchronize data to the data mart.
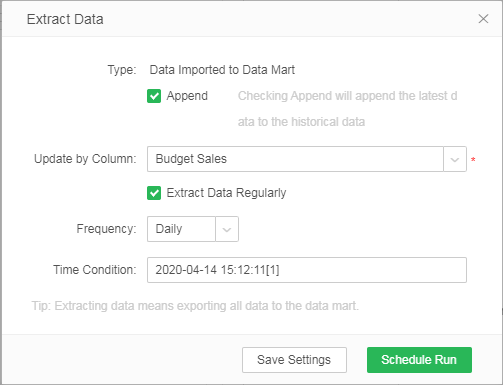
1) The user can choose to run immediately or extract regularly. The user can set the time to extract data monthly, weekly, and daily.
2) Users can append new data to data in the data mart synchronously. You can select a numeric or date type field as the update basis, and the latest data will be added to the historical data.
Note: If the data is reduced, the new data will not be appended to the historical data.
3) Save the configuration, just save the relevant information of the extracting task on the data set, and the configuration information will take effect only after clicking the "Run Immediately” / “Run Regularly" button.
5. Mobile App
Support Scrolling the Table in Non-full Screen State, Increasing the Ease of Viewing Table
In the new version, it is possible to scroll the table in the dashboard page, that is, in the non-full screen state.
Note:
1. Tables, cross tables, and freestyle tables support the "Selectable" attribute, which is not checked by default. Only when the "Selectable" attribute is checked, can the table be scrolled in a non-full screen state.

2. For the old table components, the "Selectable" attribute is unchecked.
In addition, the "mobile" category is added to the settings, and the component's visibility setting on the mobile is in the "mobile" category.
❖New Features List
1. Self-Service Data Preparation
No. |
New Features |
Version |
1 |
Composed Data Set Optimization |
V8.8 |
2 |
New Data Source: GaussDB 100 |
V8.8 |
3 |
Enhanced Advanced Attribute "Transaction Isolation Level" of Data Source |
V8.8 |
4 |
Optimized Column Menu in the Data Set |
V8.8 |
5 |
Expression Function Enhancement and Usability Improvement |
V8.8 |
2. Dashboard
No. |
New Features |
Version |
1 |
Optimization of Making Dashboard Interface |
V8.8 |
2 |
Support Intelligent Switching Between Chart and Ordinary Table / Cross Table |
V8.8 |
3 |
Beautify the Styles of the Filter Components and Optimize the User Selection Experience |
V8.8 |
4 |
Optimize the Expression Creation of Freestyle Table |
V8.8 |
5 |
Date Format Function Enhancement: Optimize the Display of Date Format, Support Japanese Calendar |
V8.8 |
6 |
Map Component Supports Matching Japanese Postal Codes with Geographic Information |
V8.8 |
7 |
Table Supports Hidding Columns to Meet More Scenarios |
V8.8 |
8 |
Chart Marker Group Supports Setting Markers for Each Measure |
V8.8 |
9 |
Dashboard Subscription Supports Enterprise WeChat to Improve Collaboration Ability |
V8.8 |
10 |
Reporting Function Enhancement, Newly Added Support for GaussDB 100/200, ADS (AnalyticDB) Data Source |
V8.8.1 |
11 |
Provide Upgrade Verification Tool to Help Users Judge the Impact of Upgrade |
V8.8 |
12 |
Optimize Japanese Localization |
V8.8.1 |
3. Enterprise Mangement
No. |
New Features |
Version |
1 |
User Batch Import and Export |
V8.8 |
2 |
Support Viewing Dashboards in Huawei WeLink Application |
V8.8.1 |
3 |
Desktop Supports Linux System |
V8.8 |
4. Big Data
No. |
New Features |
Version |
1 |
Analysts Can Easily Extract Data into Data Mart |
V8.8 |
5. Mobile App
No. |
New Features |
Version |
1 |
Support Scrolling the Table in Non-full Screen State, Increasing the Ease of Viewing Table |
V8.8 |