|
<< Click to Display Table of Contents >> Yonghong Z-Suite V8.7 |
  
|
|
<< Click to Display Table of Contents >> Yonghong Z-Suite V8.7 |
  
|
❖New Key Features
1. Self-Service Data Preparation
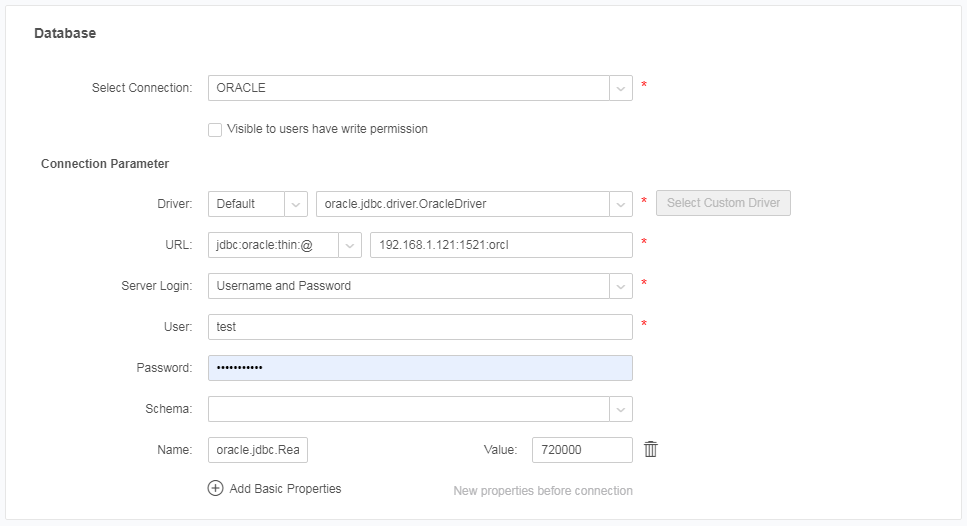
New Basic Connection Property to Support User-defined Connection Property
Some basic connection properties cannot be added in the URL when establishing the connection. For the convenience of users, the customized properties need to be added for the connection, such as oracle.jdbc.Readtimeout.
Support ThunderEngine Connection
Support connecting to Huawei's ThunderEngine database.

Support Selecting Data Set or Dashboard and Viewing Its Resource Dependency
Resources on Yonghong's platform are divided into connection, data set and dashboard. Multiple tables, charts or other components can be added to the dashboard and each component is bound to one or more data sets.
In previous versions, Yonghong has supported querying all data sets that a dashboard depends on. In the new version, we have enhanced the resource dependency analysis function. By selecting a data set, we can query all dashboards that use this data set.
When selecting a data set, you can see the overall data context of this data set, which can be seen from the following figure: Dashboard -> Data Set -> Custom SQL Statement -> Connection
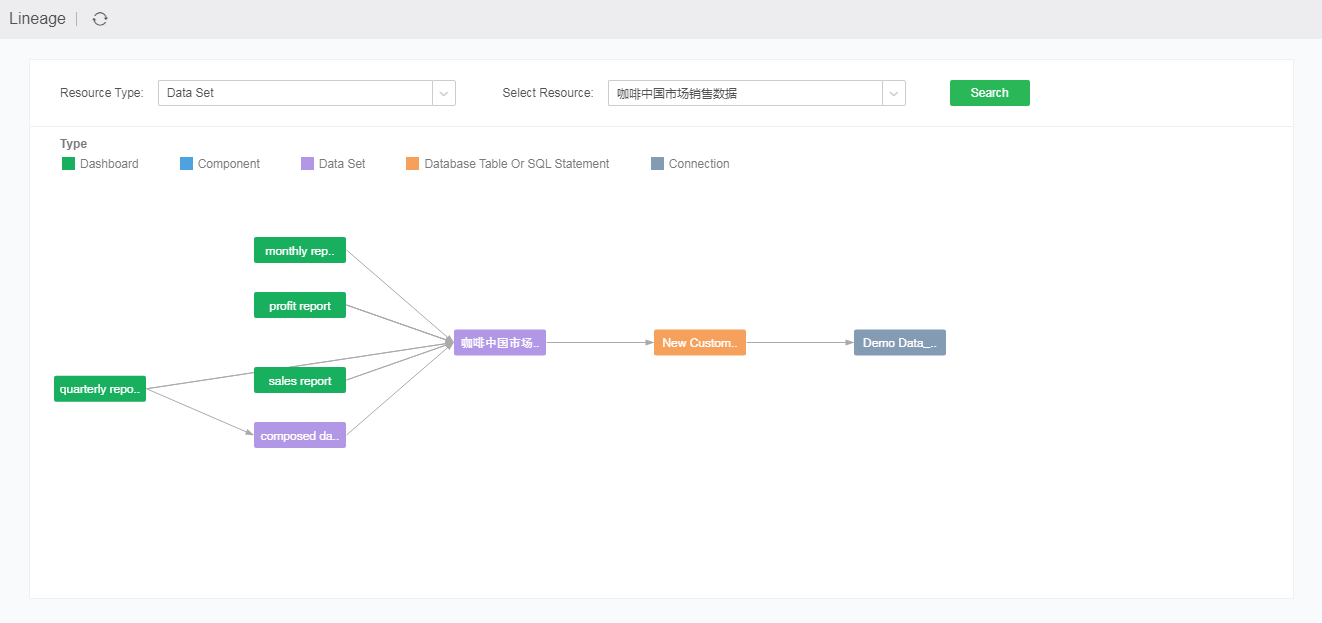
Please note that the selected data set "Coffee sales data in China market" is the only identified resource to view the context.
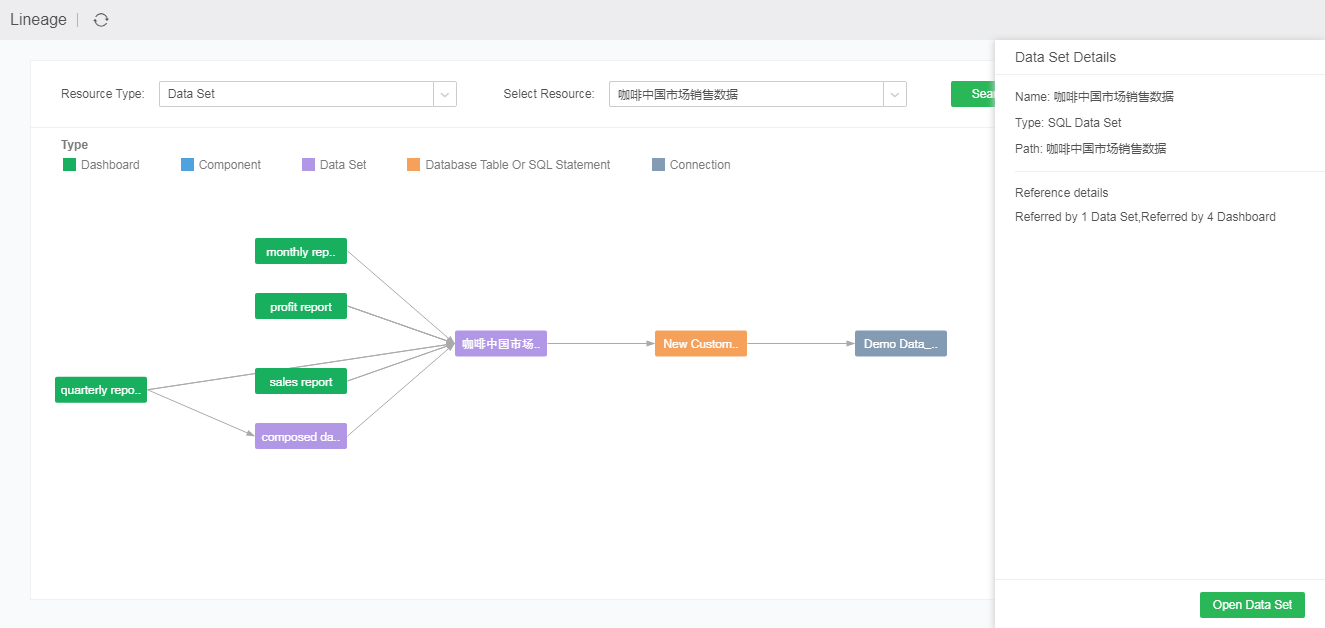
When you click this node, you can see the name, type and path on the detailed node, and you can also clearly see the references of this data set: Referenced by 5 data sets and 9 dashboards.
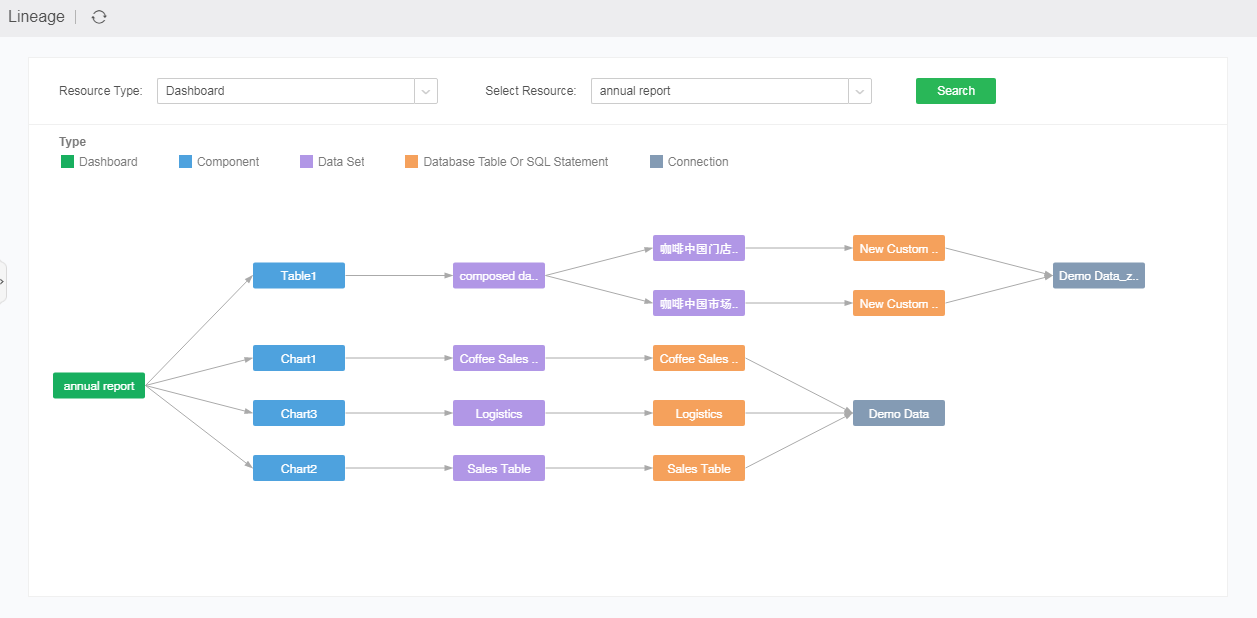
When selecting a dashboard, you can also clearly see the resource dependency analysis of the dashboard.
At this time, the "dependency analysis" of the selected dashboard is the only identified resource to view the data context. The general context is Dashboard -> Component -> Data Set -> Database Table or SQL Statement -> Connection. The specific screenshot is as follows:
WebAPI of Resource Dependency Analysis
Support to call the above two resource dependency functions by way of WebAPI.
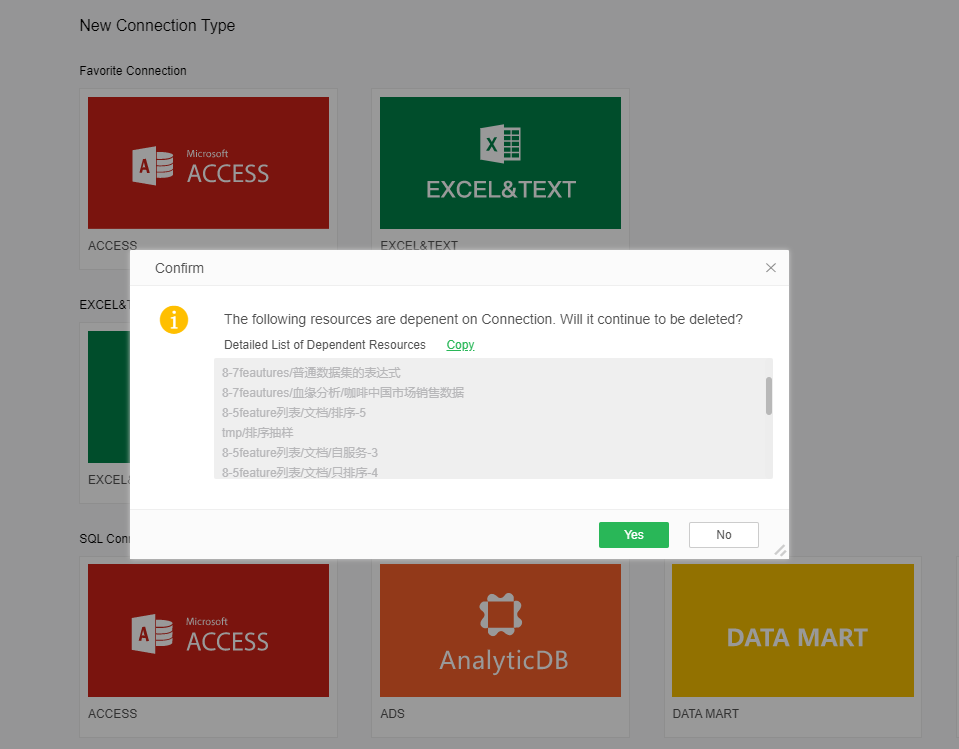
Added Delete Prompt to Avoid Accidentally Deleting Connection and Data Set
In order to avoid the administrator or data administrator deleting a resource by mistake, when deleting a connection or a data set, the user will be prompted with a resource dependency list to effectively avoid the case of accidental deletion.
Automatically Return Database Version Number and Allow User to Customize the Version Number
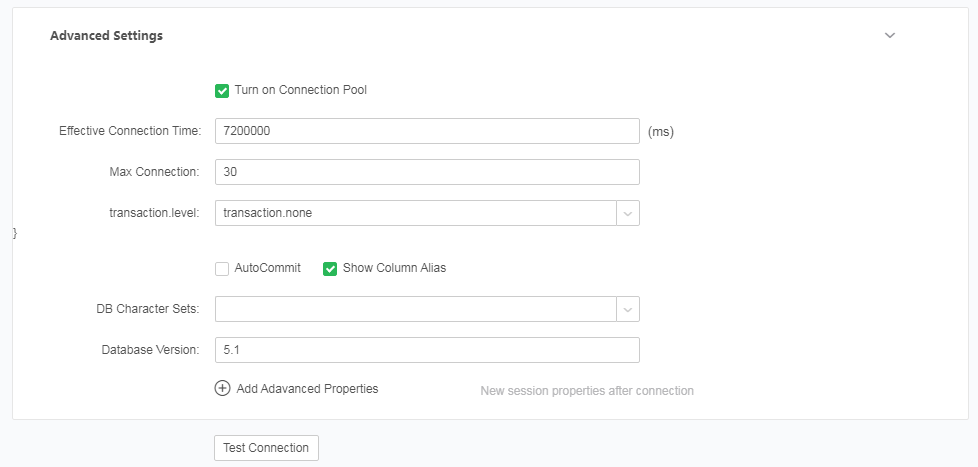
Yonghong supports different versions of database, starting from version 8.8.
As shown in the figure below, when the connection test is successful, the the main version number would be automatically filled into the database version field.
The connection has different versions. Takes Impala's built-in expression as an example, split column function supported by Yonghong is split_part, which is only supported after impala 2.3. When we test the connection, the database version number is 2.12, which is greater than impala 2.3, so the corresponding split column can be pushed down to the database (using the function split_part);
If the connection version is lower than 2.3, our product will use memory processing, which is called as post-processing in Yonghong, and display orange in the data set performance detection.
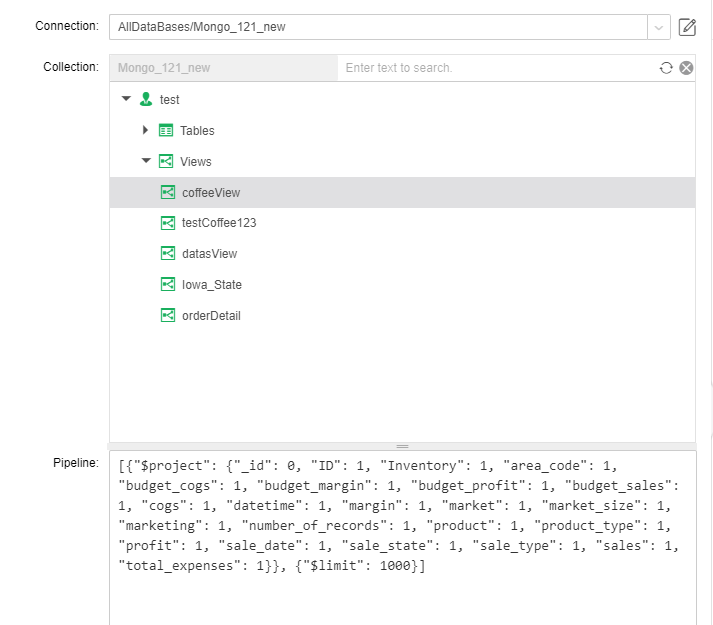
The new version supports direct access to Mongo views in a visual way. Users can write the correct pipeline command directly to obtain the view's data.
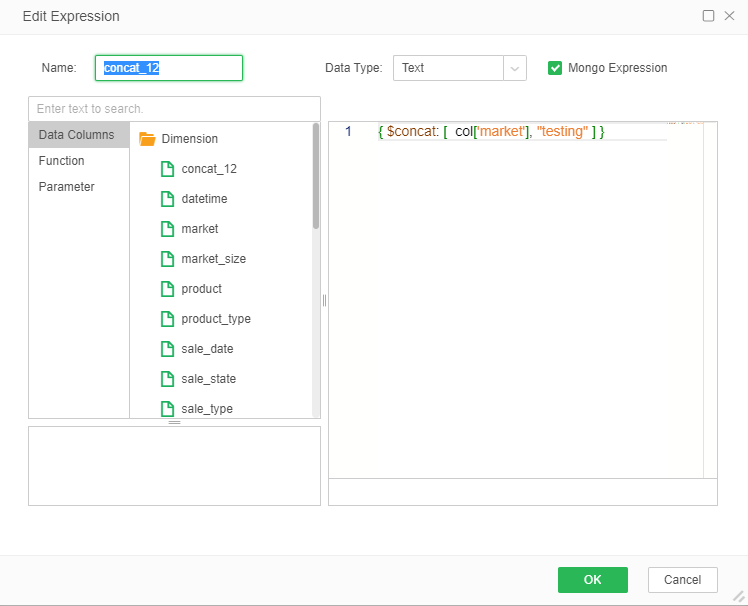
Write the Mongo expression directly in the form of pipeline statement.
Dataset Performance Optimization
Dataset performance optimization includes the following two aspects:
Background SQL optimization of approximate counting of different values and correlation coefficients;
When the self-service data set has 1 node processed by memory, the subsequent nodes do not affect the SQL of the previous node.
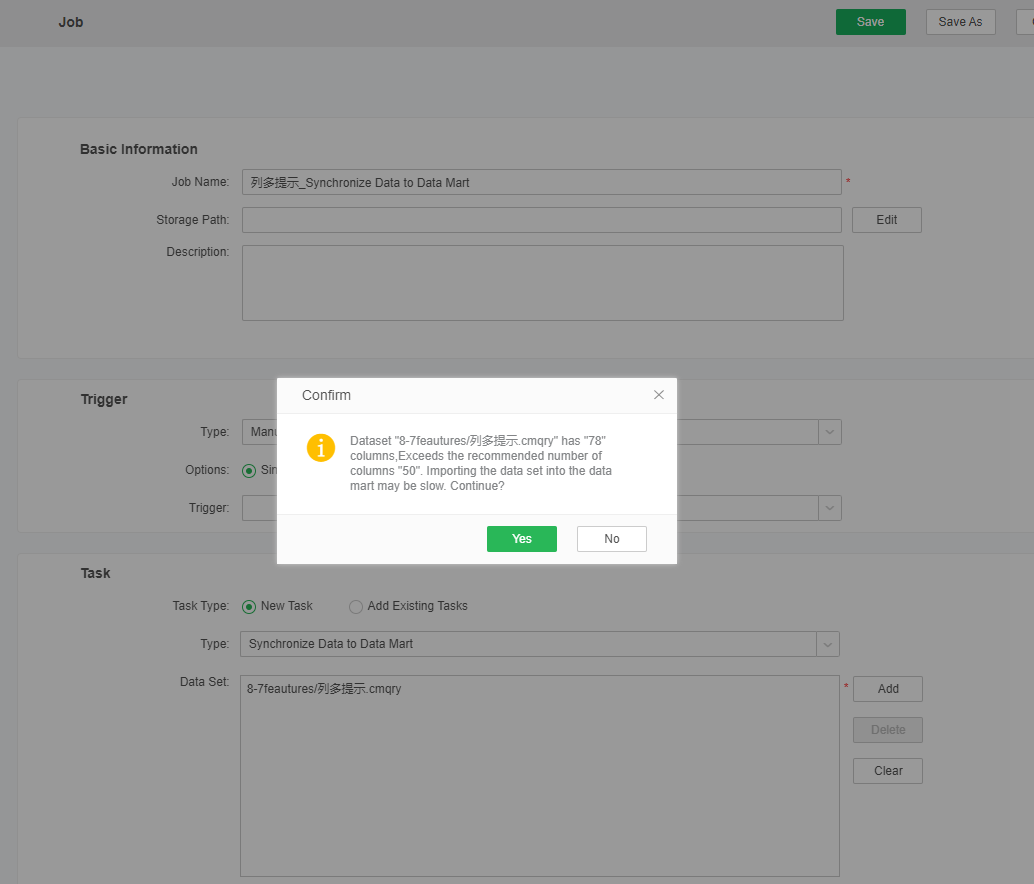
Optimize Prompt When Importing Too Many Dataset Columns into Data Mart to Improve Usability
When there are too many dataset columns, it may take a long time to import the columns into the data mart. This version optimizes the timing of pop-up prompts to better fit the usage scenarios and be more user-friendly.
No Longer Support Script Dataset
Yonghong will no longer support Script dataset starting from version 8.7.
2. Dashboard
Optimize Design of Home Page Console
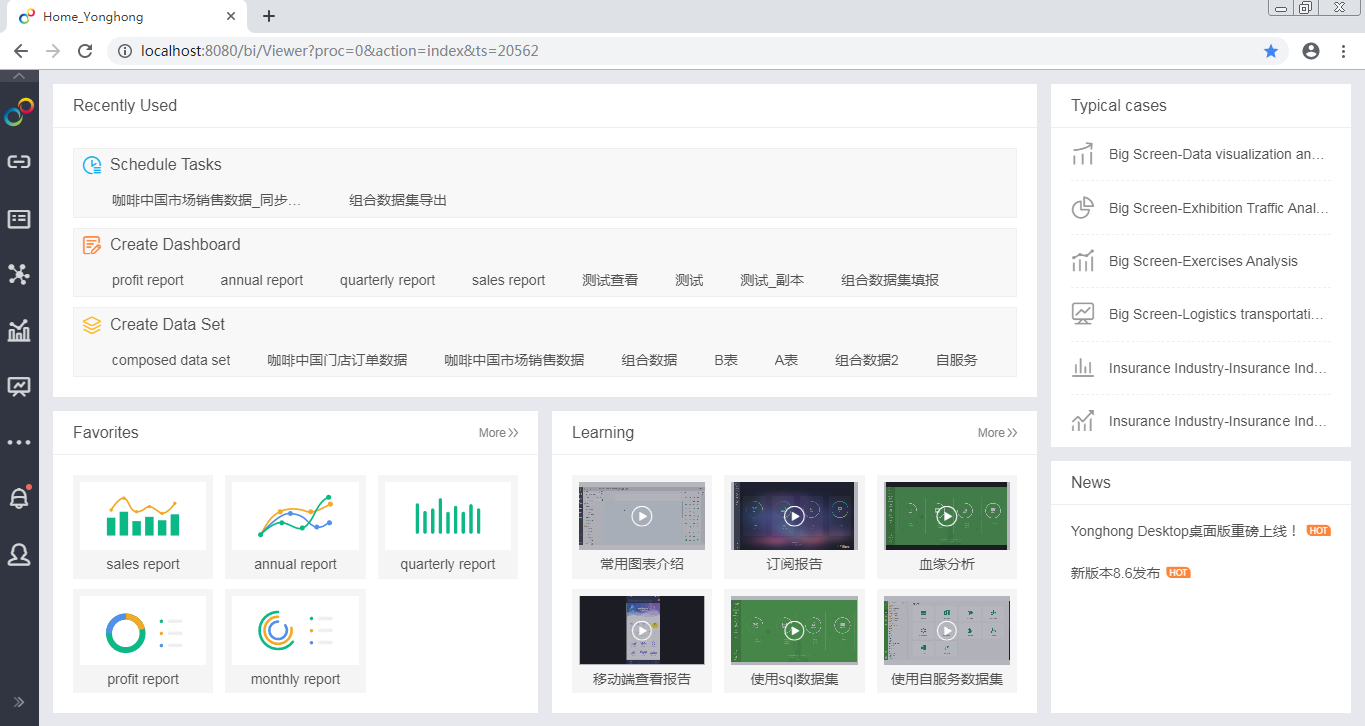
The new version optimizes the design of home page and adds the Recently Used, Favorites, Shared By, Learning, Typical Cases, News, Data Exploration, Features Introduction, etc.,so as to improve the product usability, as shown in the figure below.
•About Home Page
Recently Used: Display the most recently edited and viewed content for quick access, including Edit Dashboard, View Dashboard, Connection, Data set, Workflow, Schedule Tasks, etc.
Data Exploration: Display the data exploration process and introduce the functional significance of each step, to give users a basic understanding of data exploration.
Learning: Recommend the related teaching videos according to the user attributes, such as recommending dashboard editing videos to dashboard editor, and data processing videos to data processor.
Favorites: Display the user's favorite dashboards.
Shared By: Display the dashboards shared by other users.
Robot: Intelligent question-and-answer robot that solve users' frequently asked questions and guide them
News: Company news, publicity, version updates, etc.
Typical Cases: Display the typical functional demonstrations and industry cases.
Features Introduction: Mainly display the new features of versions.
•How to Configure Home Page
Users with admin permission can configure the content to be displayed through the System Settings - Home Page Configuration, as shown in the following figure.
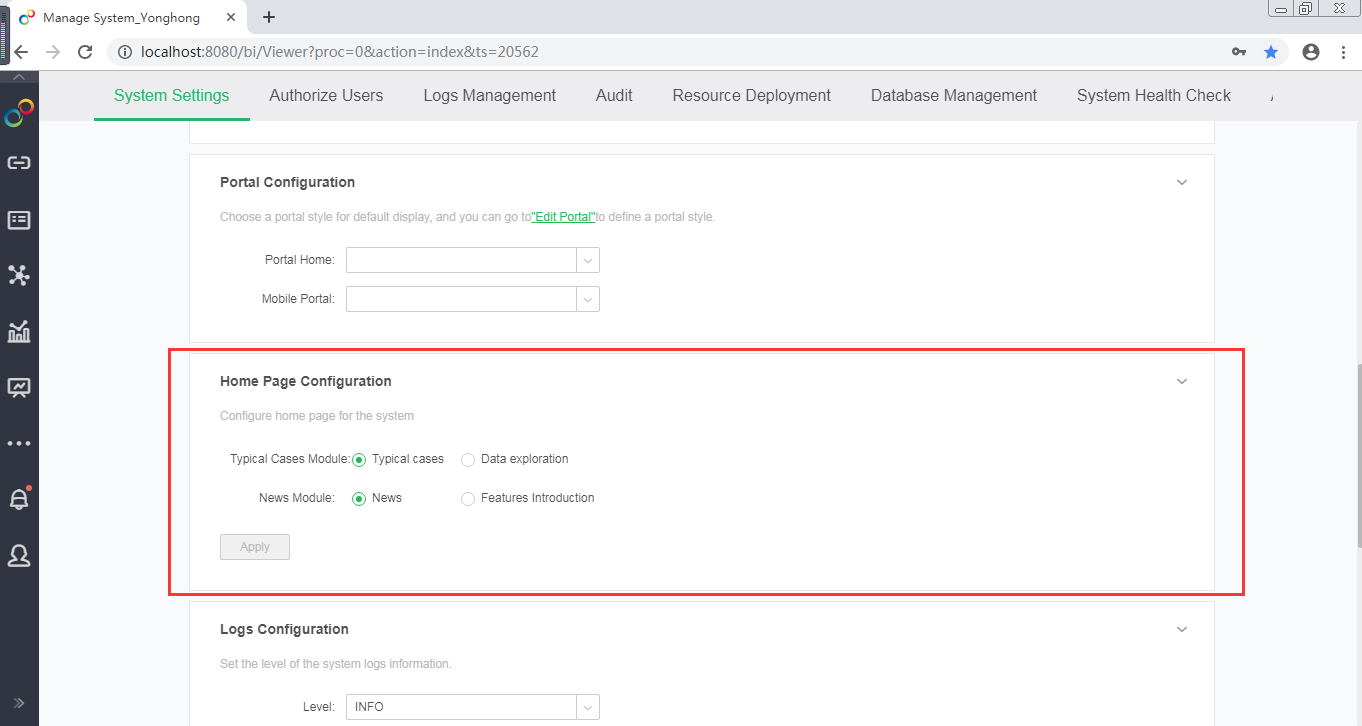
The Typical Cases module can be configured as Data Exploration, and News module can be configured as Features Introduction.
Users can configure the content of Learning module according to their actual needs. If users want to configure customized videos, they need to add the index.xml file under the product installation directory "bihome". The specific format is shown in the figure below.

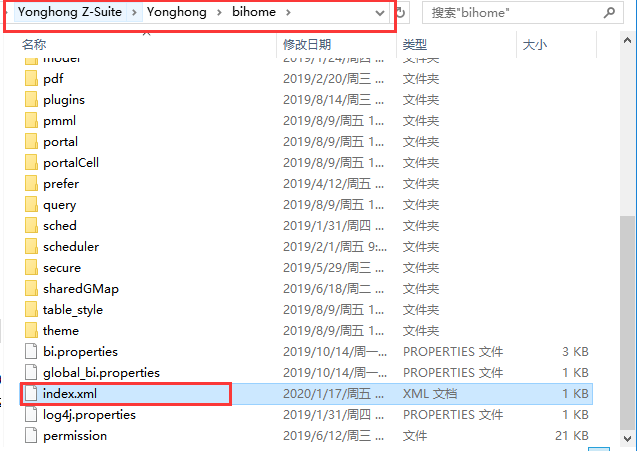
Users can add content by the <video> tag, and the <more> tag is used to specify the address to jump to when clicking More.
After adding the index.xml file, refresh the page and the configuration will come to effect.
Portal Feature Enhancement and Interaction Optimization
The new version optimizes the entire portal design interface, and the layout method is optimized to integrated layout and horizontal layout.
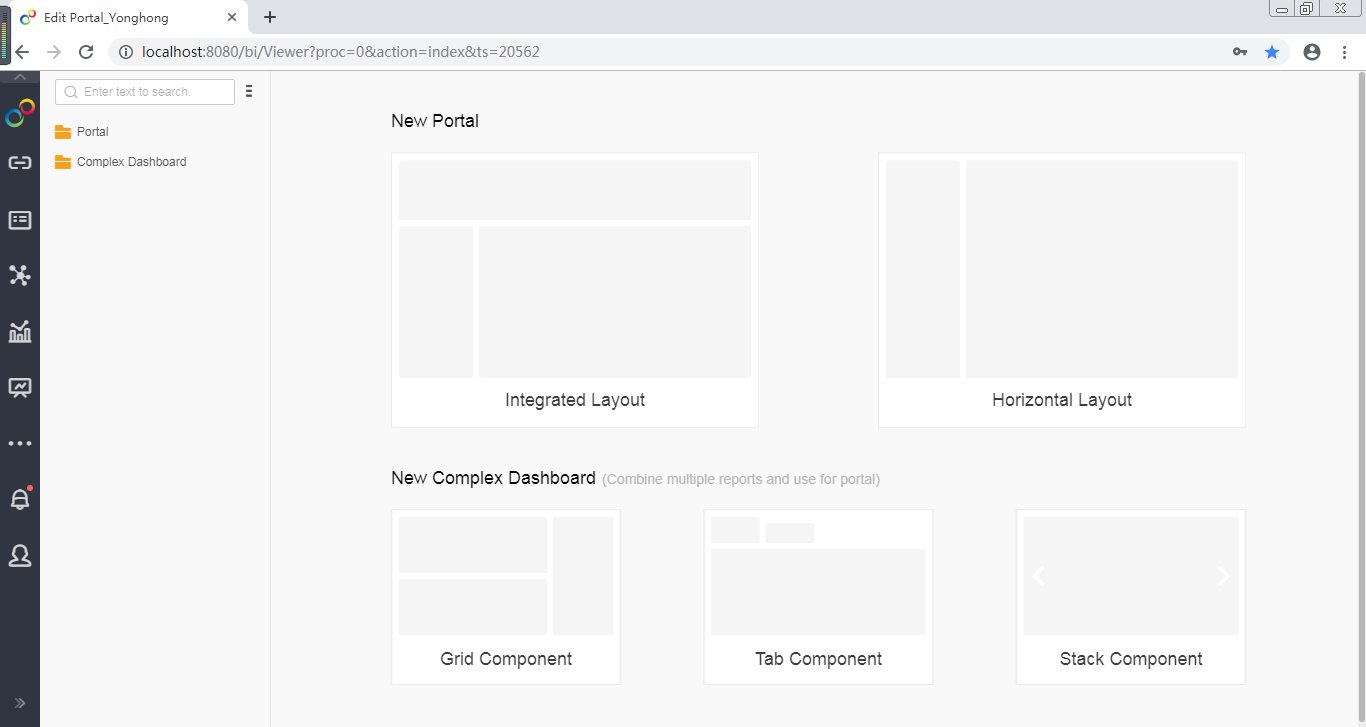
The Portal module also optimizes the menu logic and the interface interaction, and the relationship between navigation and menu is clearer, as follows.
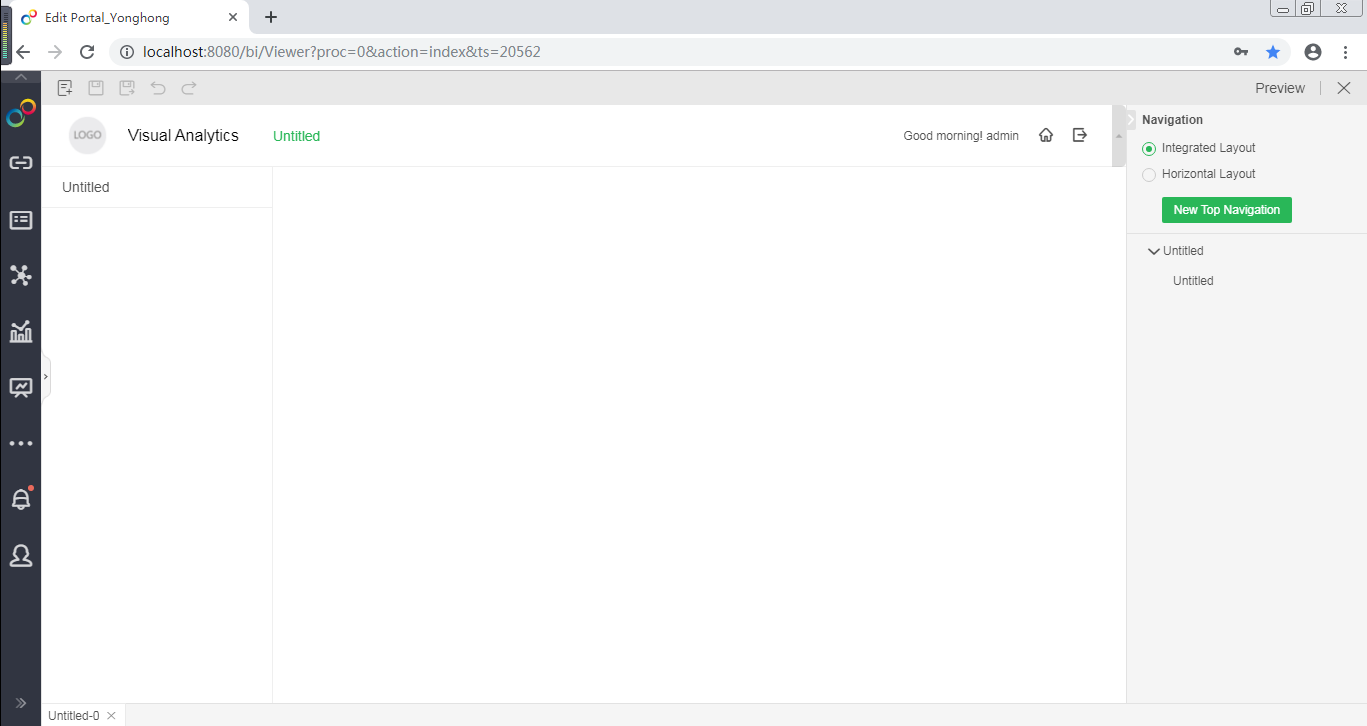
Users can set the navigation/menu in the portal through menu, including Name, Binding Dashboard, Icon, Whether to hide, etc. Users can also set the Home Page and add new item.
Different submenus can be added under level 1 navigation, such as top navigation and left level 1 navigation (left layout). In this way, users can switch to different menu pages when clicking on different level 1 navigations, and the hierarchy is more reasonable to meet more usage scenarios.
•Data reporting supports temporary storage
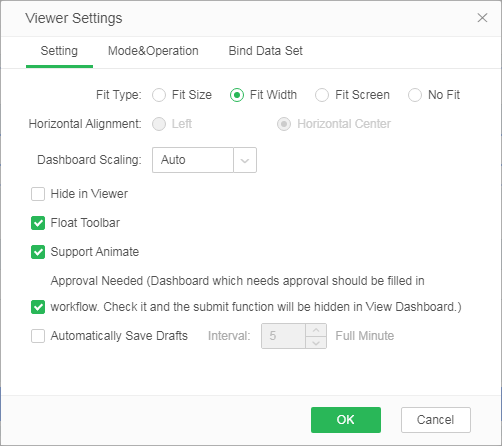
Add Automatically Save Drafts to Viewer Setting menu to temporarily save the filled data, so you can continue the data filling when you open it next time.
Automatically Save Drafts and Interval can be set. Brush, zoom, drill-down and linkage operations do not support saving.
•Form component supports data linkage
Form component supports linkage effect of cells, that is, the options of the drop-down box depends on the values of another column (association condition column). As shown in the figure below, select the association condition "Province" for "City", then when the province is "Sichuan", only the cities of Sichuan Province can be selected in the city drop-down box in the same row.
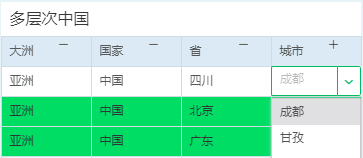
The linkage of form component supports the linkage of same source data, that is, the options of drop-down box and the data of association condition column are from the same connection. For linkage of same source data, you just need to select the association condition in editor to realize linkage.
The linkage of form component also supports the linkage of different source data, that is, the options of drop-down box and the data of association condition column are from different connections. At this time, you need to select the association condition and associated data value in editor.
•Add built-in parameters for form parameters
Add four parameters: user, current time, workflow instance ID and execution ID for parameter source field. Built-in parameters can be hidden in the dashboard and directly recorded to the target table.
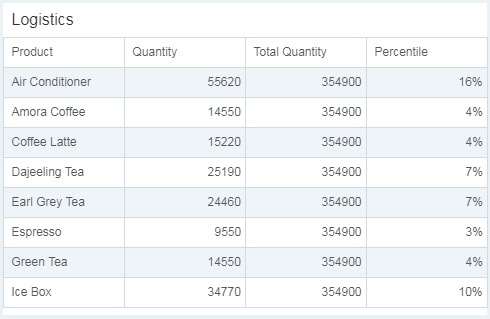
In previous versions, there was an association between multiple fields that expanded in the same direction in a freestyle table. But in some usage scenarios, there may not be an association between rows or columns. Therefore, in the new version, Yonghong has optimized the freestyle table to allow multiple fields without association to expand in the same direction, that is, the relationship between rows or columns is more free and flexible.
Take the following table as an example. In the past, due to the association between rows, this table can only calculate the quantity of Amora coffee in the Beijing market. In this tabular form, it is impossible to calculate the quantity of Amora coffee in various markets across the country.

While in the new version, this table can also calculate the quantity of Amora coffee across the country, without being affected by the "province" in above row, as shown in the figure below. Users can decide whether to calculate the quantity of Amora coffee in Beijing market or in various markets across the country according to their business scenarios.

Not only rows, but columns can also be expanded without selecting associations. For example, in the figure below, the quantity reflects the quantity of each product and has an association with the product column, while the total quantity reflects the total quantity of all products and has no correlation with the product column.
Add Date Parameter App to Quickly Filter the Range Based on A Certain Time
The new version adds Date Parameter application. Users can download and install the app from the app store. The user interface is as shown in the figure below.

Users can select a base date to quickly filter data of This Week, This Month, Front 7 Days, etc. based on this date. Users can also customize the time range and select the front/back time range, as shown in the figure below.

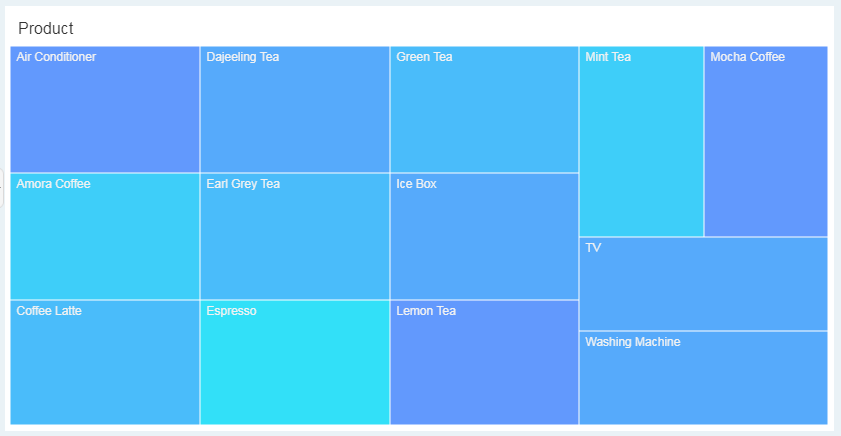
Optimize Gradient Algorithm to Improve the Color Saturation
The new version of gradient adds HSV algorithm to pick up color, which improves the color saturation.
Add Bookmark Function to Freely Save User's Filtering Condition
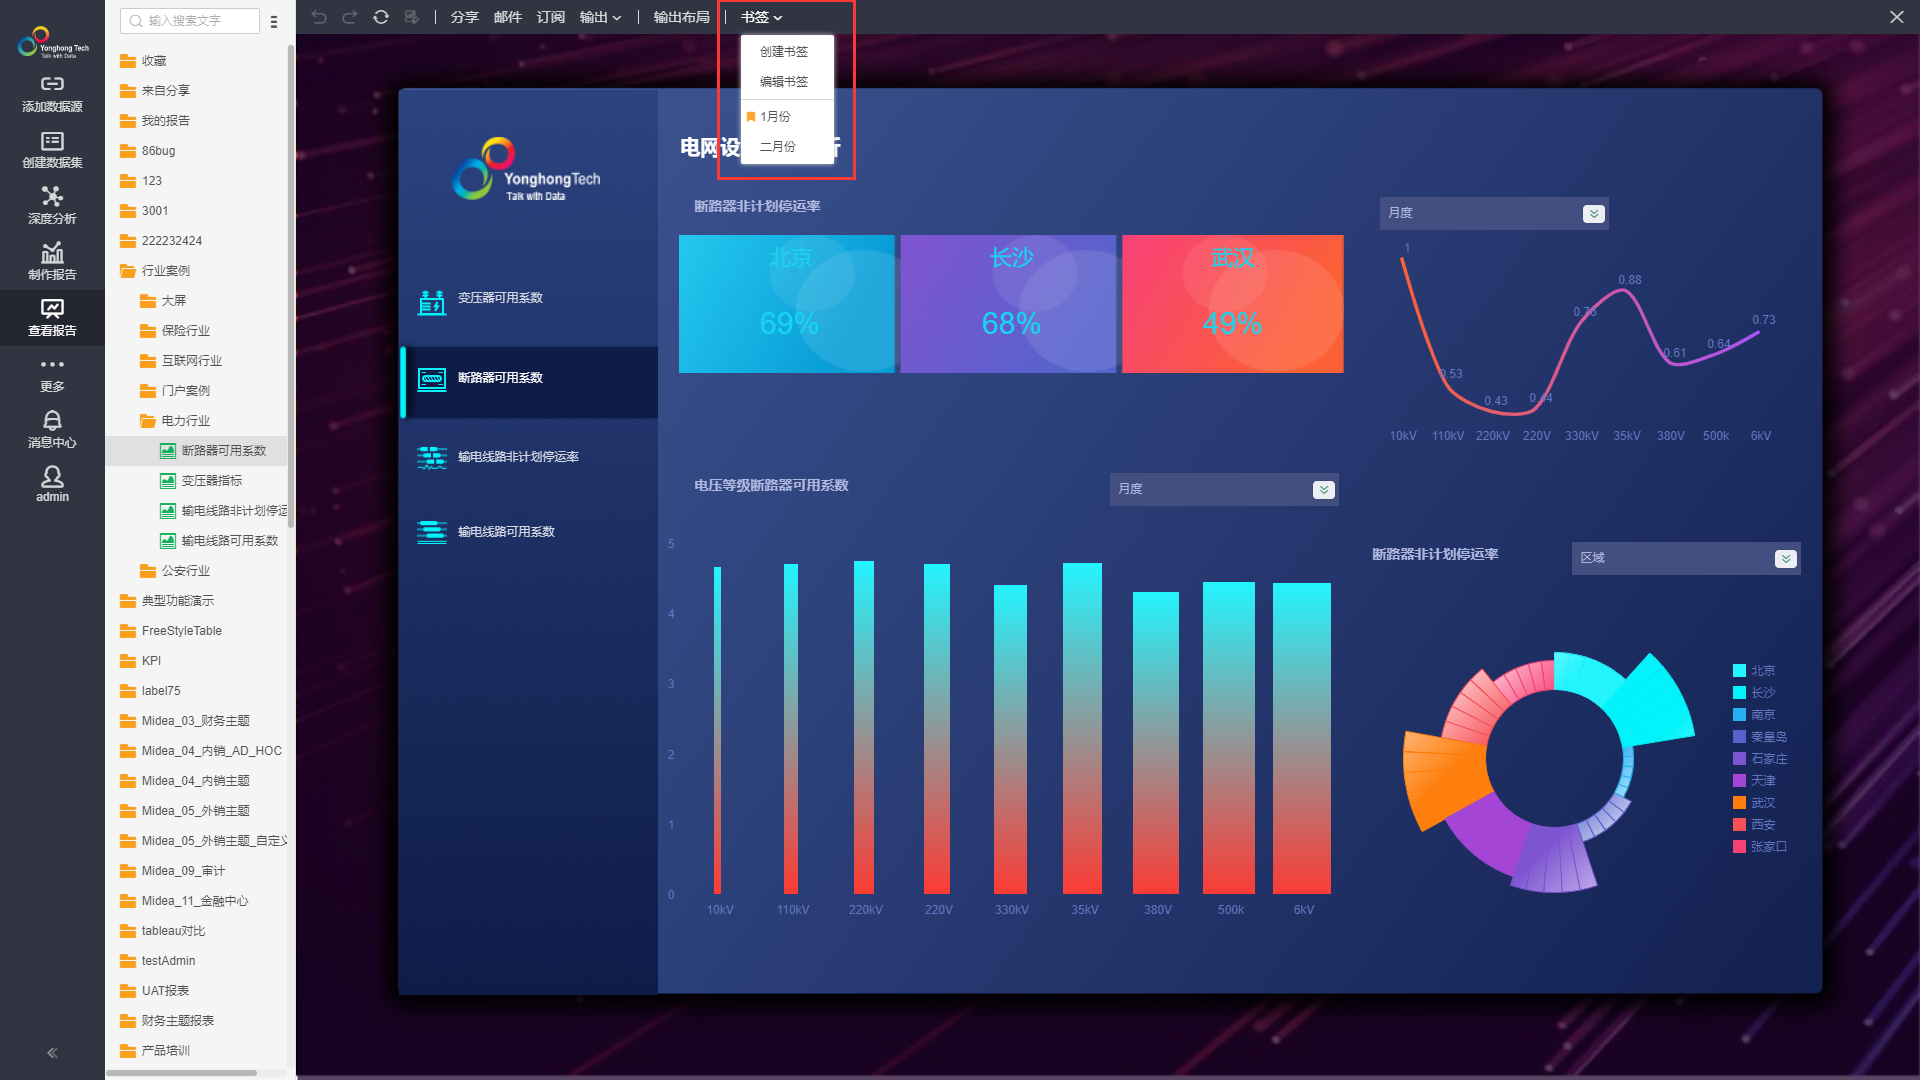
The new version adds bookmark function to View Dashboard. When viewing the dashboard, if users often filter certain types of data, they can save the filtering conditions through bookmark function at any time. The saved filtering conditions can be set as the user's default option to open the dashboard. The new version also supports switching different bookmarks to view different filtered data during the viewing process.
Filter and Parameter Components Support Fuzzy Search to Optimize Search Experience
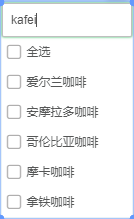
In the new version, the list filter, tree filter, list parameter, and drop-down parameter support fuzzy search. Chinese content can be matched by pinyin or the first letter of pinyin, which improves the search experience.
Add Return Configuration to View Dashboard to Meet Platform Integration Scenario
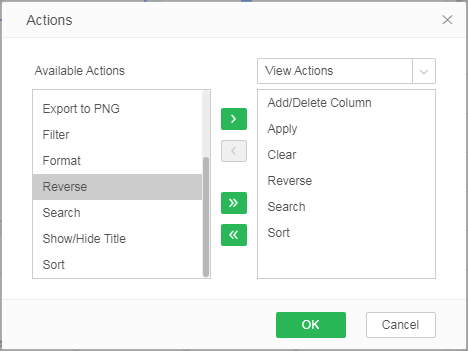
Add Return configuration to Dashboard - Viewer Setting. If the return action is not configured, the return button will no longer be displayed when the user performs a hyperlink jump on the View Dashboard page. Users can determine whether to keep the return button according to the needs of platform integration.
Map and Dot Map Support Custom Shapes to Meet More Personalized Needs
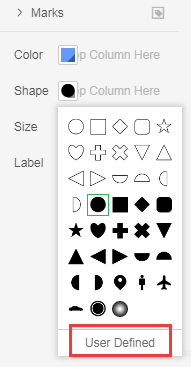
The new version of maps, Gis maps, dot maps and stacked dot maps supports user-defined shapes, which is limited to svg format pictures.
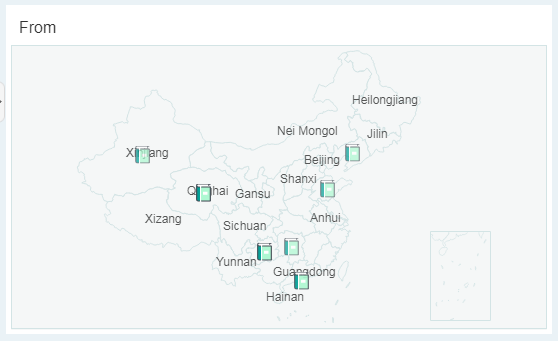
After uploading the picture, users can set the shape, and the display effect is as follows.
Optimize Overall Interface Interaction to Improve User Experience
The new version optimizes the design of overall interface interaction, greatly improving the user's visual and interactive experience.
3. Advanced Analysis
This version optimizes the experimental performance of large data volume, supports the application of the trained models generated by experiments to experiments, and optimizes the logic of exporting advanced analysis experiments to database, so as to prepare for the implementation of algorithm plug-ins in the future.
Optimize Experiment Performance
For experiments with large data volume, it takes a long time to display node data and apply trained models. The new version solves the problem to improve computing efficiency.
It optimizes the display of data nodes and application of trained models to shorten the data loading time.
Support Direct Application of Trained Model in Experiment
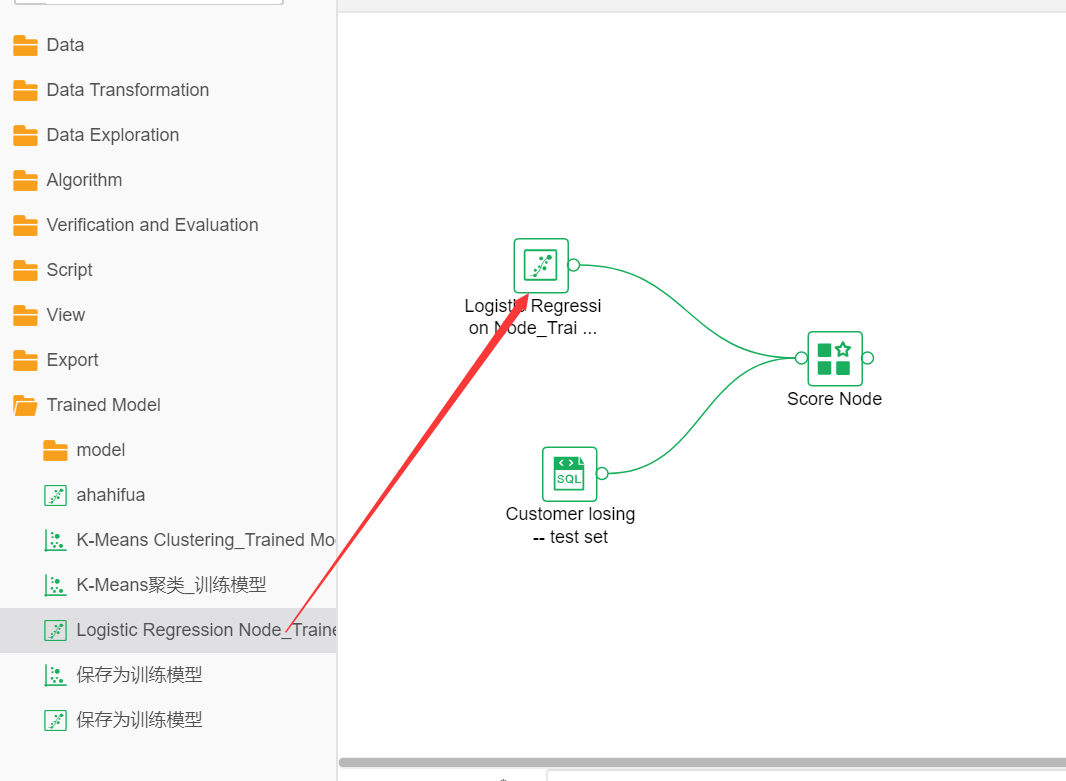
The trained models obtained through experiments can be saved as "Trained Model" and stored in the Trained Model folder under operation. The trained models in this folder can be directly applied as model nodes in the experiment.
The connection rule of trained model nodes is: the trained models of K-means Clustering, and Decision Tree can be connected to Score Node. R trained models can be connected to R data nodes. Python trained models can be connected to python data nodes.
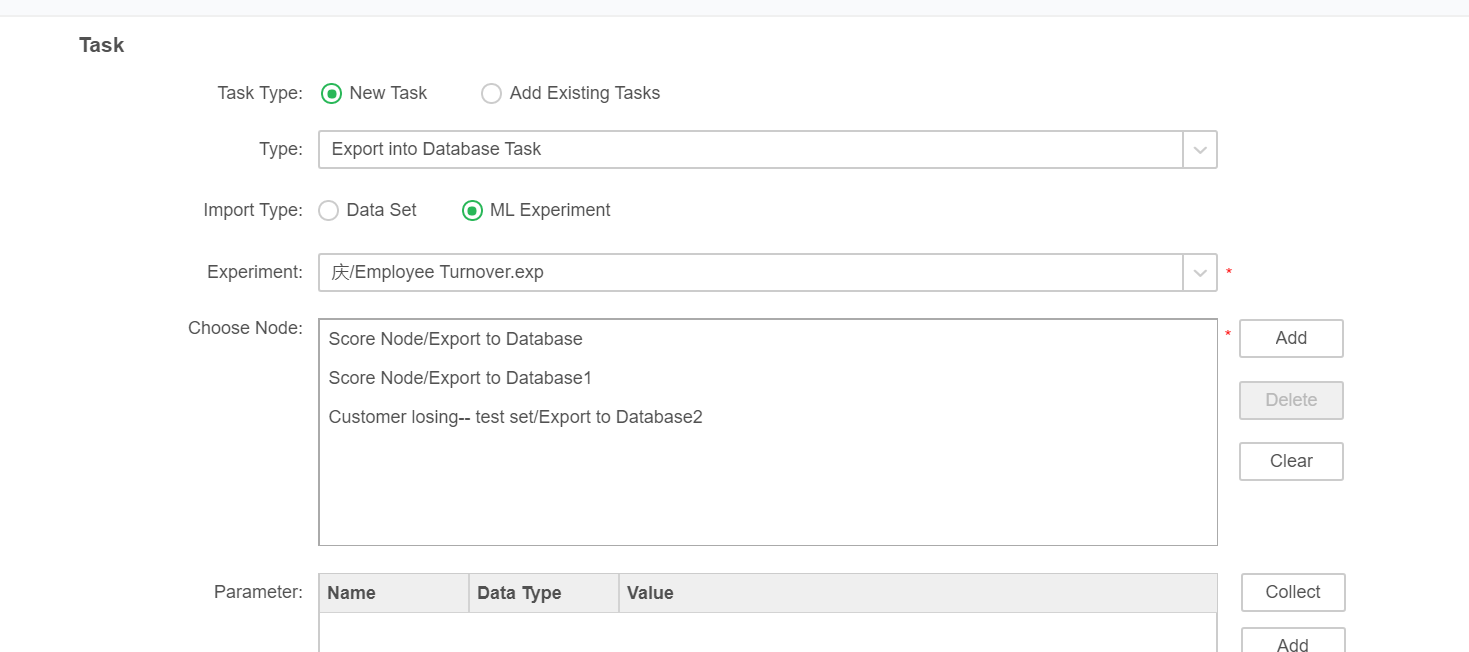
Optimize the Logic of Exporting Advanced Analysis Experiment to Database
The logic of exporting advanced analysis experiment to database is optimized. The task of exporting multiple data nodes to the database can be performed at one time according to the selected experiment.
4. Workflow
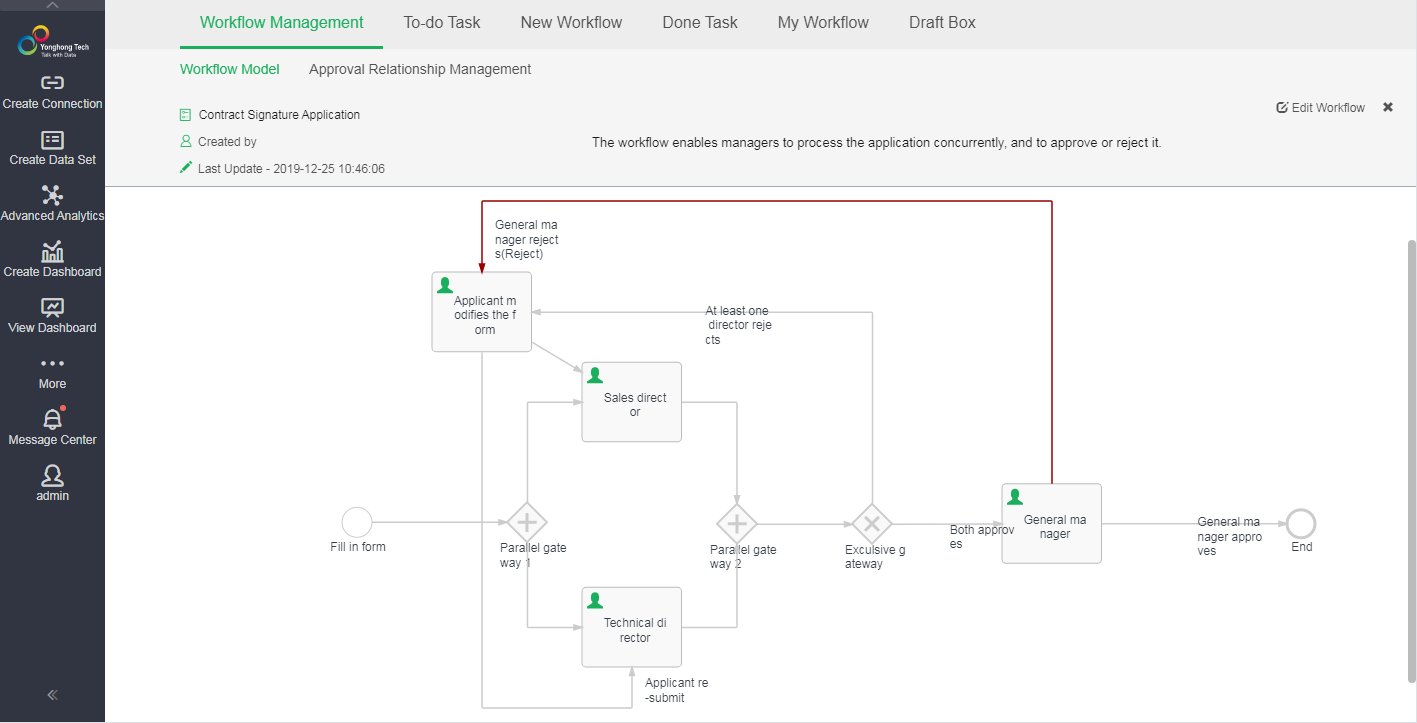
In the new version, the workflow is more complete when you preview or view it. The previewed or viewed workflow is exactly the same as the workflow in the production process.
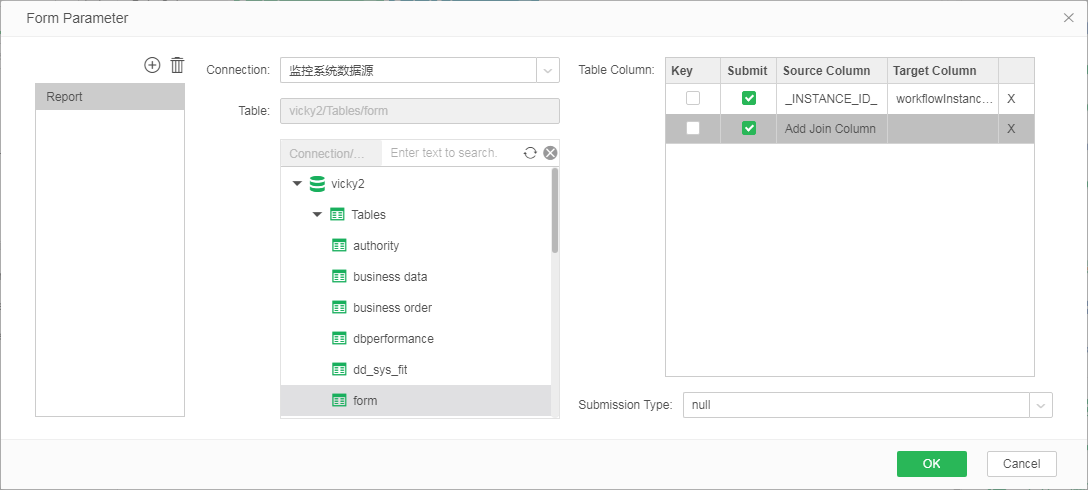
If the form and form data are to be displayed in an approval process, the form data needs to be marked with this process identifier. Otherwise, a lot of data is stored in the data table. These data may come from the same person or from different people. The process cannot determine which data should be displayed at present. Only when the data carries the unique identifier of the process, can the process find the data that the current approval process should display based on the unique identifier.
In previous versions, users need to bind the parameters of the process identifier to the form parameter component, so that the value of the process identifier can be stored together with the data of the form parameter component. Or users need to write a script to store the value of the process ID with the data. This method is rather complicated. Therefore, in version 8.7, we have optimized the usability of this issue. Now, you just need to select the process identification parameter "? {_ INSTANCE_ID_}" "?{_ EXECUTION_ID_}" and the target column for them in the form parameter setting, so the process identification value can be easily stored with the form data.
Add "Delete Connection" to Delete the Workflow Database Table
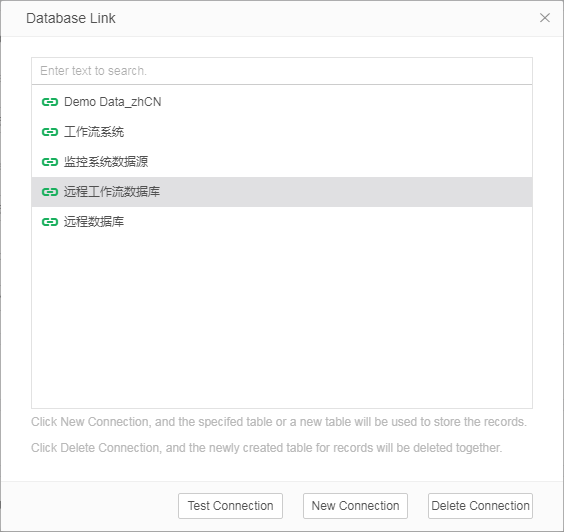
In the database connection configuration, you can not only create workflow database tables, but also delete existing workflow database tables. In version 8.7, if you are sure to delete the workflow database table, you can delete the workflow table in the database connection window.
! Note: When deleting the connection, the workflow data in the database will also be deleted.
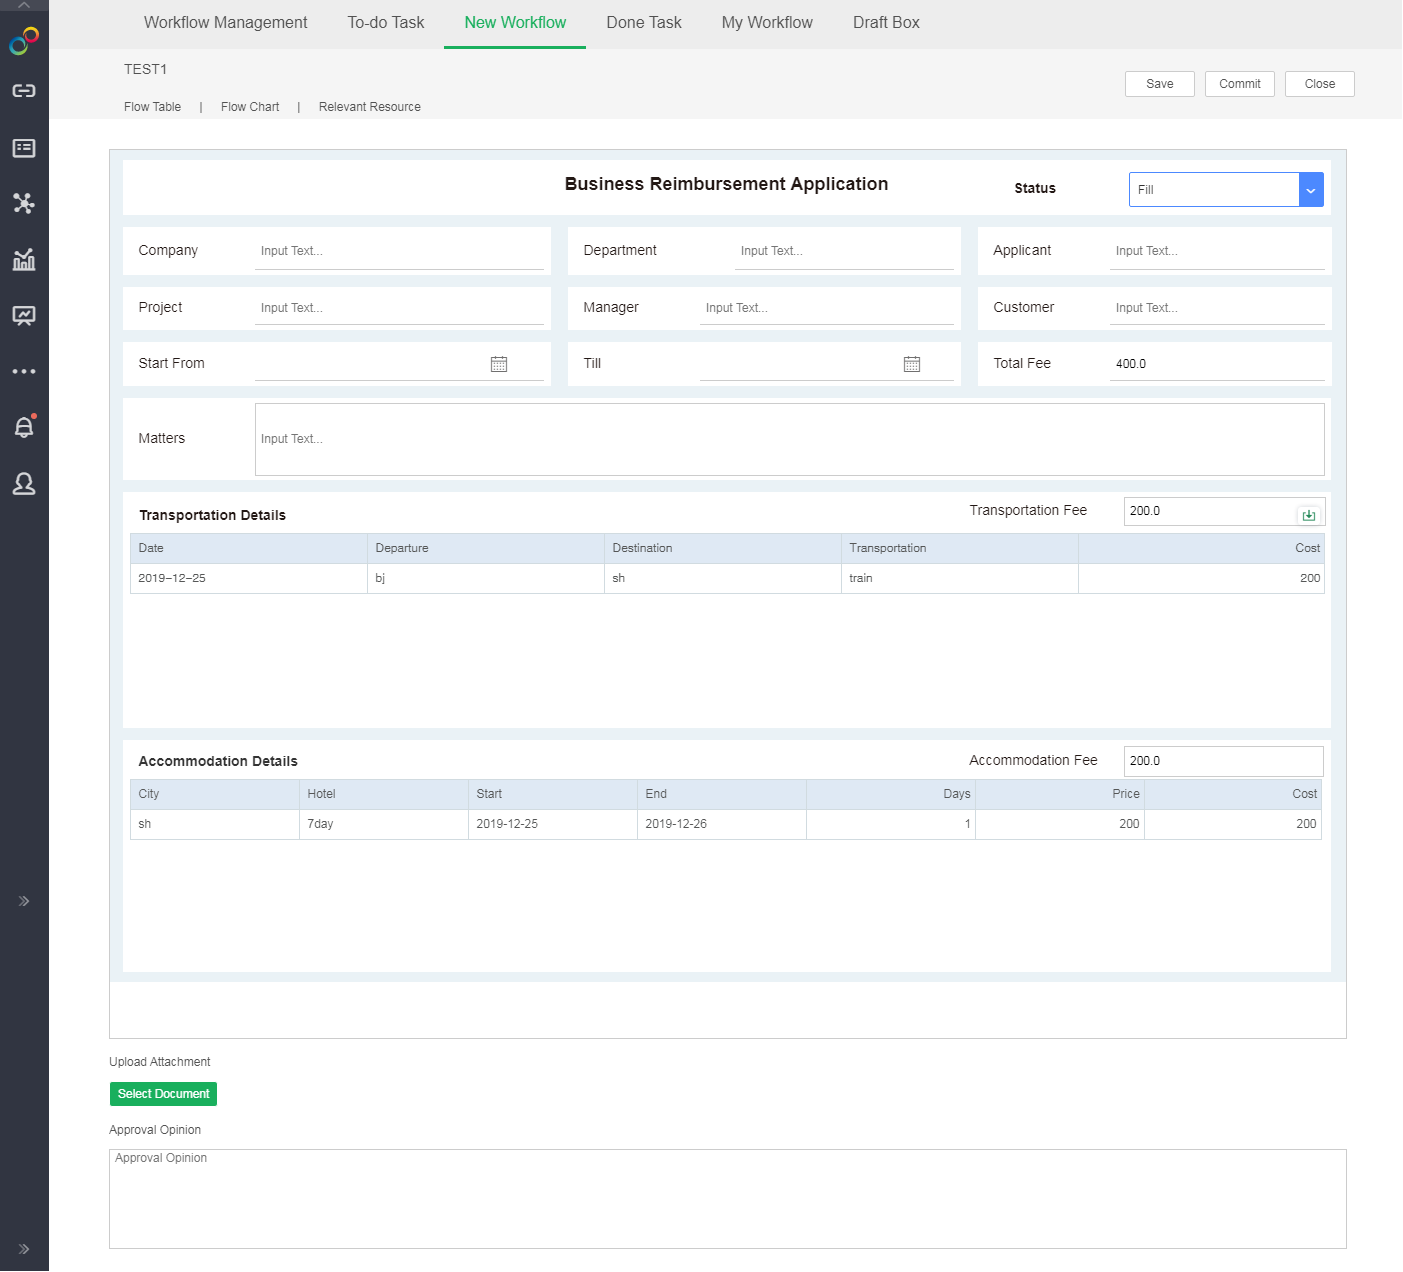
Add Data Saving Function to Temporarily Save Data not Submitted for Approval
During the initiation process or approval process, business personnel may fill in some data in the form, or fill in the approval comments, and upload attachments. But for various reasons, for example, you need to deal with other matters first before finishing the form, or you want to check it even though you have finished filling the form, you can't submit it for approval. At this time, you must save the data and approval comments that have been filled in as well as the uploaded attachments so that you can continue to fill in the next time you open it.
In version 8.7, we support the Save function to meet the needs of users for saving.
When you click Save, the data and approval comments that have been filled in as well as the uploaded attachments will be saved.
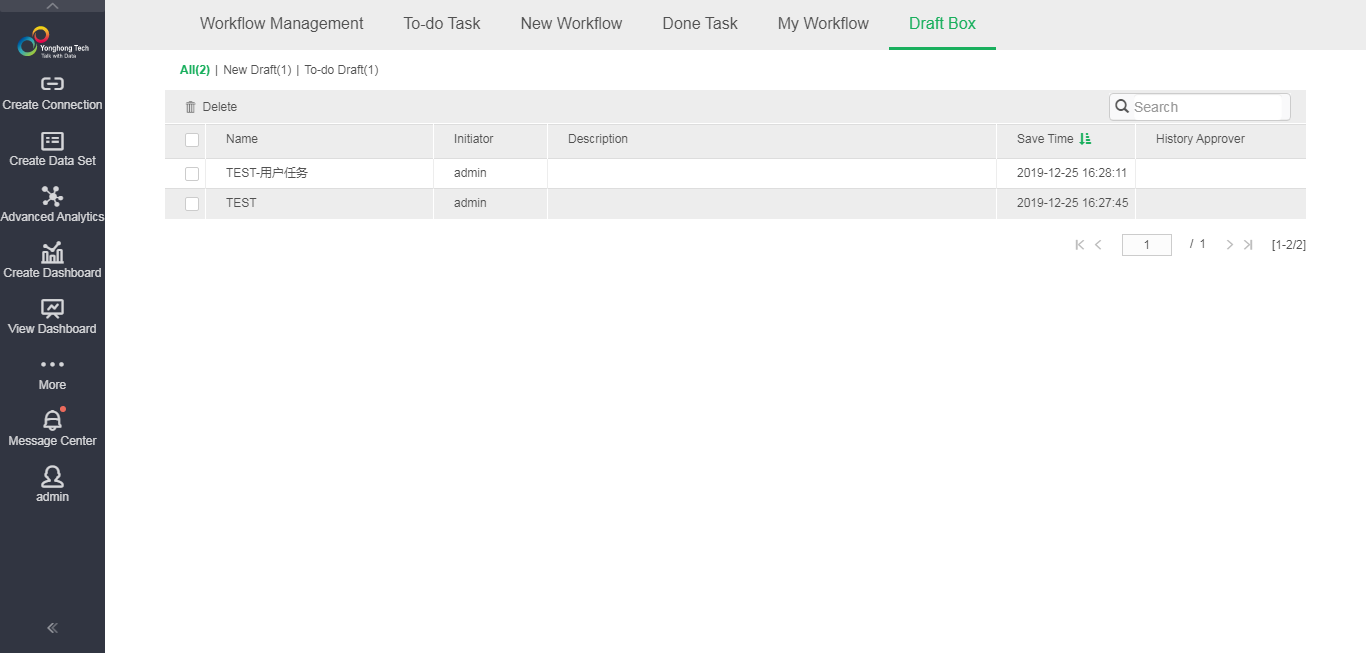
Users can find their own saved data in the draft box. If you have unwanted draft data, you can select it and delete it.
5. Enterprise Management
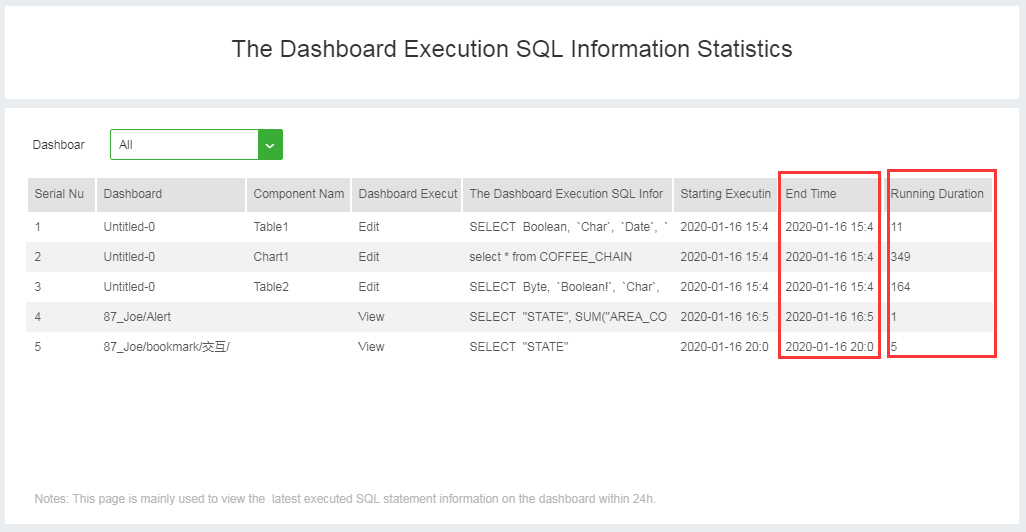
Audit Adds New Indicators: End Time and Running Duration of SQL Statement Execution
Add End Time and Running Duration of SQL statement in "The Dashboard Execution SQL Information Statistics" of audit.
Classify Audit Dashboards According to the Audit Content to Facilitate Finding the Target Audit Information
Four folders have been added to Audit, namely Market Information, Blood Information, Performance Statistics and User Performance.
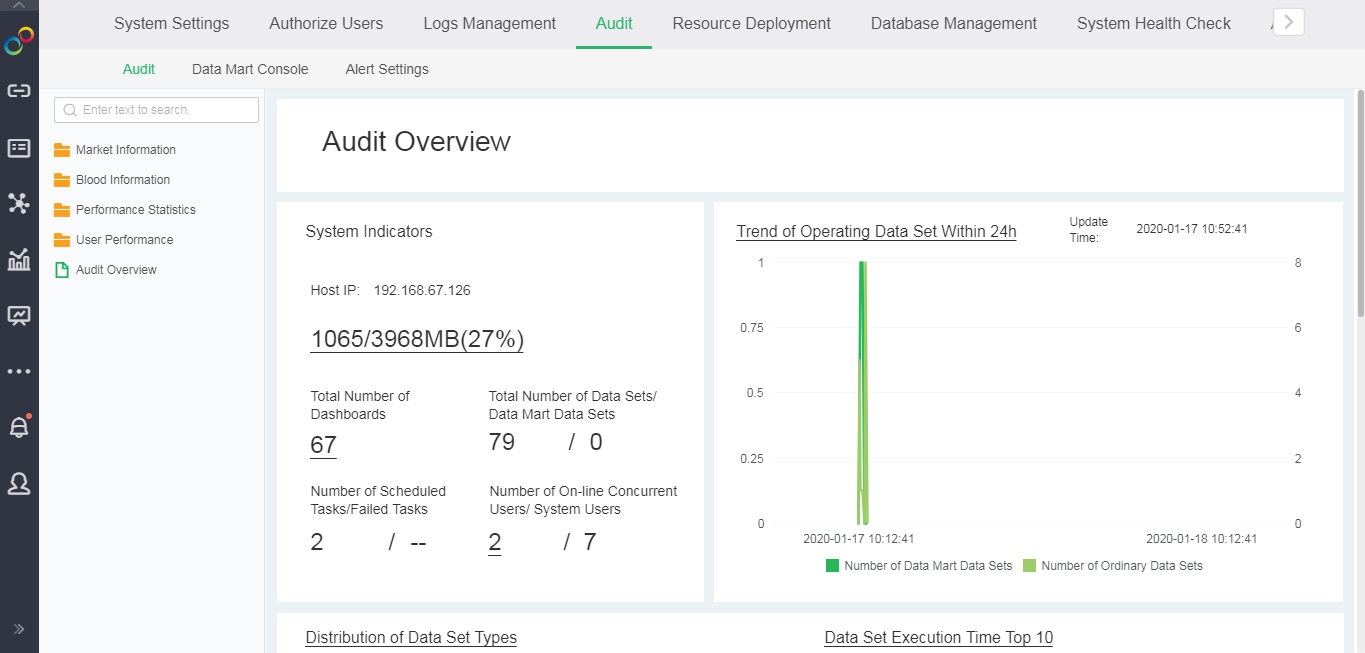
All audit dashboards are classified into these four folders according to the audit content, to facilitate users to quickly find the target dashboard.
Add Memory Alert to Timely Remind Administrator of Small Remaining Memory
Alert Settings add alert task to monitor the memory utilization of the product. When the remaining memory space is less than 20% of total memory, the alert task will be triggered and an alert message will be sent to the responsible staff.

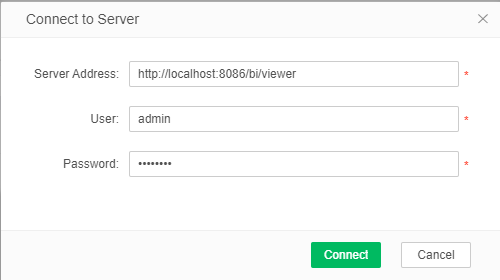
Support Connecting Desktop to Server and Uploading Dashboard
By entering the server address, user name and password, the desktop version can be connected to server;
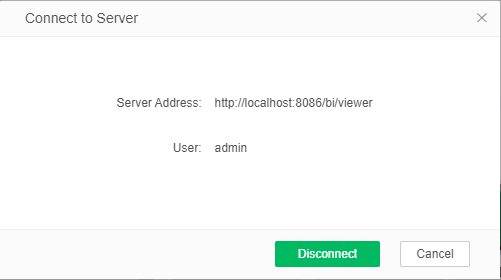
The desktop version will save the connection status during the session, and the user can disconnect at any time.
After connecting to server, you can upload the finished dashboard and the resource it depends on to the server in the Create Dashboard module. The system will detect whether the uploaded resource exists in the server, and the user can choose whether to overwrite existing resources.
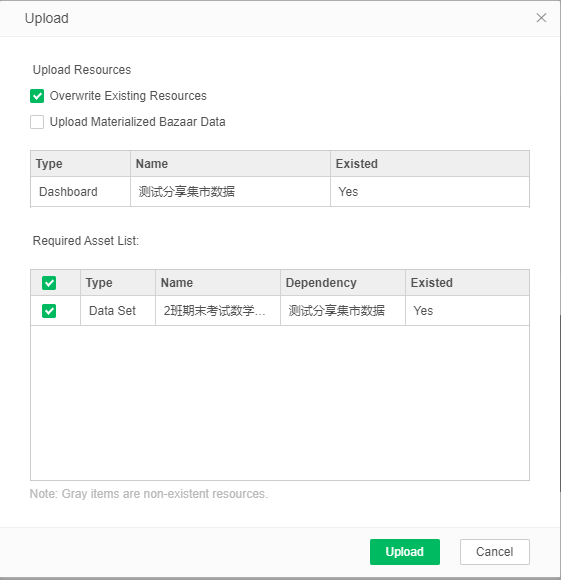
If the dataset used in the dashboard is materialized through the "Synchronize Dataset Data" operation, you can choose whether to upload the materialized data. If you choose to upload, the server will query the materialized data.
If the data used in the dashboard is imported into the mart through "Incremental To Data Mart", the folder where the mart data locates will be uploaded to the server, where the mart data will be queried. If a folder with the same name exists on the server, the mart file will not be uploaded.
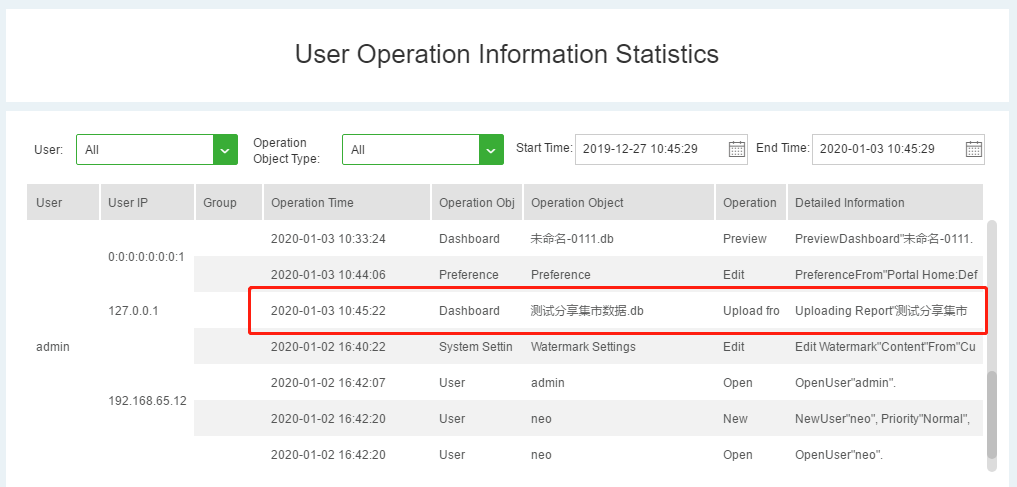
After successful uploading, a message will be pushed to the admin user in the server.

At the same time, a new operation record that records the resource details uploaded by user will be added to the "User Operation Information Statistics" of server audit.
6. Big Data
Performance Analysis of Dashboard Level
Generally, the steps of opening a Yonghong dashboard are divided into: opening the dashboard, execution data of different components on the dashboard, and returning the data resultto the foreground for rendering, etc.
This process has always been the focus of our customers' concern. Users are more concerned about the key steps to open a dashboard, where the execution time of each step is spent, which part takes more time, and then take certain measures to reduce the time-consuming steps.
The corresponding data is stored in audit with the table name of DBPERFORMANCE*. Helping users find the reasons for slow execution from the monitoring data of execution time can solve the performance problems in a targeted manner.
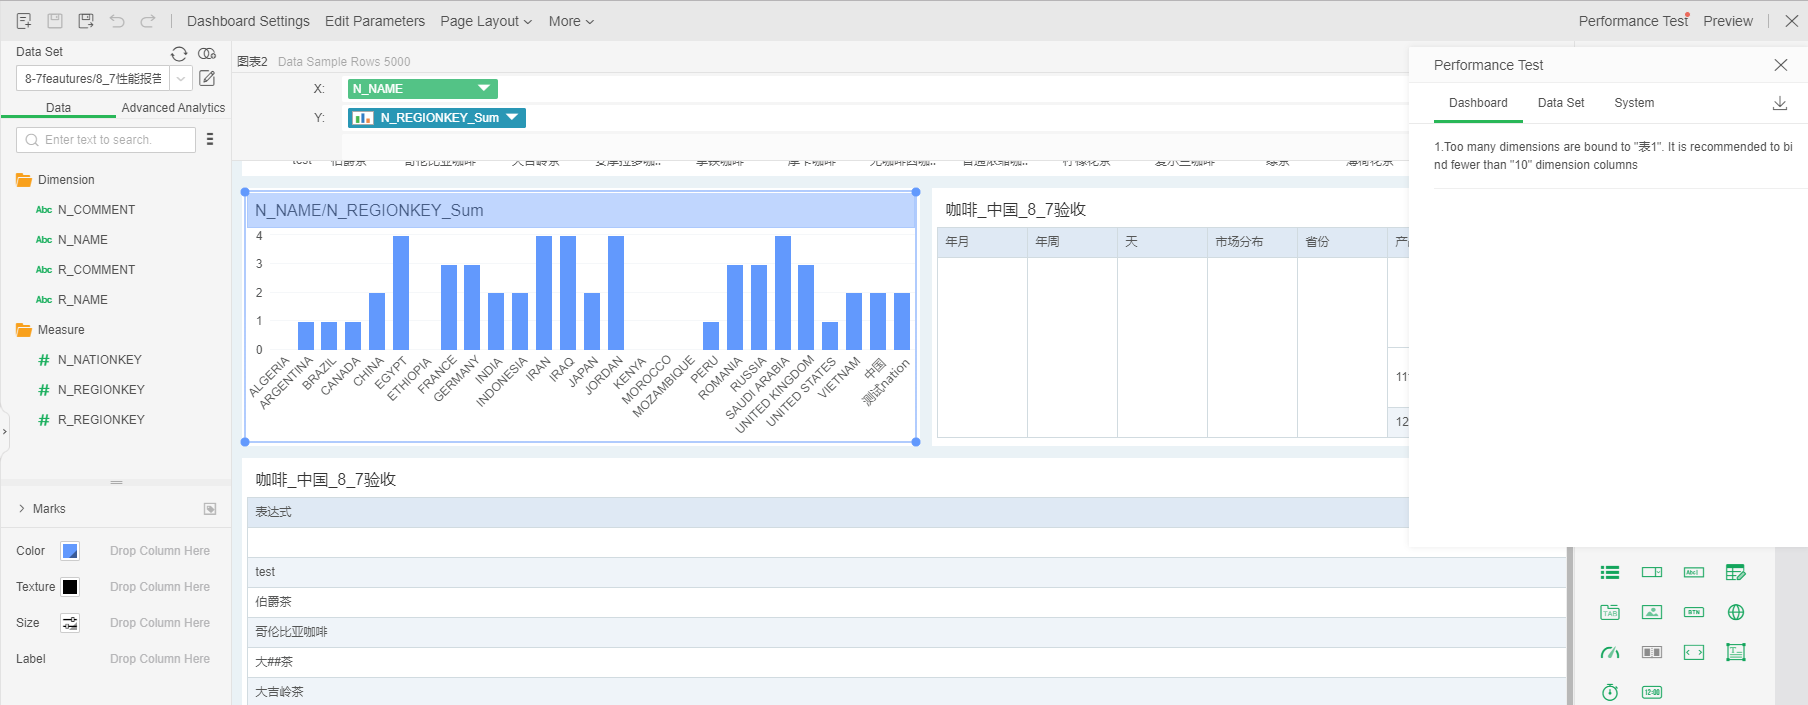
Add Performance Test to Create Dashboard Module
When creating a dashboard, if the user does something that causes slow performance, a small red dot will appear in the "Performance Test" area in the upper right corner to remind the user that this operation affects performance and should be modified according to the suggestions.
Solve the Problem of Slow Join to Data Mart
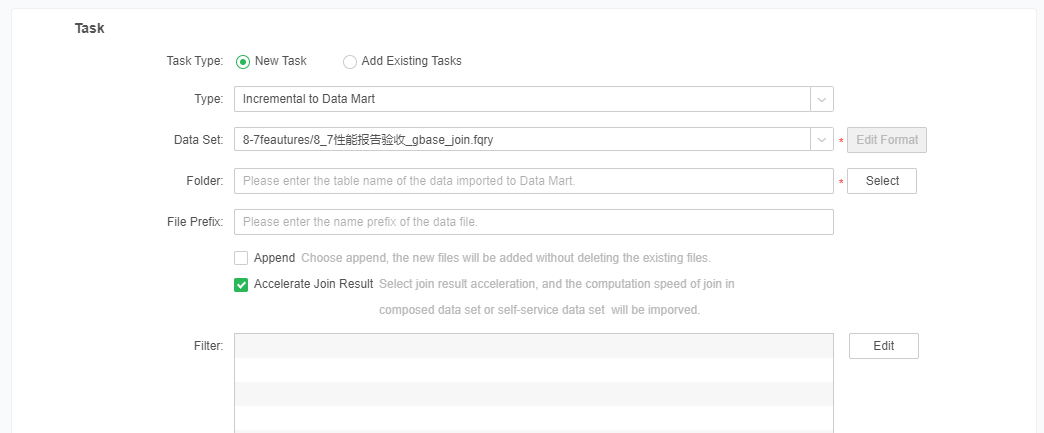
Suppose the customer has two large tables, both of which are in the tens of millions level, which need to be analyzed after joining. However, when the results of the two large tables are transmitted back to Client node for joining, the Client node does not have any feedback for a long time due to the pressure surge. The new version optimizes this scenario.
Since the individual Client node cannot guarantee to complete the task, the Join calculation is shaded to the Map node and then Joined.
Users can tick "Accelerate Join Result" to realize the function.
Optimize the Logic of max_load_row when Sorting Results
When there is an in-group sorting based on summary values, the advanced sorting defined on the last dimension can be executed in the database and data mart, that means sorting first, and then loading maximum number of rows.
Expression Placing Use Compressed Storage To Save Storage Space
When new expressions are created in the data mart, the placing of expressions uses compressed storage to save space.
7. App
Optimize Full Screen Interactive Operation
Add a full-screen zoom icon in the upper right corner of chart, table, form parameter and gauge in the dashboard.
Click text parameter component to display it in full screen
Support zooming when the table is in full screen
When the tables, pivots, freestyle tables and form parameters are in full screen, you can zoom in and out them with two fingers.
❖New Features List
1. Self-Service Data Preparation
No. |
New Features |
Version |
1 |
New Basic Connection Property to Support User-defined Connection Property |
V8.7 |
2 |
V8.7 |
|
3 |
Support Selecting Data Set or Dashboard and Viewing Its Resource Dependency |
V8.7 |
4 |
V8.7 |
|
5 |
Added Delete Prompt to Avoid Accidentally Deleting Connection and Data Set |
V8.7 |
6 |
Automatically Return Database Version Number and Allow User to Customize the Version Number |
V8.7 |
7 |
V8.7 |
|
8 |
V8.7 |
|
9 |
V8.7 |
|
10 |
Optimize Prompt When Importing Too Many Dataset Columns into Data Mart to Improve Usability |
V8.7 |
11 |
V8.7 |
2.Dashboard
No. |
New Features |
Version |
1 |
V8.7 |
|
2 |
V8.7 |
|
3 |
V8.7 |
|
4 |
V8.7 |
|
5 |
Add Date Parameter App to Quickly Filter the Range Based on A Certain Time |
V8.7 |
6 |
V8.7 |
|
7 |
Add Bookmark Function to Freely Save User's Filtering Condition |
V8.7 |
8 |
Filter and Parameter Components Support Fuzzy Search to Optimize Search Experience |
V8.7 |
9 |
Add Return Configuration to View Dashboard to Meet Platform Integration Scenario |
V8.7 |
10 |
Map and Dot Map Support Custom Shapes to Meet More Personalized Needs |
V8.7 |
11 |
Optimize Overall Interface Interaction to Improve User Experience |
V8.7 |
3. Advanced Analytics
No. |
New Features |
Version |
1 |
V8.7 |
|
2 |
V8.7 |
|
3 |
Optimize the Logic of Exporting Advanced Analysis Experiment to Database |
V8.7 |
4. Workflow
No. |
New Features |
Version |
1 |
V8.7 |
|
2 |
V8.7 |
|
3 |
Add "Delete Connection" to Delete the Workflow Database Table |
V8.7 |
4 |
Add Data Saving Function to Temporarily Save Data not Submitted for Approval |
V8.7 |
5. Enterprise Management
No. |
New Features |
Version |
1 |
Audit Adds New Indicators: End Time and Running Duration of SQL Statement Execution |
V8.7 |
2 |
V8.7 |
|
3 |
Add Memory Alert to Timely Remind Administrator of Small Remaining Memory |
V8.7 |
4 |
Support Connecting Desktop to Server and Uploading Dashboard |
V8.7 |
6. Big Data
No. |
New Features |
Version |
1 |
V8.7 |
|
2 |
V8.7 |
|
3 |
V8.7 |
|
4 |
V8.7 |
|
5 |
Expression Placing Use Compressed Storage To Save Storage Space |
V8.7 |
7. App
No. |
New Features |
Version |
1 |
V8.7 |