|
<< Click to Display Table of Contents >> Yonghong Z-Suite V8.6 |
  
|
|
<< Click to Display Table of Contents >> Yonghong Z-Suite V8.6 |
  
|
❖New Key Features
1. Self-Service Data Preparation
Support Huawei Series Databases
In data connection, Yonghong has realized IAAS resource connection with MRS and DWS of HuaWei Cloud. In combination of HuaWei Cloud's big data capability, Yonghong BI can provide customers with integrated big data analysis solutions. In the data visualization solutions of Yonghong, BI, cloud hosting and MRS/DWS are packed into packages of different grades according to data size and user size. While the HuaWei Cloud provides customers with MLS services like data batch access, stream processing and large capacity data storage and analysis, Yonghong BI offers visual presentation of data stored in the HuaWei Cloud and releases data value.
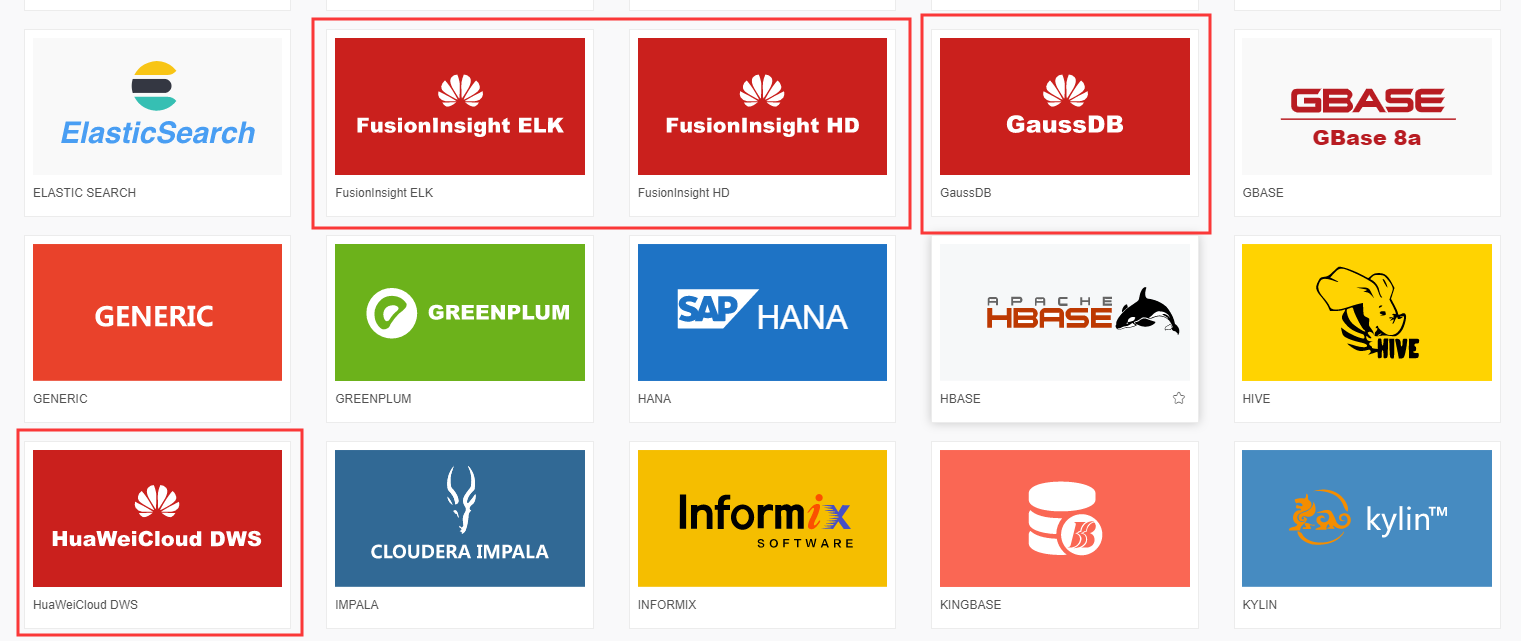
Furthermore, Yonghong provides excellent support to FusionInsight HD, FusionInsight ELK and GaussDB.
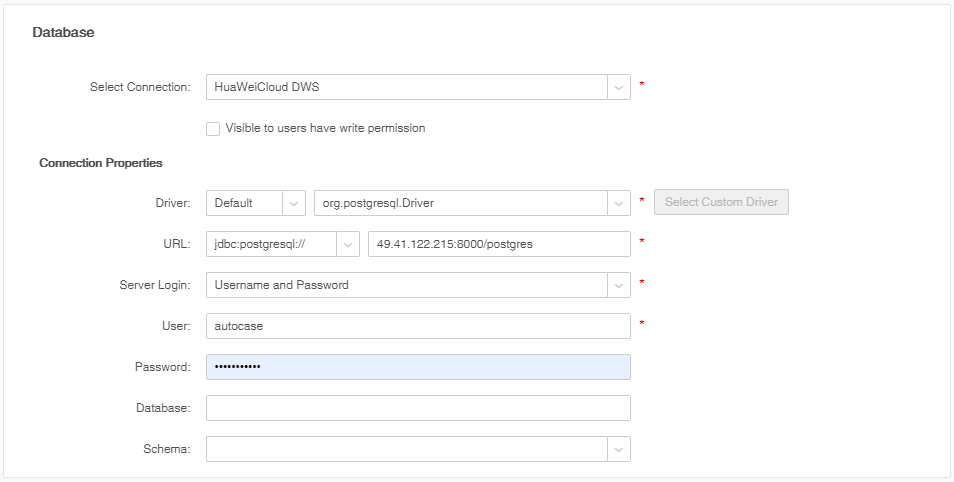
Connection support to HuaWei Cloud DWS is as shown below:
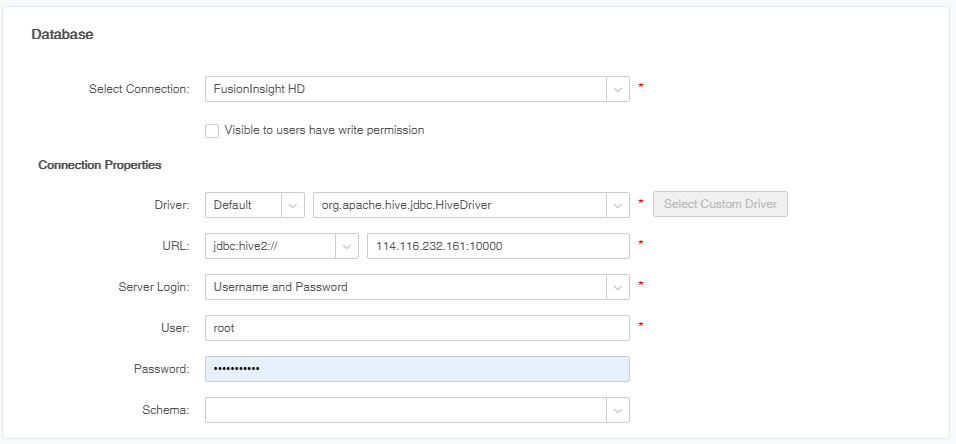
Connection to FusionInsight HD or HuaWei Cloud MRS is as shown below:
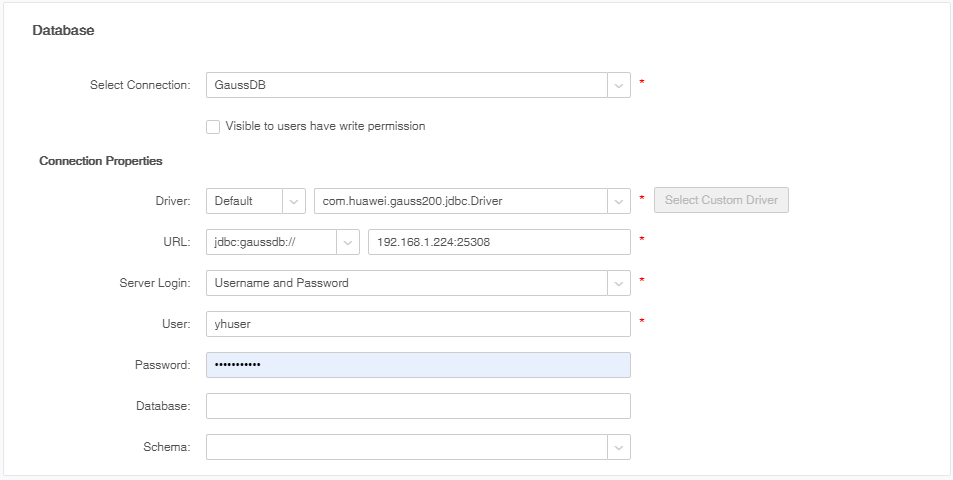
Connection to Huawei GaussDB 200 is as shown below:
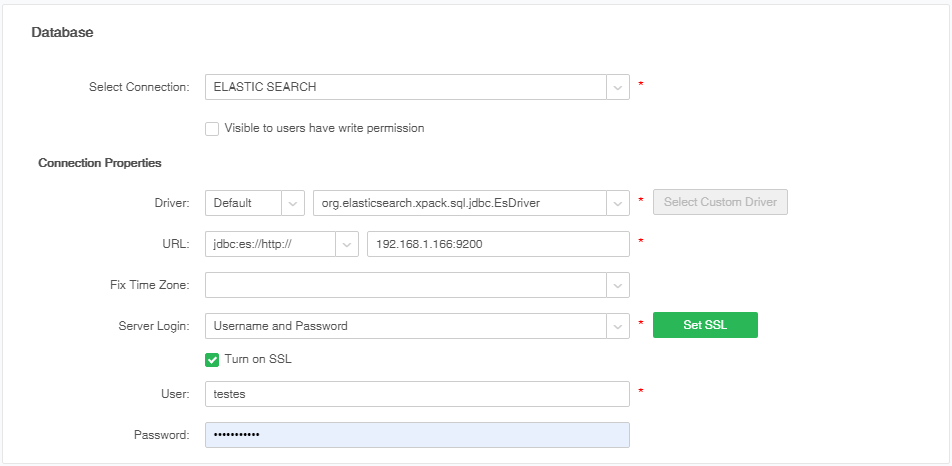
Elasticsearch is a full-text search engine offering all advantages you can possible think of, such as correlation score, stemming and synonym. Thanks to its distributed document storage (horizontal scalability), it can process billions of rows of data, and miss no single monitoring signal. With Elasticsearch SQL, you can use familiar query syntax for full-text search, and realize easy scalability at a lightning speed.
As Elasticsearch has officially supported SQL functional module and has been compatible with JDBC and ODBC syntax since V6.3, Yonghong products have supported connection to Elasticsearch datasource via JDBC in V8.6. Now Yonghong supports ad-hoc SQL query of most scenarios, but doesn’t support syntax that Elasticsearch SQL doesn’t support.
Support AliCloud MaxCompute (Formerly ODPS)
MaxCompute, formerly ODPS, is a fast and fully managed TB/PB data warehouse solution. For early versions of Yonghong, users connect to MaxCompute via GENERIC data source. For V8.6, however, a specialized MaxComput connection has been designed, and is optimized from several aspects to enhance usability, for example executing SQL scripts in database, and importing date into data mart.
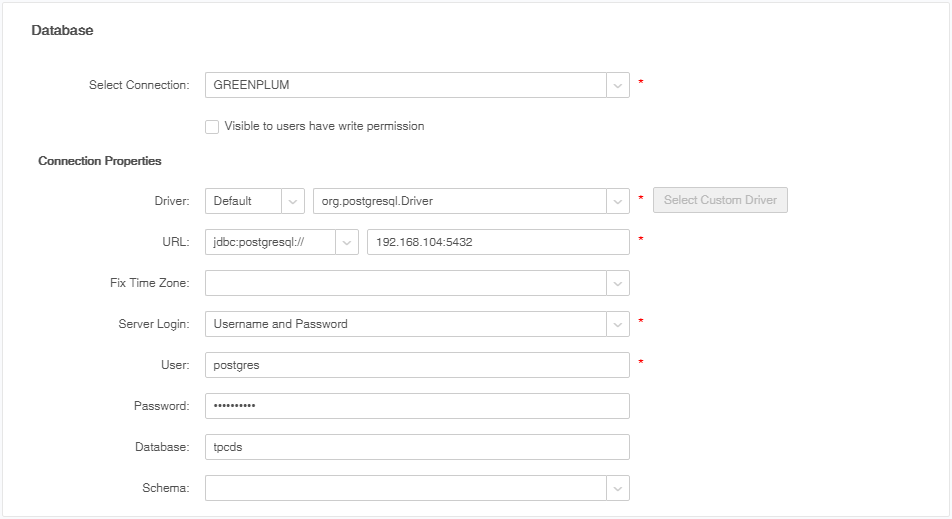
Based on the MPP (Massive Parallel Processing) architecture, the Greenplum big data platform offers good elasticity and linear scalability. Embedded with parallel storage, parallel communication and parallel computation and optimization technology, it’s compatible with SQL standard, offering powerful, efficient and safe PB structured, semi-structured and non-structured data storage, processing and real-time analysis ability.
Yonghong supports connection to Greenplum via JDBC. After connection, users can directly make queries by dragging-and-dropping or writing SQL in the SQL dataset.
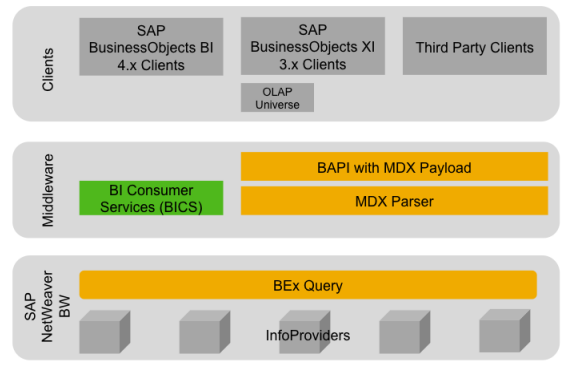
Multidimensional Dataset: SAP BW Connection Supports JCO
During the POC process for a certain client, we have noticed that JCO API offers a better and faster performance solution when extracting large data with SAP BW. While Yonghong before V8.6 has supported connection to SAP BW with XMLA, V8.6 now supports connection to SAP BW with JCO.
•Configuration Environment
Notes: Please download the following SAP files mentioned from the official website of SAP. It should be noted that users must have a SAP account, possibly a SAP paid account to use this download link. Generally, purchasers of SAP related services are entitled to download the files.
windows |
1.sapjco3.dll under the path C:\Windows\System32 |
|
2. sapjco3.jar under the path Yonghong\lib |
||
linux |
1.sapjco3.jar under the path Yonghong\lib |
|
2. libsapjco3.so |
JDK9 and above under the path %JAVA_HOME%\jre\bin |
|
JDK9 and below under the path %JAVA_HOME%\jre\bin |
||
3. libsapjco3.so under the path usr\lib64 |
||
•SAP JCO Connection Example
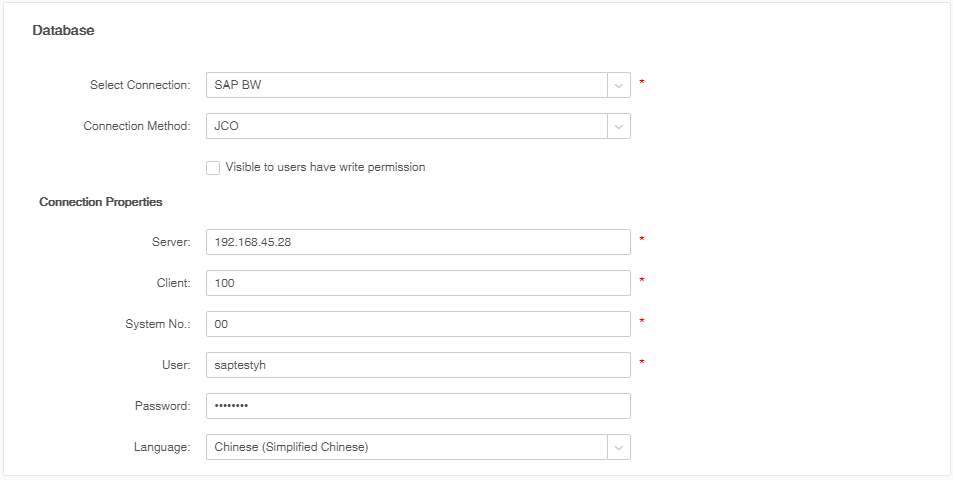
After obtaining SAP JCO connection via multidimensional dataset, users can directly obtain SAP BW BExQuery visually. BExQuery will be directly mapped as cubes in Yonghong’s multidimensional dataset and displayed in the form of visual list. Users can simply choose the corresponding cube for analysis.
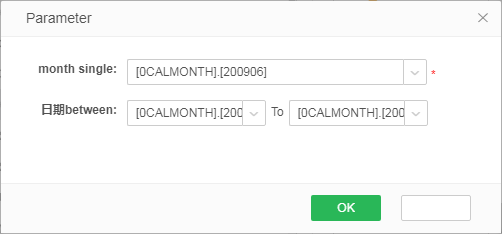
Furthermore, Yonghong can obtain BExQuery variables while obtaining SAP BW BExQuery via SAP JCO connection. When refreshing metadata, the variables will pop up directly in the form of parameters. Users can see the default value and the optional values of parameters, and can directly select the value in a visual manner.
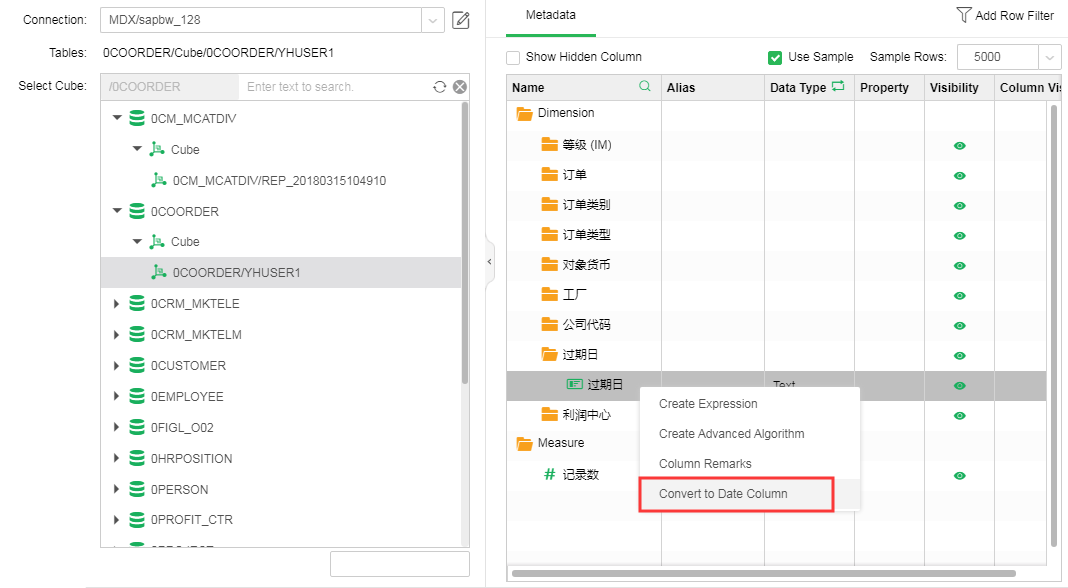
Multidimensional Dataset: Support Conversion of Text Columns to Date Columns
The text columns in the multidimensional dataset can be converted into data columns via data keyword. After conversion, data expression can be created.
Support SQL Parser Setting in SQL Dataset
In our previous versions, users can only control the switch of SQL Parser uniformly in global scope in System Settings > System Parameter Setting > Basic Parameter Setting via the parameter, which is sql.parse.
Yonghong V8.6 supports SQL parser setting in single SQL dataset. DBA or IT personnel will no longer have to worry about the switch of SQL parser of a certain SQL dataset.

Paging Query to Enhancing Query Performance
The support for paging query of detailed data of dashboard has covered the SQL Server (supported by Version 8.5), MySQL(supported by Version 8.5), DB2 (supported by Version 8.5) and Oracle (supported by Version 8.0.1) databases. V8.6 has been further designed with support to GBase and Kylin databases. Instead of all data query, data batch query is realized, reducing the server resource occupancy and enhancing data access performance.
Support User-defined Remark for Each Field
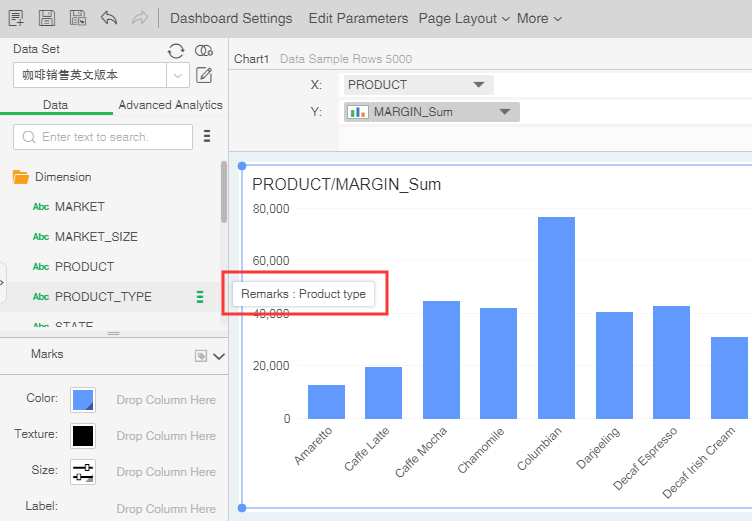
IT personnel can add remarks to each column of the dataset, and the business personnel can directly view the remarks of the column during self-service analysis. It’s convenient and easy to use.
Column Remarks Example:
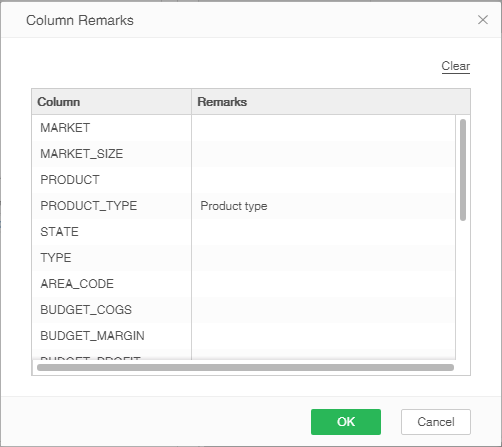
During making dashboard, the user can move the mouse to this field to view the remark clearly.
Support Reading or Writing SQL Scripts in Full Screen
The full screen feature can facilitate IT users in SQL scripts writing.

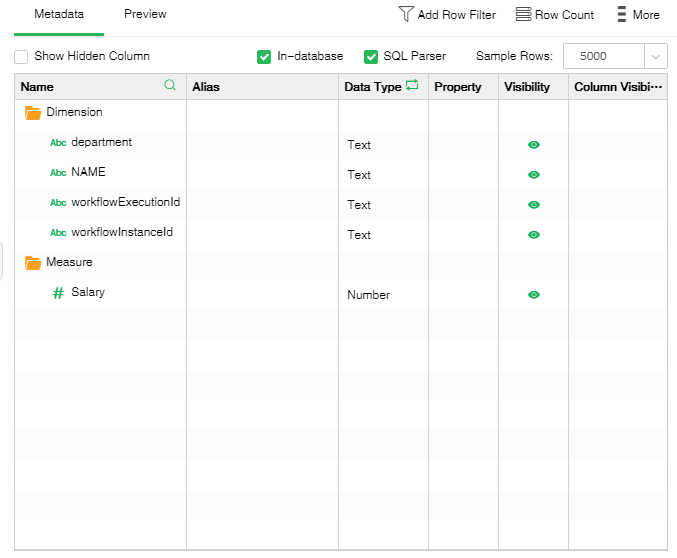
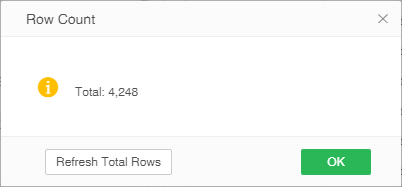
Optimize the Positions of Some Functions in Metadata Area
The position of the following features have been optimized: Filter, Display Total Rows, Export to Database, Refresh Data.
2. Dashboard
Add Operational Guidance to A Fast Understanding of Features
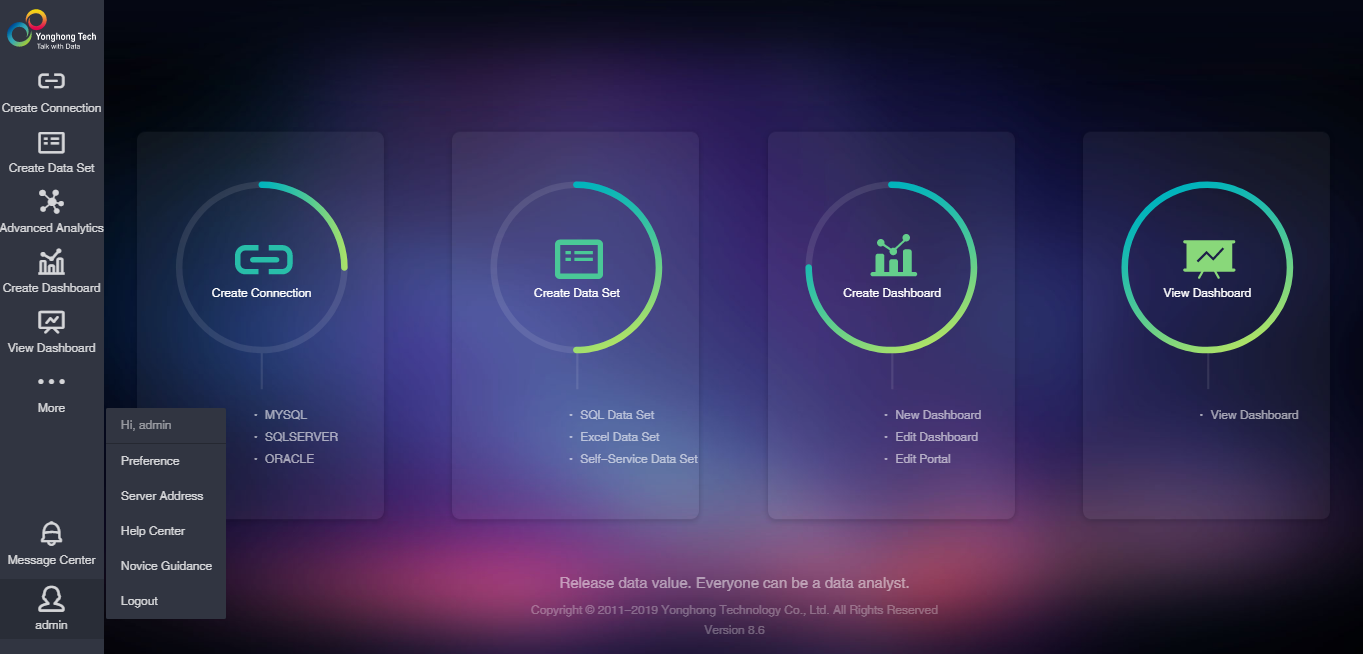
V8.6 has been added with basic operational guidance throughout the whole process of Create Connection-Create Dataset-Making Dashboard-View Dashboard. New users can gain a fast understanding of important functions.
Users who have closed the operational guidance can re-enter into the guidance page via User Menu> Operational Guidance, as shown below.
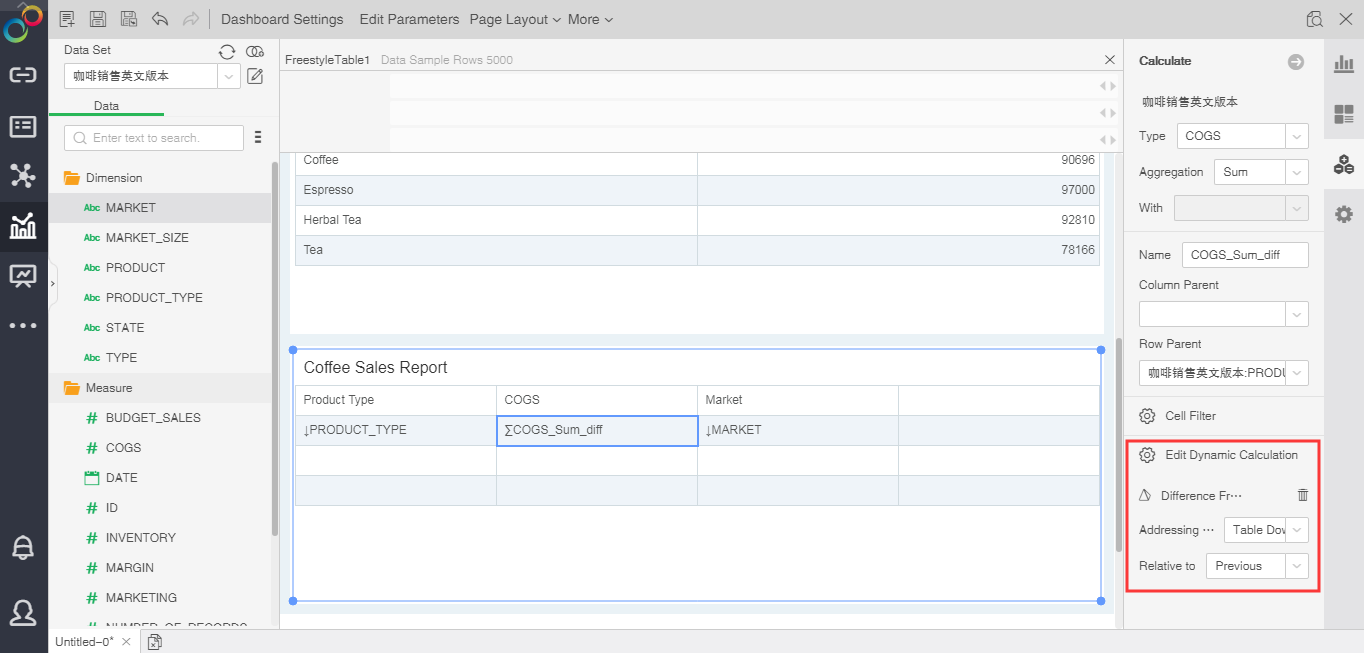
Support Dynamic Calculation of Free Table and Optimize Use Experience
•Add dynamic calculation in free table to meet more complicated scenario requirements
As shown in the figure, the costs of selling in 2015 and in 2016 are calculated and ranked, and sorting changes are finally obtained by inter-cell calculation.
•Optimize Free Table Experience
From V8.6, our product will support double clicking on the cells to edit, cut and past constants in the free table, generating a more convenience use experience. The user experience of the following functions has been optimized: the interaction and prompt of aggregate functions, free table selection under the edit mode, sub-menu pop-up speed, free table column name editing, automatic setting of horizontal parent cells.
•Add script functions, row, column, rsize, csize, to improve the usability of inter-cell calculations
When performing inter-cell calculations, row represents the current row number, column represents the current column number, rsize represents the total number of rows, and csize represents the total number of columns.
Note: row and column are calculated from 0, and the first cell in the upper left corner is the origin. While fo rsize or csize , if there is data, it starts from 1.
There are two ways to represents the specific cell in inter-cell calculations:
1. Reference by the name of the grid.
Example: col ('market')
2. Reference by the coordinate values of row and column.
E.g:
cell (1,3) represents the cell in the second row and fourth column.
cell (row, 1) represents the cell in the second column of the current row. If the current row is expanded, the expanded data will be obtained and calculated.
cell (1, column) represents the cell in the second row of the current column.
cell (row + 1, column-1) represents the cell in the left column and next row of the current cell.
cell (row, csize-1) represents the last cell in the current row.
cell (rsize-1, column) represents the last cell in the current column.
cell (rsize-2, csize-2) represents the cell in the second to last row and the second to last column.
Optimize Data Filling and Submission Settings and Support the Input of Data on One Dashboard to Multiple Databases
•Support the Input of Data on One Dashboard to Multiple Databases
Support the setting of data filling to multiple databases. It means that the same field on the same dashboard can be filled to different database tables.
•Unify the Entry to Data Filling Setting and Optimize the Filling Setting
No matter what component is used for filling, users have to open the setting dialogue from Menu Bar > More > Form Parameter. The entry to form parameter setting of the component has been removed.
The submission type for each data filling can be separately set. When filling data of form components, the submission type supports intelligent submission, which can automatically do insert, update, or delete according to the user operation.
Optimize dislplay of the source fields of form parameter components. The format of source field of form parameter components is changed as Name of Form Parameter Component: Field Name.
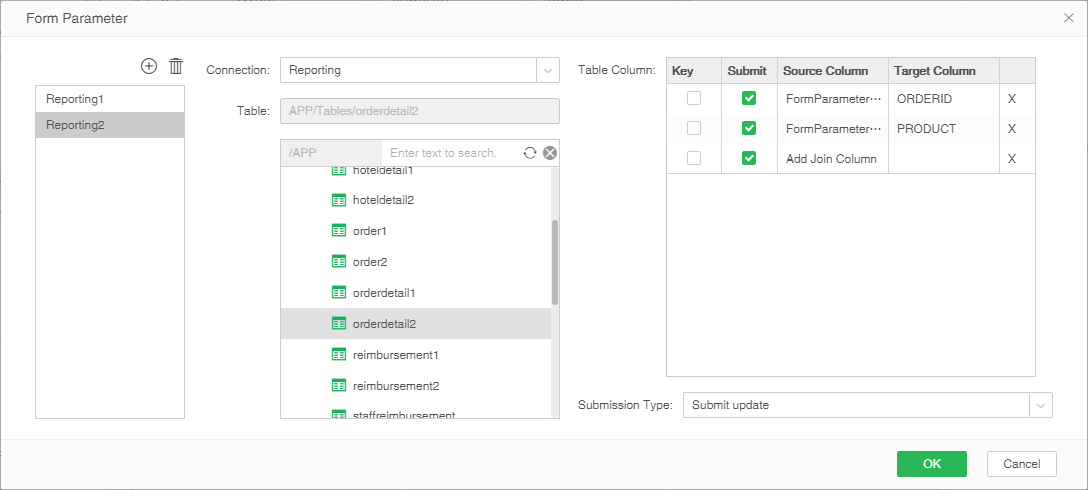
•Optimize the result wrote to the database
The data in the same form parameter will be wrote in the same row in the table.
•Add Update Modes in Advanced Setting
The setting, “Delete all current data when update via Excel”, is added in Advanced of the Right Menu Bar, and selected by default.
•Optimize Submission Setting
When selecting the submit component, users can select to submit all form parameters or part of form parameters in the dashboard.
If the submit component is not added, the submit button can be automatically added in the menu bar of View Dashboard, which will not shown if the submit component is added.
Add Select All in Filter Components and Enhance the Usability of Filter Operation
The Select All option has been added to the list filter, tree filter and list parameter in V8.6, optimizing user experience.
Support User-defined Sorting on the Left Sidebar and Auto Concealing of Unauthorized Dashboards
The left sidebar of V8.6 has been further designed with manual sorting. Users can sort the items on the left sidebar by dragging. When users open the portal page, the unauthorized dashboards will be automatically concealed.
Support Self-Defined Filter Columns Based on Measure Columns
Users may need to filter the data of the measure column to obtain a new measure column. As shown below, we can get the sales data in 2015, the sales data in 2016 and the sales data excluding the sales of tea by create the filter column based on the sales column, and then the three new self-defined columns can be displayed on the same table.
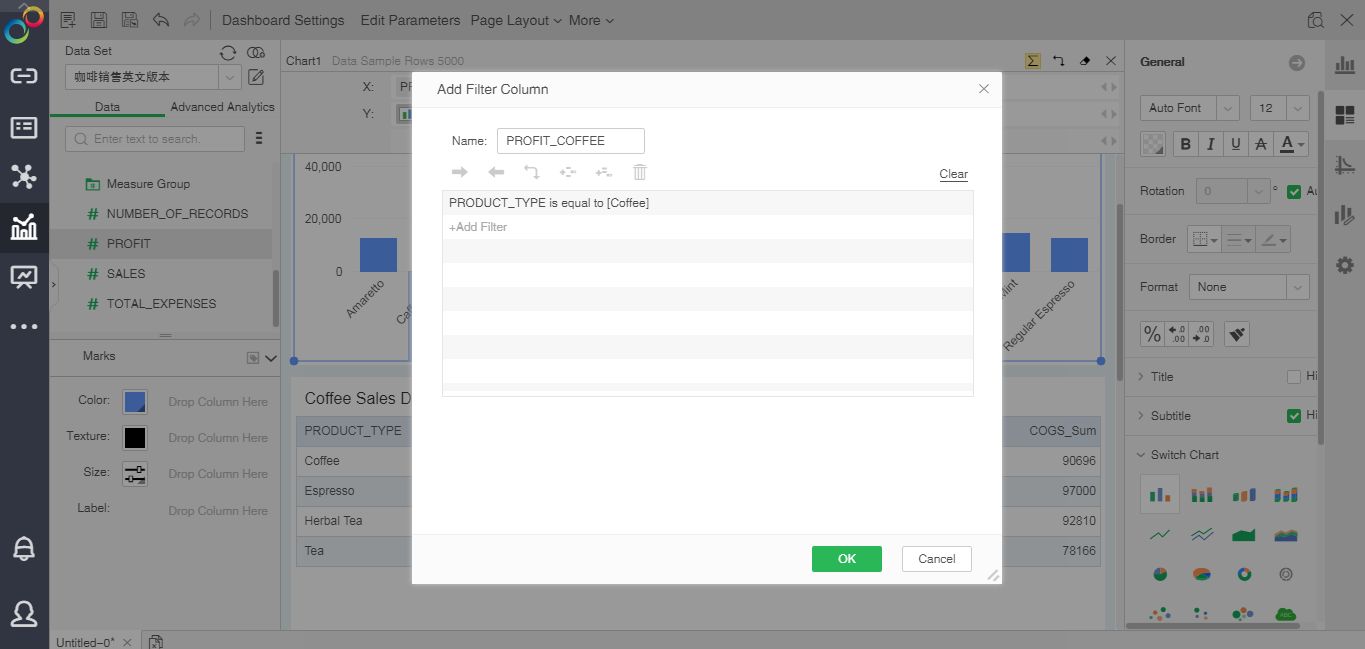
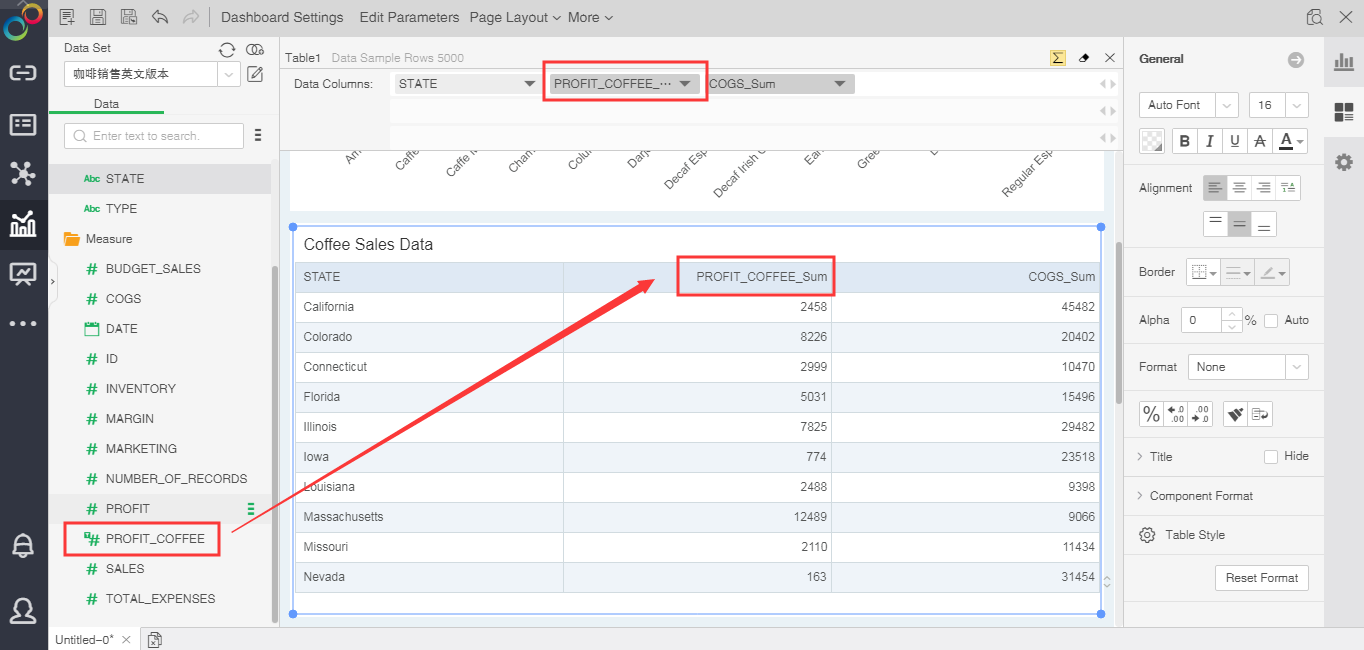
Filter Column has the following features:
•The filter columns support dynamic computation.
•Detail expression supports creating new filter columns, but LOD and aggregate expression don’t.
•Detail expression can’t make reference to filter columns. In case of reference used, an error prompt will be given in expression editing.
•Aggregate expression can make reference to filter columns.
•Detail data don’t support filter column display.
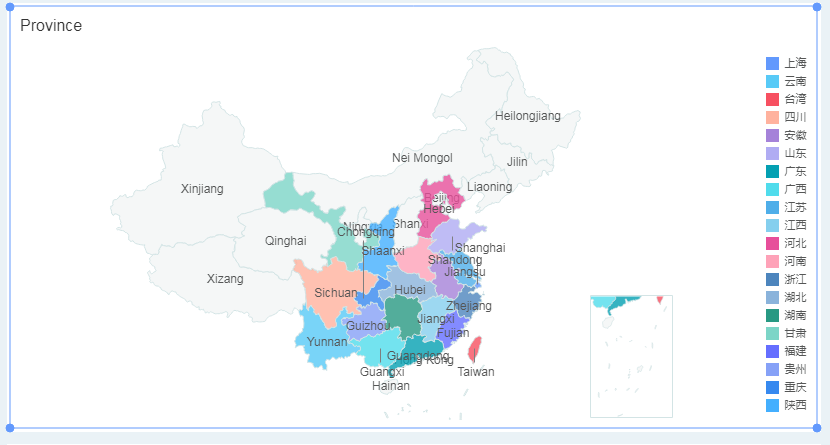
Add the Minimap of South China Sea Nine-line Dash
V8.6 supports configuration of South China Sea Nine-line Dash as minimap display to beautify the map. The minimap's position supports the flexible configuration (on the lower right corner and lower left corner). In case of component size changes, the minimap will make automatic adjustment.
Add Dynamic Effect for Table Components, Text Components and KPI Card Components to Meet More Big Screen Requirements
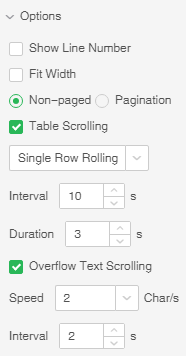
•Table components support single-line scrolling and text overflow scrolling effect
Scrolling settings have been added to the table components in V8.6, including single-line scrolling and text overflow scrolling (notes: scrolling not supported under the paging mode). Users may set the scrolling time and speed to adjust the scrolling effect, as shown below:

•Text components support marquee effect
Scrolling settings have been added to the text components. Users may adjust the scrolling speed, end interval and time on site as needed, as shown below:

•KPI card components support flip effect
The KPI card has been added with flip effect. After enabling this feature, the dynamic flip effect of number will be display when loading components or number changes.
Support Configuration of First Day of Week
The parameter, monday.first.day.of.week, is added. If monday.first.day.of.week=false, the first day of week of the date component will be Sunday. If it’s set as true, the first day of week will be Monday.
Add Dynamic and Static Frame Materials to Facilitate Making Elaborate Dashboards
V8.6 has been added with 10 sets of elaborate frame materials which are put under the Frame folder by default. Among them are several sets of dynamic effect frames which can enrich the dashboard styles.
Enhance the Usability of Mobile Phone Layout Settings
•Add alignment mode setting in Components Combination
When more than one components are selected, the alignment modes are displayed on the right menu bar, including top alignment, bottom alignment, left alignment and right alignment.
•Add height setting in Components Combination
After the component is selected, the component height are displayed on the right menu bar, and are modifiable.
•Add component height modification by dragging the component frame with the mouse
Users may directly drag the frame with the mouse to modify the height.
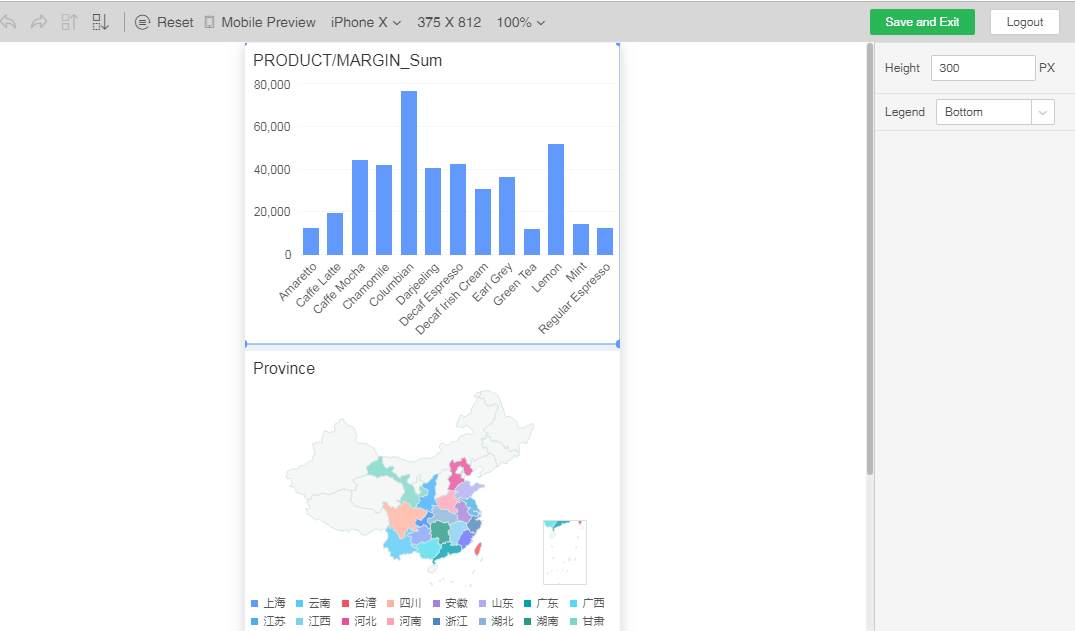
•Add the selection of mobile phone size and scale ratio
The mobile phone size and scale ratio can be switched on the PC to preview the display effect on the mobile phone.
3. Advanced Analytics
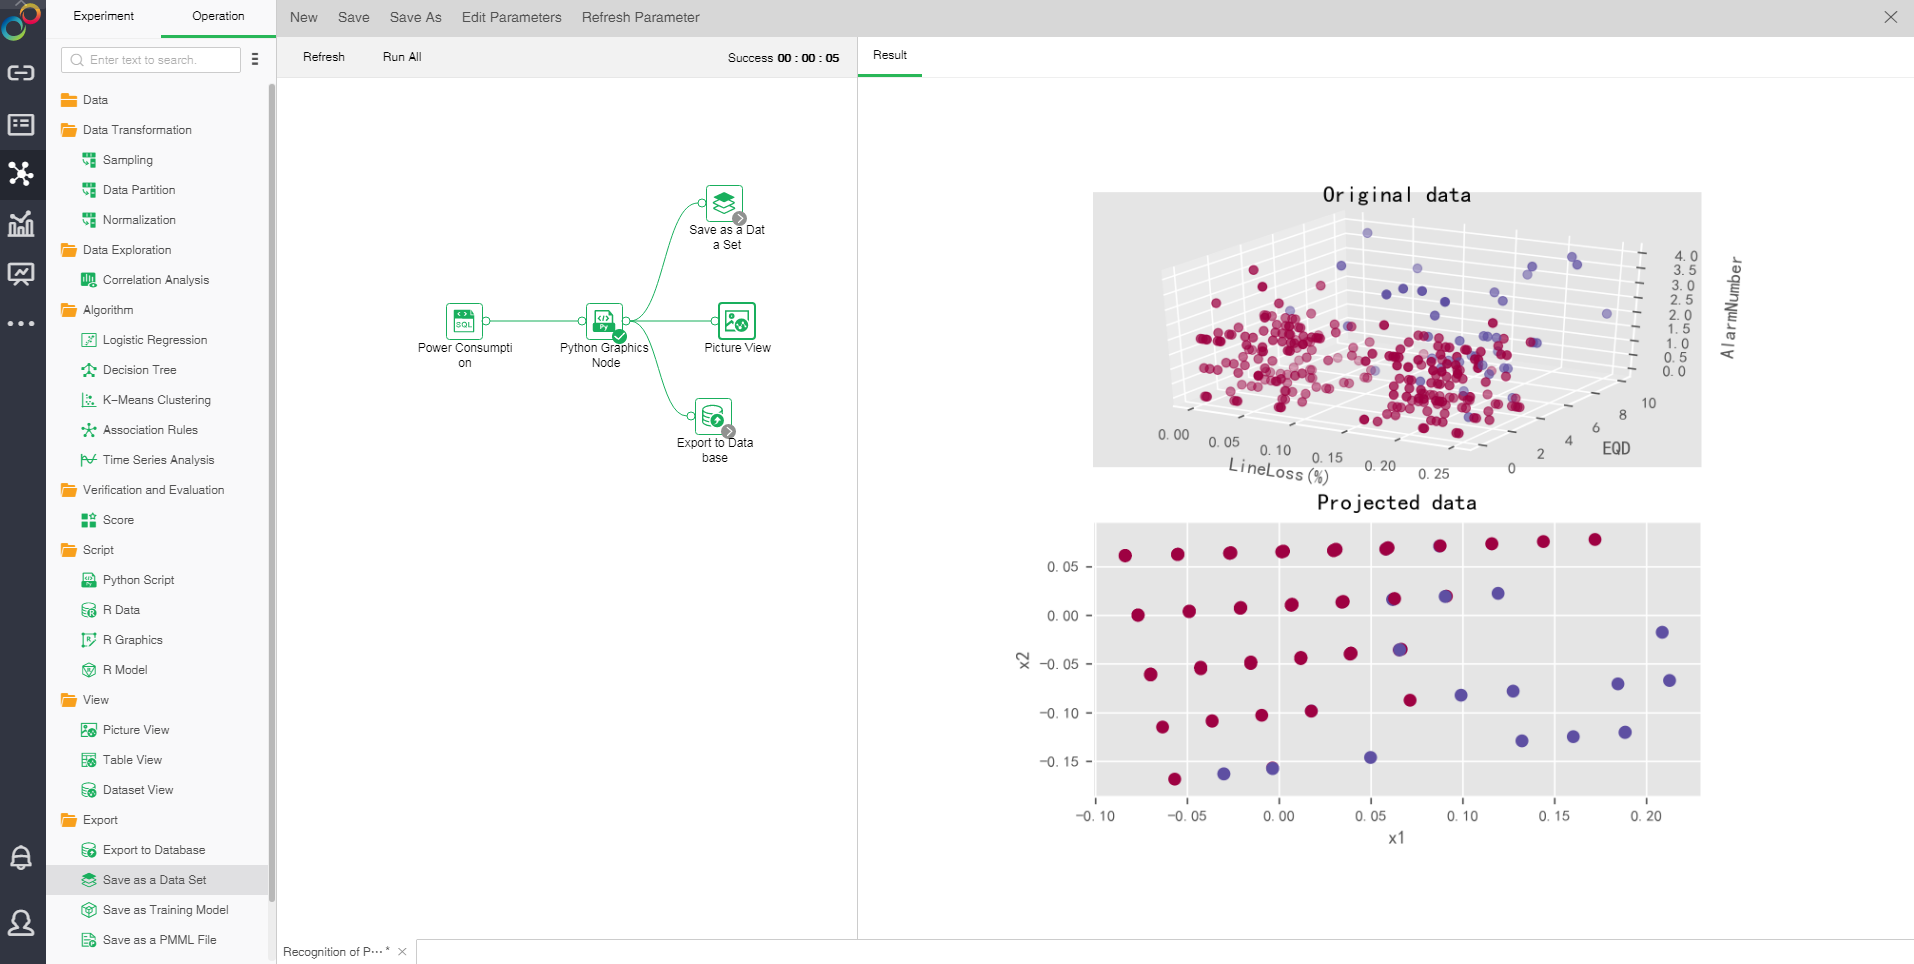
This version prepares for algorithm plug-ins in future versions by re-dividing the contents under “Operation”, optimizing algorithm nodes, increasing view nodes and export nodes, and optimizing inter-node connection rules, which are specified as follows:
Data: Maintain consistency with the original functions, serve as data resource;
Conversion: Maintain consistency with the original functions, conduct data processing;
Exploration: Maintain consistency with the original functions, provide related analysis;
Algorithm: Change the original “Modeling” to “Algorithm”, support the same number of algorithms, and transfer the R Model to the Script Folder;
Verification and Evaluation: Add an independent folder with built-in “Grading” Node;
Script: Add an independent folder with built-in “Python Script”, “R Script”, “R Chart”, and “R Model”;
View: Add an independent folder with built-in “Image View”, “Table View” and “Dataset View”;
Export: Add an independent folder with built-in “Export to Database”, “Save as Dataset”, “Save as Training Model”, “Save as PMML File”, “Save as EXCEL” and “Save as CSV”.
The original three nodes, “Python Model”, “Python Data” and “Python Chart”, have been integrated into one node “Python Script” which offer the same functions. This Version will not process the R nodes, but the future version will have plug-ins to realize more optimal R algorithm nodes.
Three kinds of result display nodes have been separated out—“Image View”, “Table View” and “Dataset View”. Users may define the display effect as needed, and the display mode of the algorithm will not be fixed anymore to better suit future plug-in display.
Six kinds of export nodes have been separated out—“Export to Database”, “Save as Dataset”, “Save as Training Model”, “Save as PMML File”, “Save as EXCEL” and “Save as CSV, for the purpose of more convenient and flexible model and data output.
When connecting nodes, the new version system can intelligently judge whether the nodes can be connected.
In early versions, one node (non-data node) can connect to only one output node. The new version has optimized to support one node to be connected with multiple output nodes, increasing the use flexibility of the model.
4. Workflow
Configure Workflow Database via Manage System
In V8.5.1, the workflow database needs to be configured in bi.properties. In V8.6, however, it can be configured in Manage System page.
Select a connection in the Manage System>System Settings>Database Configuration to deploy the workflow system in the database.
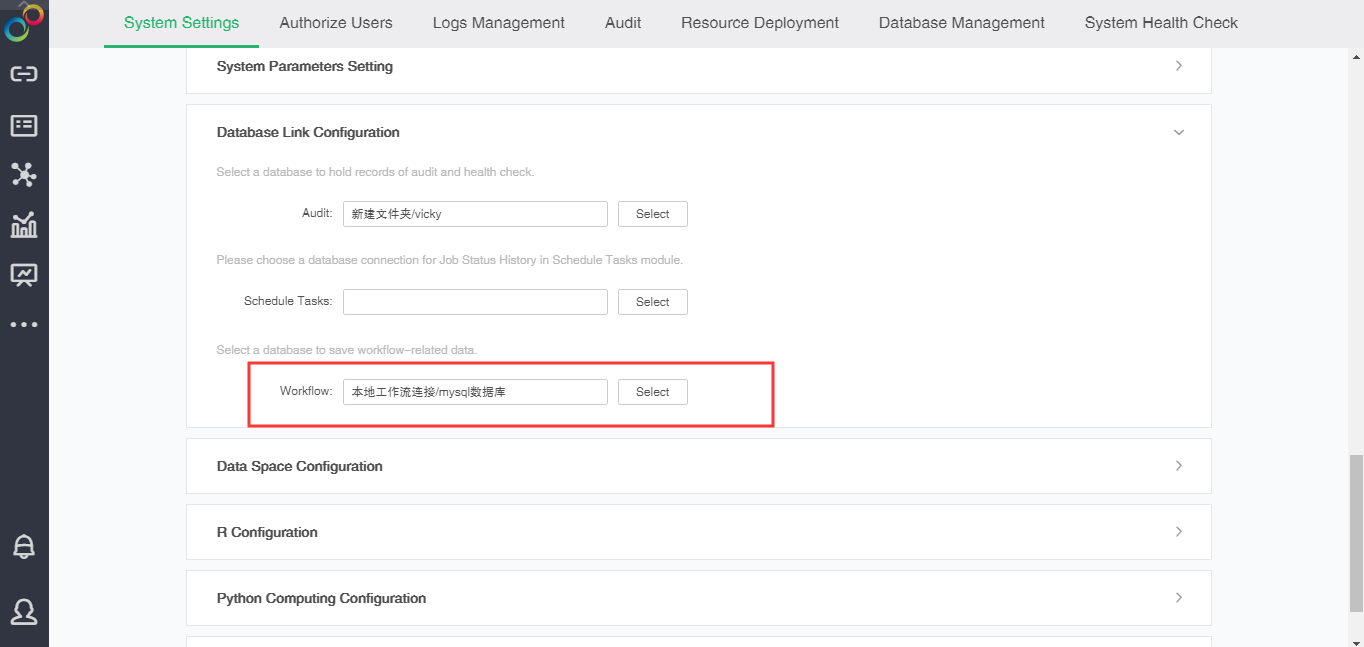
Users need to wait for the deployment of tables. After deployment, the system will have deployment completion prompt, and then the workflow system can be entered directly from the left sidebar.
Enhance the Usability of Process Creation and Make it More Friendly to Process Developers
In V8.6, the usability of workflow has been optimized in the hope of more user-friendly process creation. The usability of process creation is mainly enhanced from the following aspects:
•Optimize the settings of process attributes
The settings of process attributes are more friendly. In the previous versions, users have to click the white space of the page to enter the settings of process attributes. In consideration of such obscure settings, we have optimized the attributes panel in V8.6 to divide it into the process attributes setting panel and node attributes setting panel. Users can set the process attributes by switching to the process panel.
•Optimize the prompt of forgetting to add the approver in a certain approval node
In the new version, the prompt of forgetting to add the approver has been optimized. If the process developer forgets to add the approver in a certain approval node, the system will pop up the prompt of approver not set and disallow the release of the process when the process developer tries to release it.
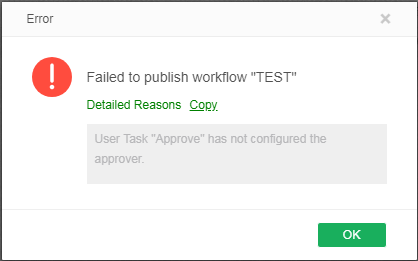
•Optimize the usability of approver settings
In the previous version, the process developer has to select the approver in the pop-up window and the settings panel will not display the approver selected. When there are many process nodes, it will be difficult for the process developer to remember which nodes have been set with approvers and which don’t. In V8.6, therefore, the settings panel will display the approver selected, guaranteeing more user-friendly process settings.
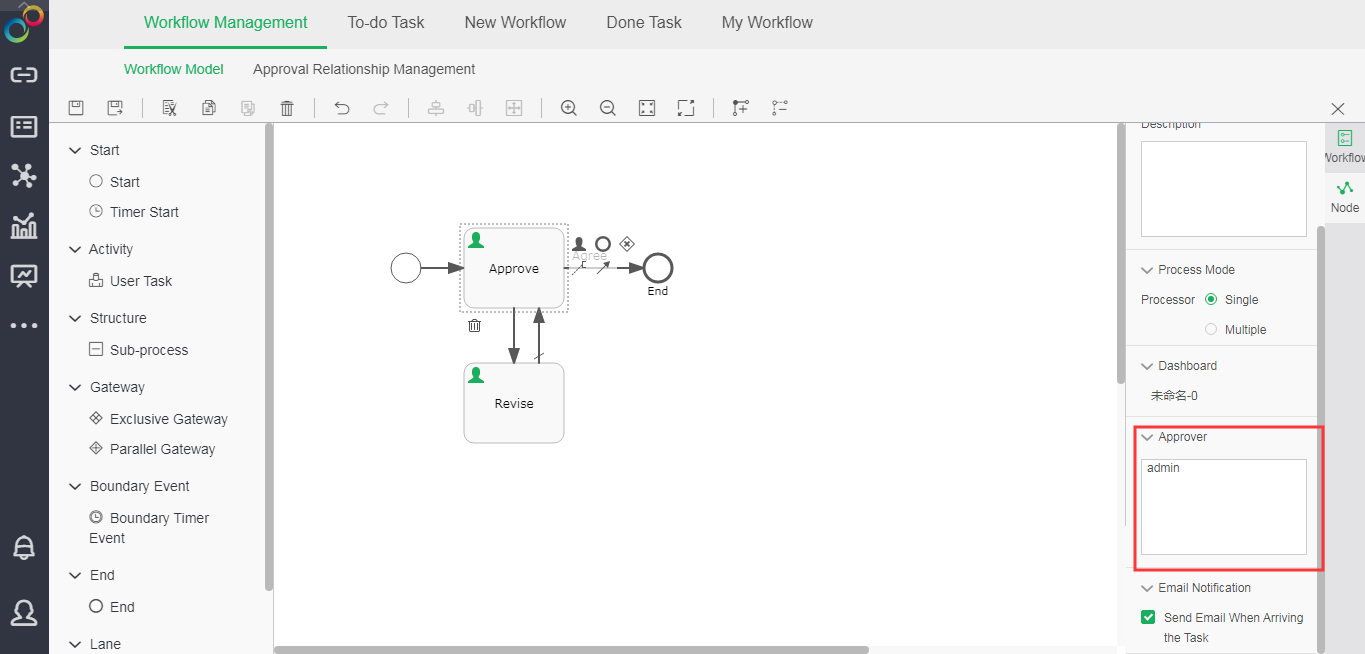
•Optimize the usability of form settings
To prevent the process developer from forgetting which nodes have been added with forms and which don’t, the selected forms are directly displayed in the settings panel in V8.6 to facilitate the adding or replacement of forms by the process developer.
Enhance the Usability of Process Application and Make it More Friendly to Approvers
V8.6 has not only enhanced the usability of process creation, but also optimized the process application in the hope of improving user experience.
•Optimize the number of processes displayed on the page
The screen space has been fully used to display more processes on each page.
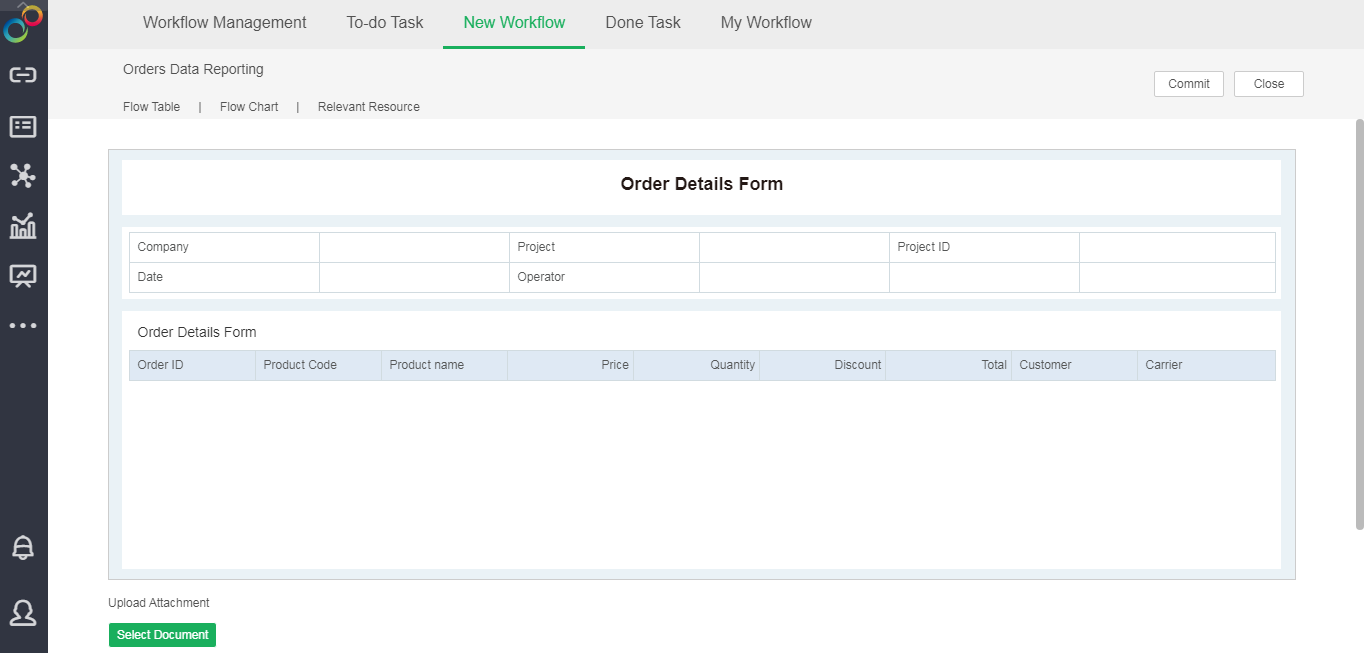
•Optimize the height of form zone
The height of form zone will change with the height of forms. Users can directly see the complete form by the scroll bar of the browser.
5. Enterprise Management
Scheduled Email Task Supports Direct Use of Images Instead of Attachments
If the selected type of attachment is “No Attachment”, the dashboard will not be added to the attachment to the email when sending an email as a scheduled task.

Support More Flexible Watermarks
Add “Username + Nickname” option to display the user name and nickname in the watermark.
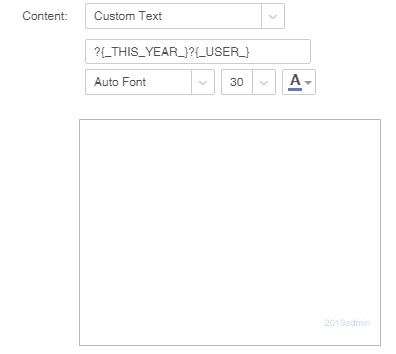
Furthermore, built-in parameters are supported in the Watermarkt>Custom Text. For instance, enter ?{_THIS_YEAR_}?{_USER_} in the User-defined Text and the watermark content will be displayed as 2019 username.
New Parameter to Control Whether to Mandatorily Change Weak Passwords
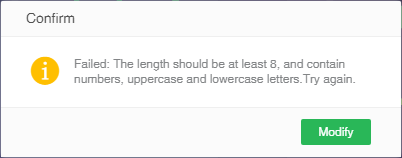
Through prompt.weak.pwd=true/false, the administrator may control whether to have the users change weak passwords mandatorily. When the parameter value is true and the user password is not complying with the regulations (the length should not be less than 8 characters and simultaneously including upper-case and lower-case letters and digits), a prompt of changing the password will be given during login and entry into the system will be disabled before changing the password.
Optimize the Permission Logic of Folders in Scheduled Tasks
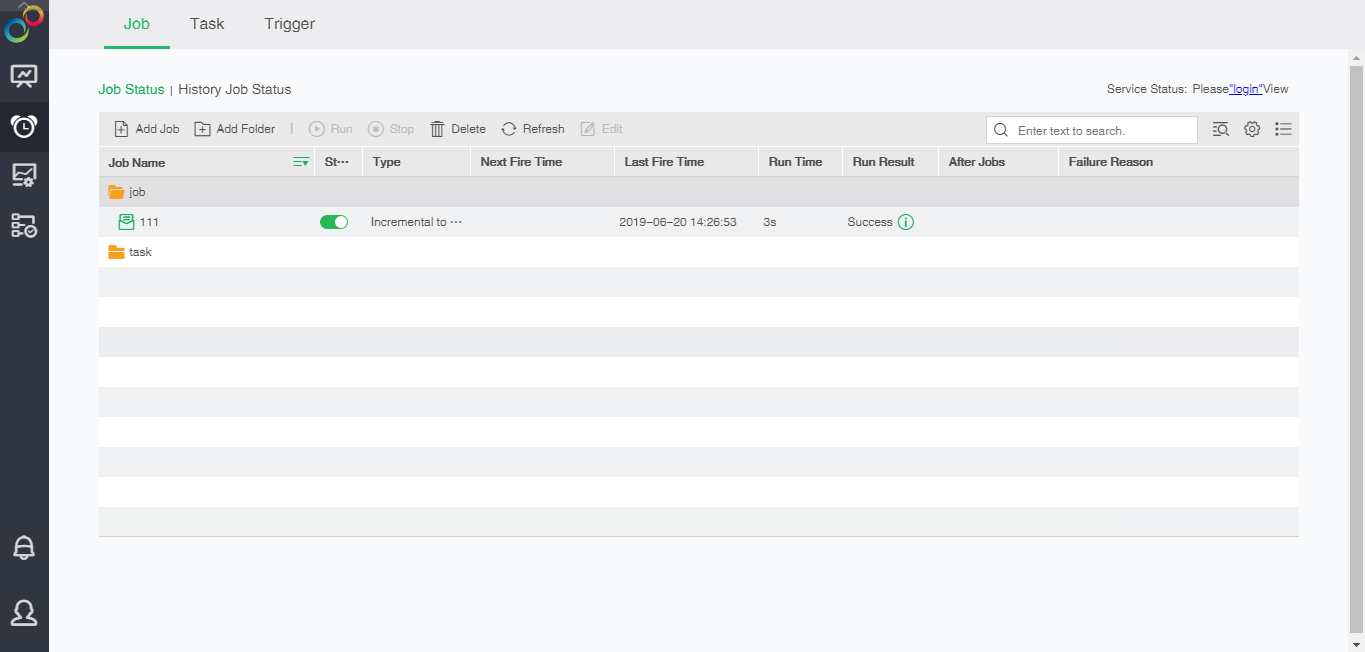
The new version has restricted the permissions of job, task and trigger folders. Only when the user has the permissions to a certain job can he see the folder path. Users may also see empty folders with no job, task and trigger, but can’t view or operate other irrelevant folders.
Automatic Front Placement of Selected Items on Authorization Editing
The users, groups or roles, who have the read or write permission for the resource, will be automatically placed in front on the authorization editing page to facilitate the authorization.

Support User Data Paging to Enhance Performance
User data paging loading is supported, which enhances performance when there is a large number of users.
Support Viewing Dashboards and Receiving Messages in Feishu
The Feishu plug-in is added, and users may connect with Feishu after installation. The plug-in is composed of Feishu app configuration, push notification configuration page and Yonghong small program. Users can upload the program to the back-end of Feishu and set the related configurations in the system. Thus users can view dashboards and receive messages in Feishu app.

Yonghong desktop is released. The Desktop has been added with Excel Auto-Sync. If the path of local Excel files has not been changed, the data in the Excel (Row Addition or Deletion) will be automatically synchronized to the Excel dataset.
6. BIG DATA
Add Caching Mechanism for Detail Data Query In Data Mart
In the previous versions, detail data query in data mart doesn’t support caching. When multiple identical requests are initiated at the same time, there is plenty of repeated computation, increasing the system pressure. Therefore, caching mechanism has been added in V8.6 for detail data query in data mart. When multiple users are refreshing the dashboards at a high frequency and using detail data in data mart, caching will be executed. As multiple users concurrently execute the detail data within 1 minute, caching will be executed for the second user by default. The configuration parameter is temp.cache.timeout, 60000 by default (1min).
Feature “setMeta” to Resolve the Problem Caused by Complex SQL Imported into Data Mart by Groups
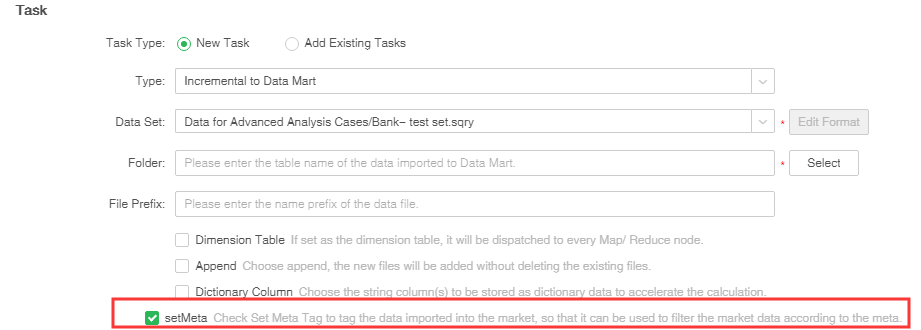
In the versions before V8.6, we can only add Meta to SQL dataset to be imported into the data mart by grouping and segmentation. As grouping and segmentation is parallelly executed as per copies, too many copies parallelly executed in some cases will cost more time when importing data into data mart by scheduled tasks. V8.6 has resolved this problem by introducing the SetMeta switch. When certain complex SQL need a long operation time, select SetMeta before imported into the data mart and then an SQL statement will be sent to the database. This operation will be much faster than parallel execution.
Operating steps are as follows:
1.Create the incremental import task in the scheduled task and select setMeta, as shown below:
2.Select the columns to be tagged and click Confirm, as shown below:
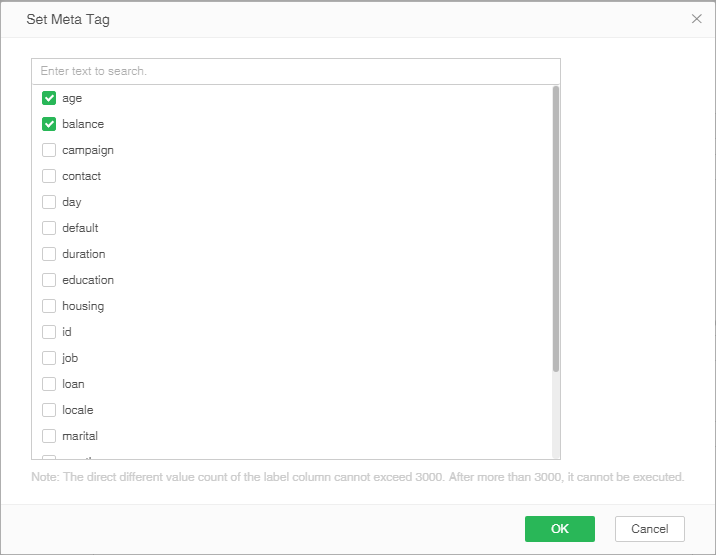
Only SQL datasets meeting the following three conditions can be tagged via setMeta:
A.The total number of rows of data > dc.unit.rows (262144 by default)
B.The number of copies of grouping <= dc.split.range (1000 by default)
C.(The total number of rows of data/the number of copies of grouping) > dc.unit.rows (262144 by default)
Import Mongo Dataset into Data Mart by Segments
Yonghong’s Mongo Dataset supports average segmentation or grouped segmentation when imported into the data mart.
Yonghong will parallelly segmente data with Mongo pipeline command.
Resolve the Problem of High CPU Usage Resulting from Thread Status
The root cause for CPU idling is that the tasks in the thread pool waiting queue are not ready and all threads will scan the task status, resulting in high CPU usage. A switch is added to decide whether to inspect the readiness with specialized threads. The configuration parameter is threadpool.task.check, true by default.
Isolate Different Types of Communication Requests to Enhance Stability
Different types of communication requests, such as administration requests or calculation result set requests, are isolated to enhance the stability of the data mart.
Optimize the Automatic Placing of Expressions to Enhance Performance
For data imported into the data mart, if expressions are created, the expressions will be calculated in the data mart on the basis of mass data. Such operation will impose tremendous pressure on the system and result in an extremely low query response speed. For this, V8.6 has been optimized. As long as there are expressions, with or without filters, they will be automatically wrote to disk to enhance performance.
❖New Features List
1. Self-Service Data Preparation
No. |
New Features |
Version |
1 |
V8.6 |
|
2 |
V8.6 |
|
3 |
V8.6 |
|
4 |
V8.6 |
|
5 |
V8.6 |
|
6 |
Multidimensional Dataset: Support Conversion of Text Columns to Date Columns |
V8.6 |
7 |
V8.6 |
|
8 |
Optimize Word“Computation in Database” |
V8.6 |
9 |
V8.6 |
|
10 |
V8.6 |
|
11 |
V8.6 |
|
12 |
V8.6 |
2.Dashboard
No. |
New Features |
Version |
1 |
Add Operational Guidance to A Fast Understanding of Features |
V8.6 |
2 |
Support Dynamic Calculation of Freestyle Table and Optimize Use Experience |
V8.6 |
3 |
V8.6 |
|
4 |
Add Select All in Filter Components and Enhance the Usability of Filter Operation |
V8.6 |
5 |
Support User-defined Sorting on the Left Sidebar and Auto Concealing of Unauthorized Dashboards |
V8.6 |
6 |
Support Self-Defined Filter Columns Based on Measure Columns |
V8.6 |
7 |
V8.6 |
|
8 |
V8.6 |
|
9 |
More Component Interaction Dynamic Effects to Enhance Interaction Experience |
V8.6 |
10 |
Optimize Script Function Description and Example to Enhance Script Usability |
V8.6 |
11 |
Support First Day of Week Configuration for Different Date Scenarios |
V8.6 |
12 |
Add Dynamic and Static Frame Materials to Facilitate Making Elaborate Dashboards |
V8.6 |
13 |
V8.6 |
3. Advanced Analytics
No. |
New Features |
Version |
1 |
V8.6 |
|
2 |
V8.6 |
|
3 |
V8.6 |
|
4 |
V8.6 |
|
5 |
V8.6 |
4. Workflow
No. |
New Features |
Version |
1 |
V8.6 |
|
2 |
Enhance the Usability of Process Creation and Make it More Friendly to Process Developers |
V8.6 |
3 |
Enhance the Usability of Process Application and Make it More Friendly to Approvers |
V8.6 |
5. Enterprise Management
No. |
New Features |
Version |
1 |
Scheduled Email Task Supports Direct Use of Images Instead of Attachments |
V8.6 |
2 |
V8.6 |
|
3 |
Support Partial Synchronization of WeChat Work Contacts |
V8.6 |
4 |
New Parameter to Control Whether to Mandatorily Change Weak Passwords |
V8.6 |
5 |
V8.6 |
|
6 |
Optimize LDAP Sync Logic |
V8.6 |
7 |
Built-in Roles at the Top |
V8.6 |
8 |
Automatic Front Placement of Selected Items on Authorization Editing |
V8.6 |
9 |
V8.6 |
|
10 |
Enhance Usability |
V8.6 |
11 |
V8.6 |
|
12 |
V8.6 |
6. Big Data