|
<< Click to Display Table of Contents >> Add Filter Column |
  
|
|
<< Click to Display Table of Contents >> Add Filter Column |
  
|
Filter Column can be easily set for individual measure columns, which can be used on aggregated tables/freestyles/pivots/charts.
❖Add Filter Column
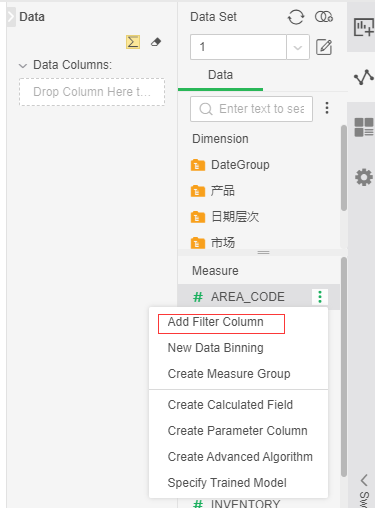
After selecting the dataset, click on the More menu in the metric column on the data tree and select New Filter Column.
Open the dialog as shown below:
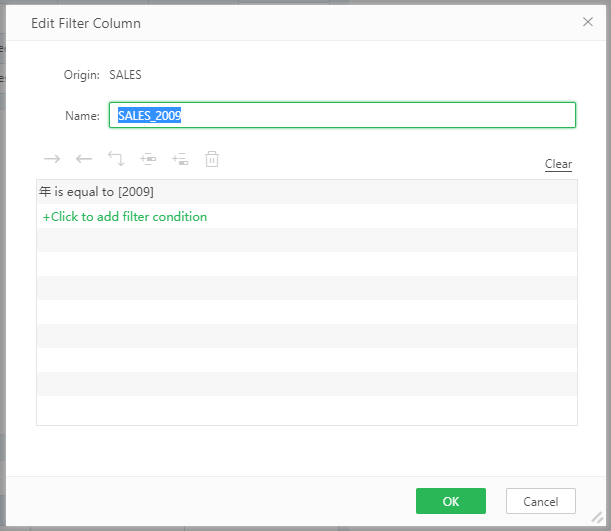
[Name] Set the name of the filter column.
[Filter] Set the conditions under which data needs to be filtered. See "Filter" for details.
Note: Dimension columns, aggregate expressions, analysis algorithms, lod expressions, training models, measure groups, etc. cannot be used to create new filter columns.
➢E.g
The table needs to show the data comparison of the same category for different periods, but there is only one data column. At this time, we can create and copy the filter column to achieve.
1. Create a new "SALES" filter column with the filter status "Year is = 2009".
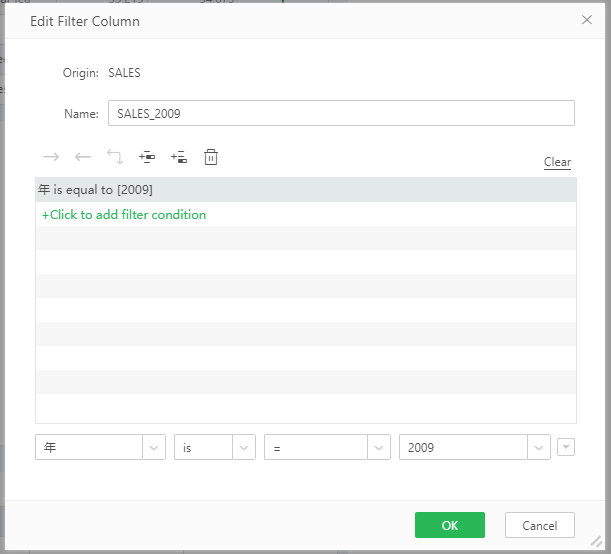
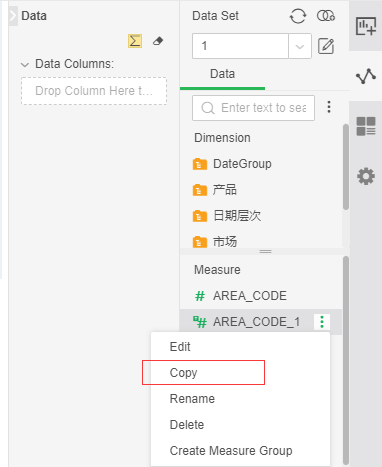
2. Copy the filter column and change the filter condition to "Year is = 2010".
3. Bind the two filter columns to the free table and set the table rendering. The effect is as follows:
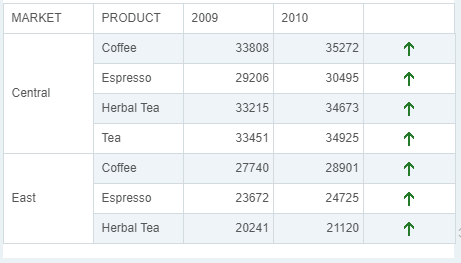
As can be seen from the figure, sales volume has improved compared to 2010 compared to 2009.