|
<< Click to Display Table of Contents >> Funnel |
  
|
|
<< Click to Display Table of Contents >> Funnel |
  
|
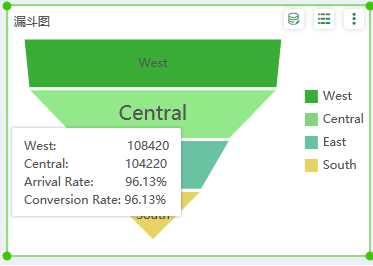
The funnel diagram is also called the inverted triangle. The funnel diagram presents the data in several stages. The data of each stage is a part of the whole. From one stage to another, the data gradually declines from top to bottom, and all stages are The proportion is 100%. Like a pie chart, a funnel plot does not present specific data, but rather a percentage of that data relative to the total.
❖Create a Funnel
To create a funnel plot, you can drag the funnel plot component to the report edit area in the component on the right pane, and bind the dimension and measure fields you want to display to where the data binding zone responds.

Mouse floating funnel chart, you can view the proportion of data in different dimension stages.

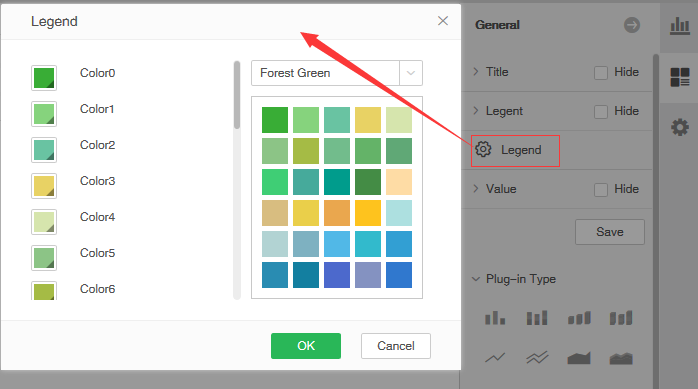
You can customize the color information of the block in the regular-segment of the right pane, as shown in the following figure.
