|
<< Click to Display Table of Contents >> Include |
  
|
|
<< Click to Display Table of Contents >> Include |
  
|
❖Contains the dimension expression - Include:
This expression calculates the value using the specified dimension and any dimension in the component.
Syntax: Include ([dim1 [, dim2]...]:: aggregate-expression])
For example, Include (col ['procuct']:: Sum (col ['sales'])
➢For Example: What is the average annual total sales of product category?
•thinking:
1. What is the average annual sales of all product categories? The goal of this analysis is different from the average annual sales. When we bind the fields of year and sales to the histogram, we get the average of the year.
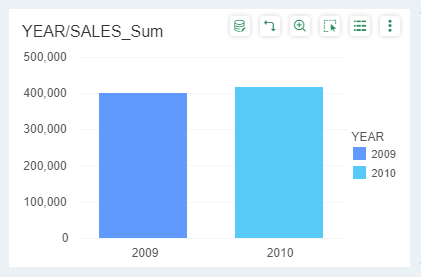
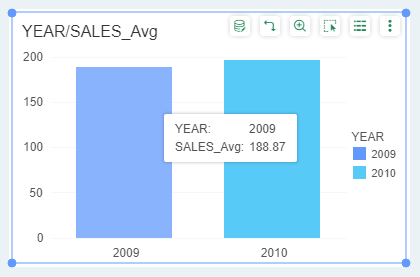
2. Summarize the sales of all sales records and divide them by the number of sales records. In this case, the total sales of all sales records in 2009 was 401159, divided by the number of sales records in 2009 (in this case, 2124), and the average of all sales records was 188.87.
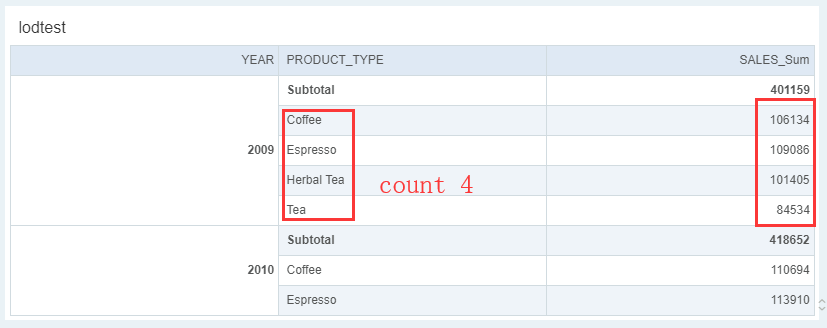
3. Now we need to calculate not the average value of all sales records, but the average value according to the product type. The calculation process is as follows:
1) The total sales of all product categories in 2009 was 401 159.
2) Take the total sales of all product categories (401159), divide by the number of product categories (in this case, 4), and get the average sales of all product categories, 100289.8.
•The implementation steps in Yonghong BI are as follows:
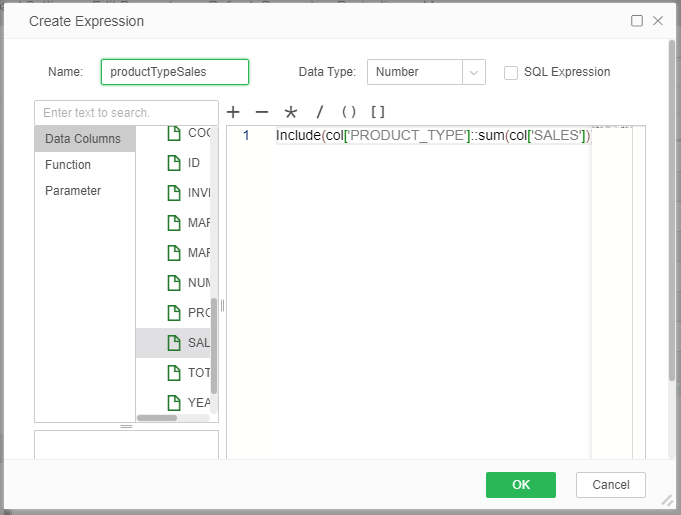
1. Using multi-granularity expression and Include function, we can quickly calculate the average sales of product types. By creating a new expression and writing a multi-granularity expression, the total sales volume of each product category can be calculated.
productTypeSales = Include (col ['product category']: Sum (col ['sales'])
Add the year-to-trade time to the X-axis, add the column "Sales of Product Categories" to the Y-axis and switch to the average. It is clear that the average value of the total sales of each product category in 2009 is 100289.75.
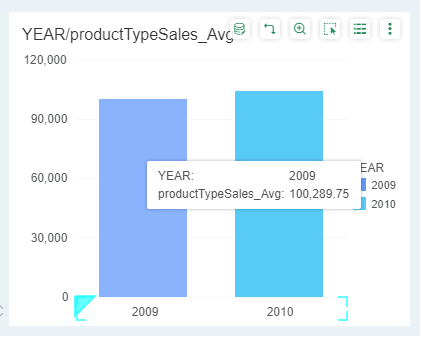
2. We put the average sales value of product categories and the average sales value of 2009 together in a bar chart. The difference between the two is obvious.
