|
<< Click to Display Table of Contents >> Exclude |
  
|
|
<< Click to Display Table of Contents >> Exclude |
  
|
❖Exclude dimension expression - Exclude:
This expression is calculated by subtracting the specified dimension from the dimension of the component binding.
Syntax: Exclude ([dim1 [, dim2]...]:: aggregate-expression])
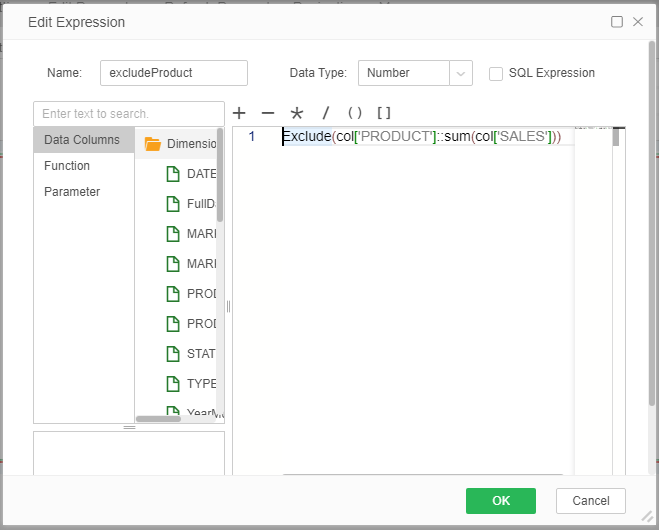
For example, Exclude (col ['procuct']:: Sum (col ['sales'])
➢For Example: How to view sales of a wide range of products at the same time?
•thinking:
1. How to intuitively see the difference between the sales of large categories and the sales of small categories contained in a chart? For example, the major category is: product category; the minor category is: product name.
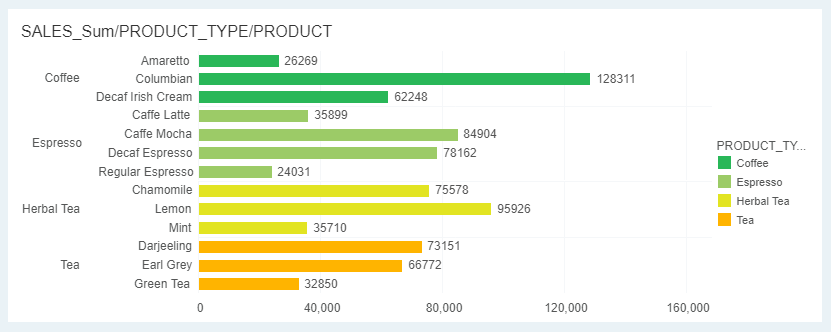
When we bind these two dimensions to the chart component, the bar chart shows the sales volume of the small category, that is, the sales volume of the PRODUCT.

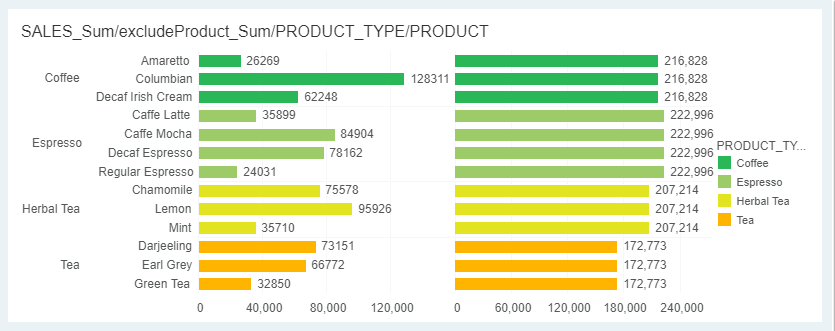
2. Now we want this bar chart to show both the sales of the PRODUCT_TYPE and the sales of the PRODUCT. There needs to be a list of data that can be calculated to ignore the impact of 'PRODUCT'.
•The implementation steps in Yonghong BI are as follows:
How do you see the sales of green tea and all tea directly in a chart? The steps we may think of are divided into the following three steps:
1. Exclude the influence of the dimension of "PRODUCT" in the chart on the calculation and calculate the sales volume. At this time, the calculated sales volume is the sales volume of the PRODUCT_TYPE.

2. Calculate the sales of the PRODUCT name and compare it with the sales in the first step.
3. Put the PRODUCT_TYPE in the legend color area, we can clearly see the comparison of green tea (small category) and tea (large category) sales, the effect is as follows:
