|
<< Click to Display Table of Contents >> Lod Enhancement |
  
|
|
<< Click to Display Table of Contents >> Lod Enhancement |
  
|
❖Multi-granularity Expression Enhancement Form
There are four forms of multi-granularity expression enhancement:
Synax:Fixed|Include|Exclude([dim1[,dim2]...]::aggregate-expression])
1.aggregate-expression can be a separate aggregate expression that is directly referenced
For example, Fixed(col['procuct']::col['A']) col['A']为Sum(col['sales'])
2.aggregate-expression can be an aggregate expression that contains a detail expression
For example, Fixed(col['MARKET'],col['MARKET_SIZE']::sum(col['sales'] +1))
3.aggregate-expression can be an aggregate expression and then later evaluated
For example, Fixed(col['MARKET'],col['MARKET_SIZE']::sum(col['sales']) +1)
4.aggregate-expression can be an aggregate expression contained in a conditional branch
For example, Fixed(col['MARKET'],col['MARKET_SIZE']::if sum(col['sales'])>50000 then 'Y' else 'N' end)
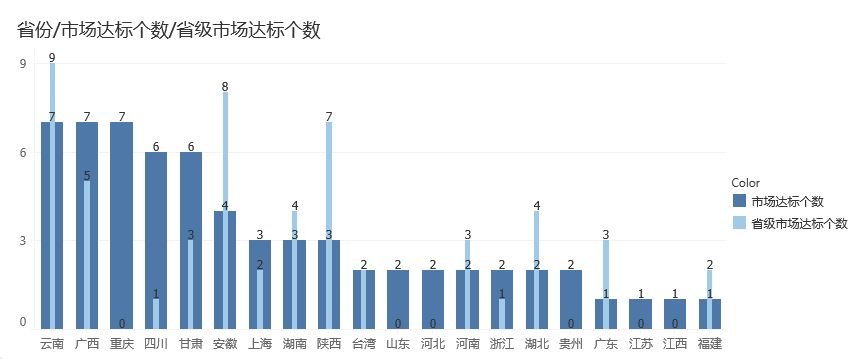
➢Case: How to view the province under the market average profit and the province belongs to the market average profit standard situation?
•Train of thought:
Set the average profit of all products as the target, calculate the number of average profit of market and products greater than the total average profit and the number of average profit of market and products greater than the total average profit by province.
•Implementation Steps in Yonghong Bi:
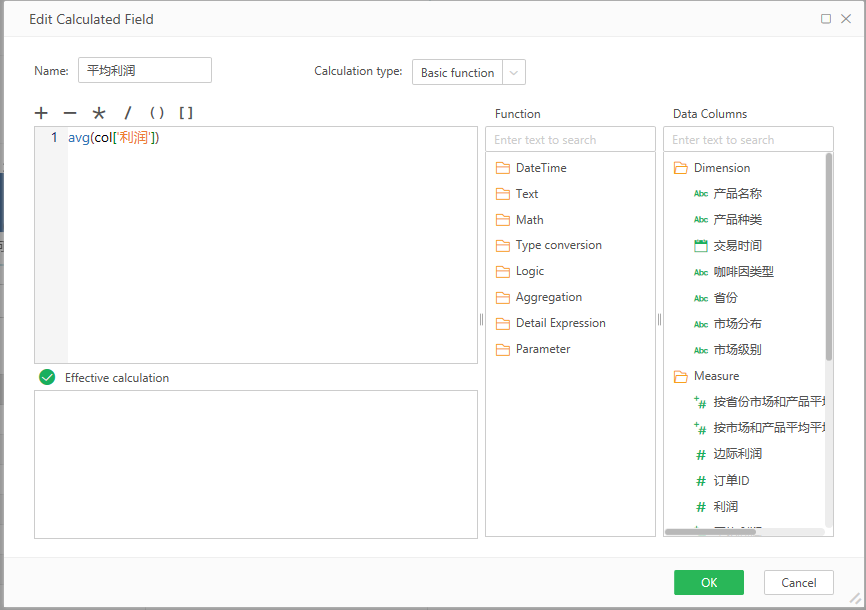
1. New Calculation Column"average profit",avg(col['profit']).

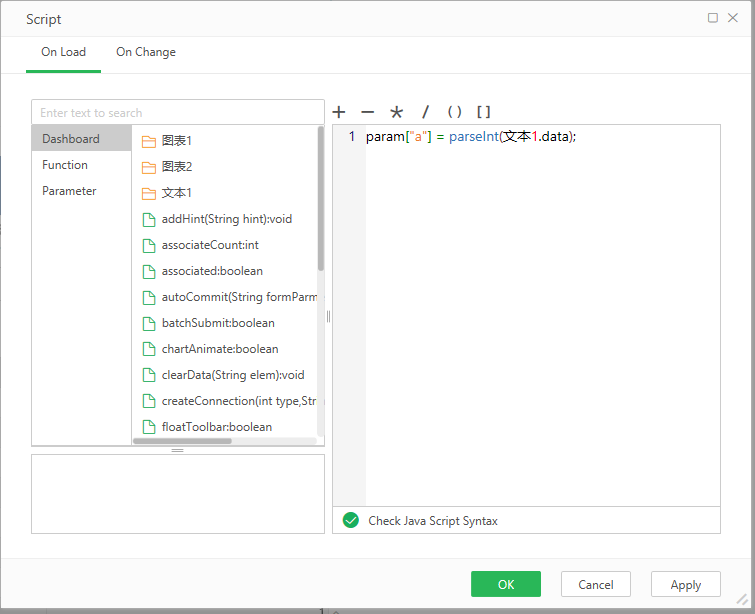
2. New Calculation column "total average profit",exclude(col['province'],col['market'],col['product']:: col['average profit']), bind to text1, added dashboard script param["a"]=parseInt(text1.data);.

3. New Calculation column "by market and product average profit greater than total average profit",fixed(col['market'],col['product']::if avg(col['profit'])>param["a"] then 1 else 0 end)New Calculation column "by provincial market and product average profit greater than total average profit",include(col['market'],col['product']::if avg(col['profit'])>param['a'] then 1 else 0 end).
4.Tying "province" , "by market and product average profit greater than total average profit" and "by provincial market and product average profit greater than total average profit" into the graph, we can get the graph of the number of standard-meeting markets by province and the number of standard-meeting markets by province, image:
