|
<< Click to Display Table of Contents >> K-Means Clustering |
  
|
|
<< Click to Display Table of Contents >> K-Means Clustering |
  
|
K-Means is a type of Clustering algorithm, where K represents the number of classifications and Means indicates the mean value. Just as its name implies, K-Means is an algorithm for data clustering via mean value. K-Means algorithm divides similar data points via the preset K value and initial clustering center of each classification, and gets the optimal clustering results via mean iterative optimization after division.
In order to enhance the computational efficiency of K-Means clustering, Yonghong Z-Suite supports distributed system computing of K-Means. Distributed computing is used when the input node data set is "data mart data set.
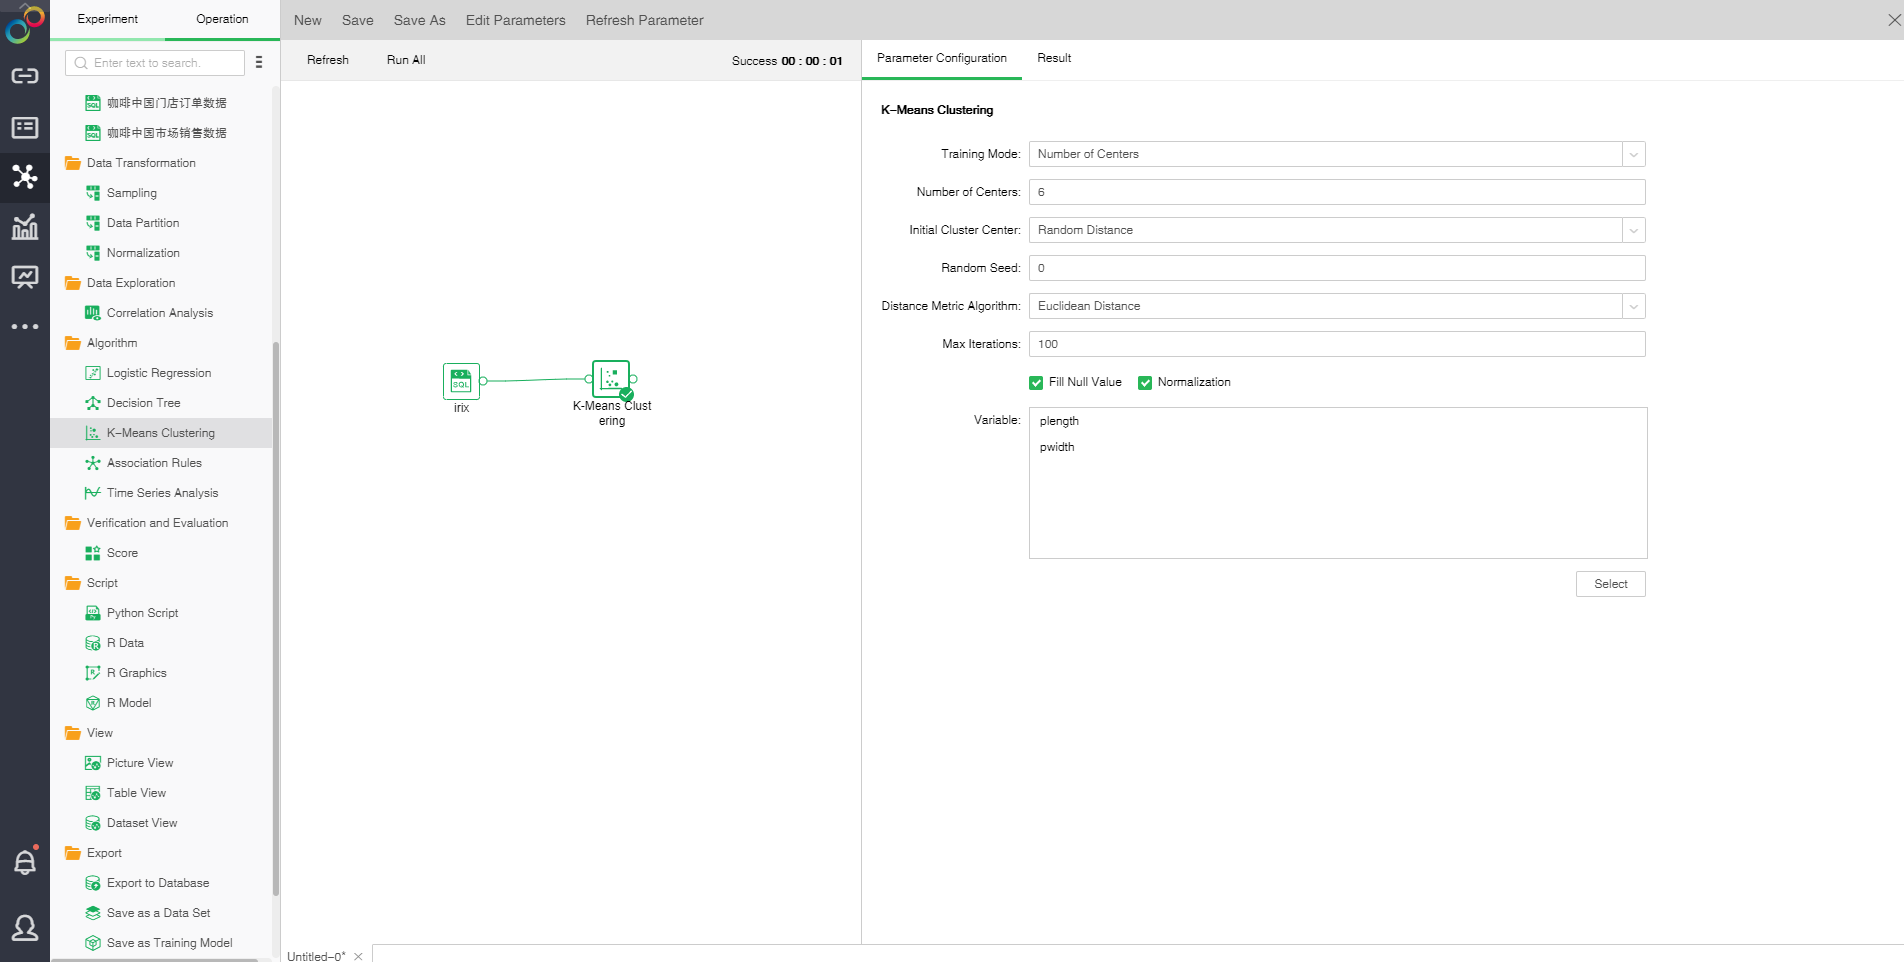
"Drag a data set and a K-Means Clustering node to the edit area. Connect the data set and K-Means Clustering node. Select "K-Means Clustering."

❖The configuration of K-Means Clustering model
After adding the K-Means Clustering model to the experiment, you can set the model through the "Parameter Configuration" page on the right side.
[Training Mode] Contains number of Clustering center and range of the number of clustering center
[Number of Center] Number of clustering center
[Centers Number Range ] Range of the number of clustering center
[Initial Cluster Center] Initial clustering center methods consist of random distance and Kmeans++. Random distance refers that all clustering centers are randomly selected. In the Kmean++ method, the first clustering center is randomly selected and other clustering centers are selected according to distance. The farther away from the clustering center, the higher probability will be.
[Random Seed] Generate random number seed. The default value is 0.
[Distance Metric Algorithm] Includes two methods: Euclidean distance and Cosine distance. Euclidean distance is the actual distance between two data points. Cosine distance is the measure between the cosine values of the two vetorial angles in vector space which is used to measure the difference between two individuals.
[Max Iterations] Maximum number of iterations. Calculate the stable number of clustering center finally. The default value is 100.
[Fill Null Value] Fill the mean value of the independent variables column to the column. The default is filling value.
[Normalization] Normalizes independent variables. The default normalization method is Z-Score normalization.
[Variable] Select the fields need to be used as independent variable from the selected column dialog box.
❖Run the experimental model
When the user completes the configuration of the model, clicking on the K-Means Cluster node and selecting "run" in the right menu, the model can run, and the running time is calculated at the top right of the edit area. You can also directly click the "run all" above the edit area to run the experimental model you set.
After the operation is successful, the output of the box will be output. Click the contraction icon to check the node state and display the node successfully, as shown in the following figure.

If the operation fails, the node will prompt failure, hover over the node to see the reason for the failure, as shown below.

❖Result
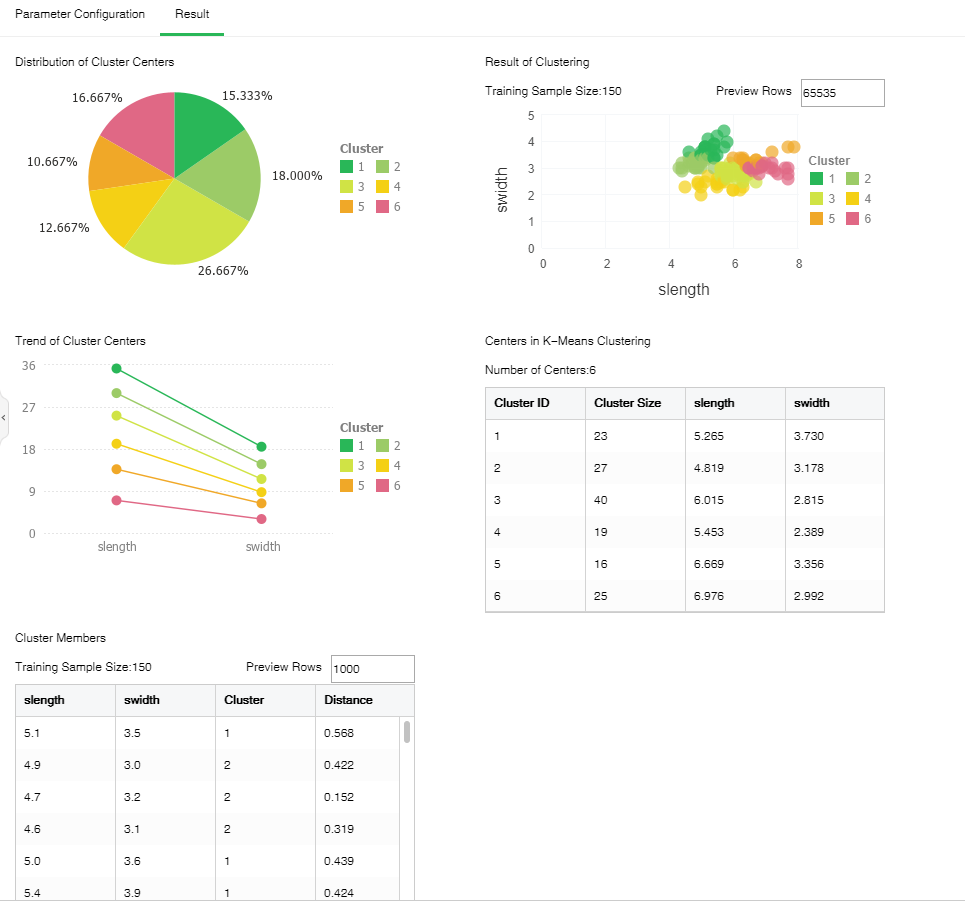
The following figure shows the K-Means clustering result in which the number of clustering centers is 6 and the number of samples is 150.

•Distribution of Cluster Centers
The proportion of the number of samples in the cluster accounting in the total number of samples.
•Trend of Cluster Centers
Variation tendency of each clustering center on independent variable.
•Result of Clustering
Scatter diagram after clustering drawn based on the first two columns.
[Preview Rows] The chart displays 65535 rows of data by default. The value can be changed.
•Centers in K-Means Clustering
Value of clustering center on independent variable
•Cluster Members
Sample cluster and distance to the clustering center
[Preview Rows] The default number of preview rows is 1000. The value can be changed.
[Cluster] Classification number.
[Distance] Distance between each sample to the nearest clustering center calculated according to distance calculating methods.
❖Save as trained model
After the K-Means clustering model runs successfully, we can choose to connect "Save as Trained Model" node and run . Only when the model is saved as a training model, the application of the report module can be visualized. In the directory of the left training model, you can view the K-Means clustering training model .
Take Examples/Employee Turnover as an example, select the K-Means clustering node. The configuration items for the node are as follows:
Right-click Save as Trained Model. In the dialog box that is saved as the training model, select the path. The name is either the node name or the name by default. Click OK to save the model to the training model folder on the resource tree.
Open the saved training model "K-Means Clustering". The displayed information includes three parts: title, basic attributes, and model training summary. The title is the name of the training model; the basic attribute is the value of all attributes in the configuration item; the model training summary section shows the source, algorithm, category, and time factor of the experiment node. The specific display is as follows:
|
❖Save as Data Set
Less than 100,000 data supports are saved as embedded data sets, and over 100,000 are not allowed to be saved as embedded data sets. Save as Data Set can be viewed in the Create Data Sets module. Click here to see an example of "Save as Data Set ."
➢For example: After the K-Means cluster node is saved as a data set, the metadata is as follows:
The Preview data is as follows:
|
❖Export into Database
Imports the node data into the table specified by the selected database. Click here to see the process of Export to Database .
Take the “Case Analysis/Customer Losing??experiment as an example, select the Score node and connect to Export to the Database node, as shown in the following figure:
1. [Model Node] Path and name of the node exported to the database. 2. [Connection] Select an existing data source as required. The following database types are supported at present: MySQL, Oracle, SQL Server, DB2, PostgreSQL, and Derby. 3. [Database] Default database of the selected data source. The following database types are supported at present: MySQL and SQL Server. 4. [Schema] Table structure mode of the selected data source. The following databases are supported: PostgreSQL, SQL Server, DB2, Oracle, and Derby. 5. [Table] Table name of the specified database. The data set result will be inserted into the table. 6. [Append] If you select "Append", the original data in the table still exist, and the data set result will be inserted directly into the table. When the user doesn't click Addition, the original data in the table will be deleted, and the result of the data set will be inserted directly into the table. |
❖Export PMML
When the model node has been trained , the corresponding PMML file will be generated. Users can choose to connect "Save as a PMML File" node then run it, and export the generated PMML file to the local area, and then use it for other platforms.
Note: Only K-Means clustering model of Euclidean distance supports exporting PMML.
❖K-Means cluster node rename
In the right-click menu of the K-Means clustering node, select "Rename" to rename the node.
❖Delete K-Means Clustering Node
In the right-click menu of the K-Means clustering node, select "Delete" or click the delete key on the keyboard to delete the node and node's input and output connections.
❖Refresh the K-Means clustering node
In the right-click menu of the K-Means clustering node, select "Refresh" to update the synchronization data or parameter information.