|
<< Click to Display Table of Contents >> Decision Tree |
  
|
|
<< Click to Display Table of Contents >> Decision Tree |
  
|
Decision tree is a tree structure used for example classification. Decision tree is composed of nodes and directed edges. There are two node types: Internal node and leaf node. Among them, internal node represents testing conditions of a feature or attribute (Used to separate records with different characteristics). Leaf node represents a classification.
Once we have constructed a decision tree model, it is very easy to classify based on it. The specific method is as follows: Starting from the root node, test with a specific feature of the instance. Assign the instance to its child node according to the test structure (namely selecting an appropriate branch); if a leaf node or another internal node can be reached along the branch, perform recursive implementation by using new test conditions until a leaf node is reached. When reach the leaf node, we will get the final classification results.
Drag a data set and a decision tree node to the edit area. Connect the data set and decision tree node.
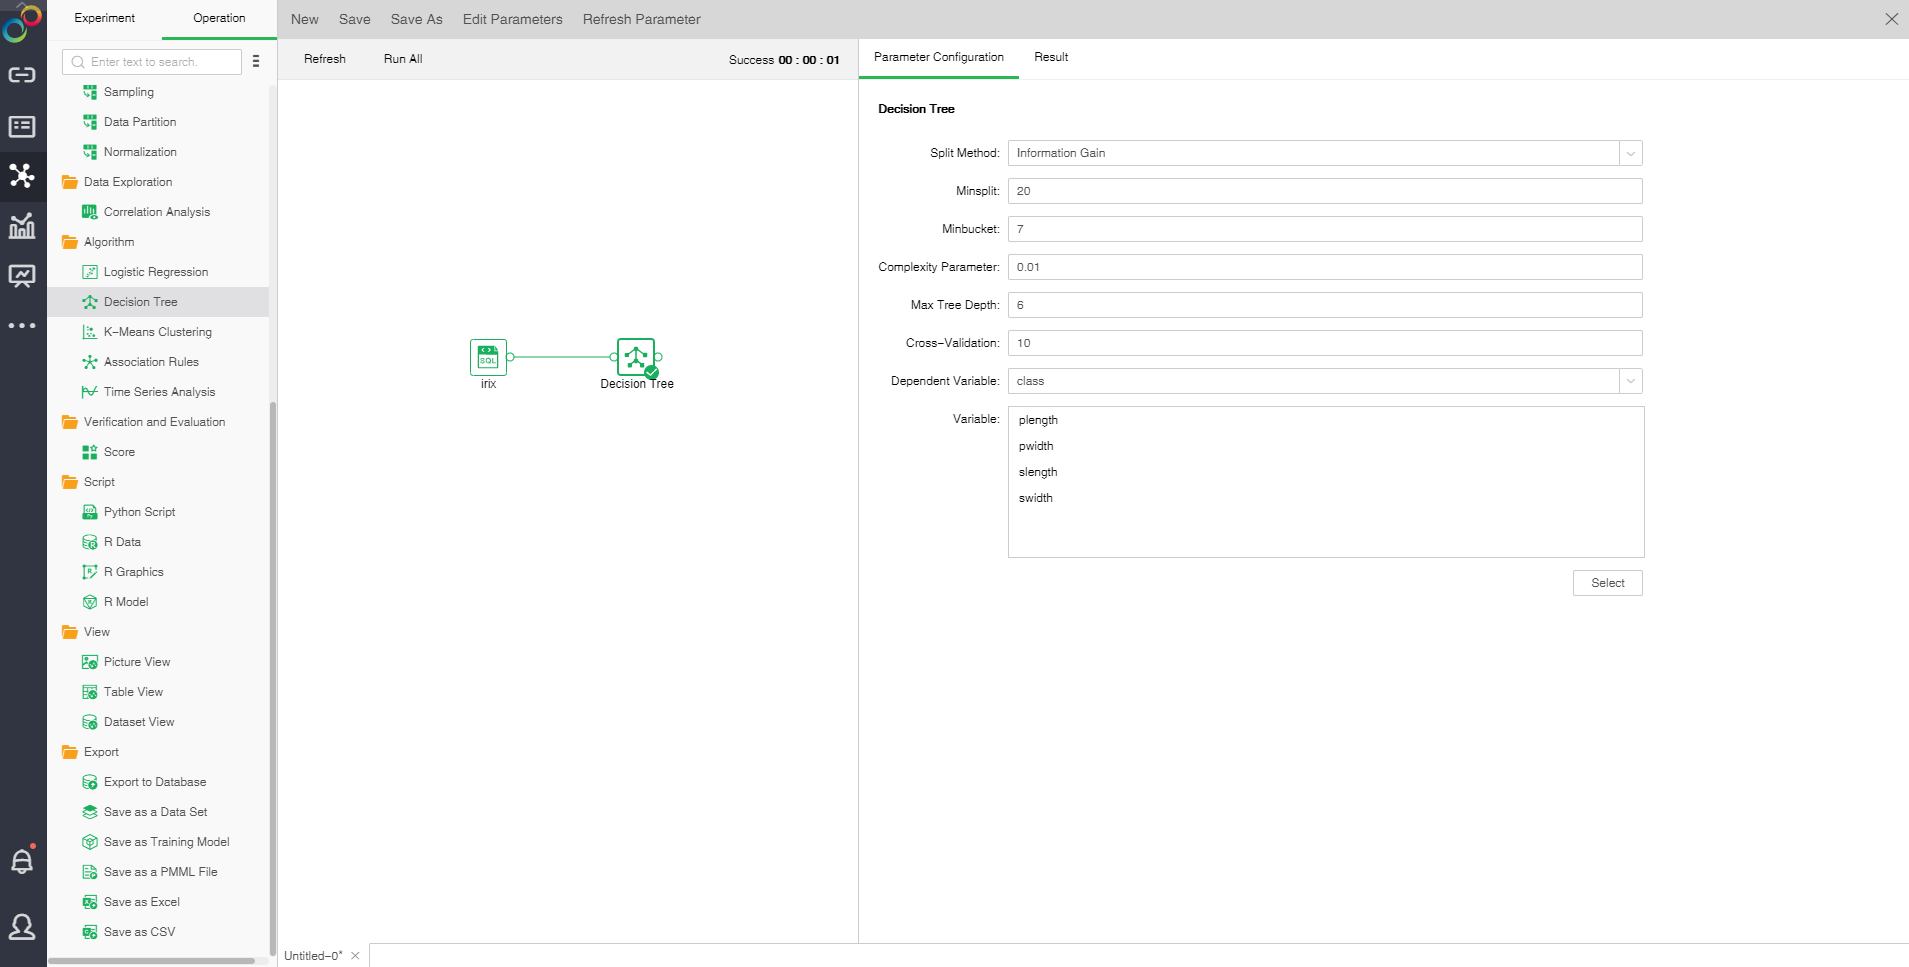
❖The configuration of Decision Tree model
After adding the Decision Tree model to the experiment, you can set the model through the "Parameter Configuration" page on the right side.
[Split Method] Contains "Information Gain" and "Gini Coefficient."
• Information gain: promoted value of the subset purity after division.
• Gini coefficient: probability of incorrectly assigning a sample randomly selected in a sample set.
[Minsplit] If the sample number is smaller than the node, it will not be split. The default value is 20.
[Minbucket] If the sample number is smaller than the value, the branch will be cut off. The default value is 7.
[Complexity Parameter] Each division will calculate a complexity. When the complexity is greater than the parameter value, splitting will not be carried out any longer. The default value is 0.01.
[Max Tree Depth] Number of hierarchies of decision tree. The default value is 6.
[Cross-Validation] Optimal equation can be obtained through cross validation. The default value is 10.
[Dependent Variable] Select the fields used as dependent variable from the drop-down list. Any system (or model) is composed of various variables. When we analyze these systems (or models), we can choose to study the effects of some variables to others. Those variables we selected are known as independent variables, and those affected variables are referred to as dependent variables.
[Variable] Select the fields need to be used as independent variable from the selected column dialog box.
❖Run the experimental model
When the user completes the configuration of the model, clicking on the decision tree node and selecting "run" in the right menu can run the model, and the running time is calculated at the top right of the edit area. You can also directly click the "run all" above the edit area to run the experimental model you set.
After the operation is successful, the output of the box will be output. Click the contraction icon to check the node state and display the node successfully, as shown in the following figure.

If the operation fails, the node will prompt failure. The mouse can suspend the node to see the cause of failure, as shown in the following figure.

❖Result
After the success of the decision tree model, the result of the experimental model can be viewed through the "result display" page on the right side.
•Tree Graph
There are two types of classification results, dichotomy and polytomy. When the dependent variable only has two different values, it is dichotomy; when the dependent variable has more than two different values, it is polytomy. ??Node ID is above the node. There are two rows within the node. The first row is the final classification of the node. In case of polytomy, the second row is the probability value of each classification of the node. In case of dichotomy, the second row is the probability value of the main classification of the node. Yes and no represent whether the conditions are met or not thus to determine the branch direction. Node color represents purity.
Binary tree form results are displayed as follows:
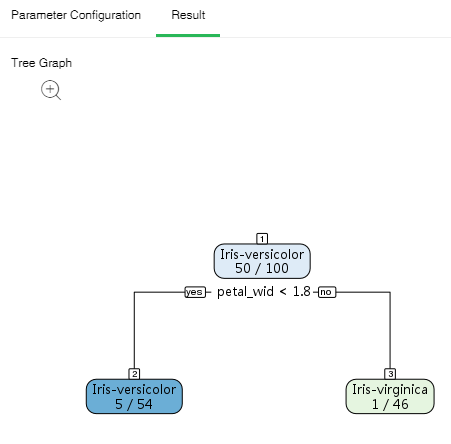
➢Note: A green node refers to the main classification. Blue node 5/54 indicates that Iris-versicolor is the probability value of Iris-virginica.
Polytomous tree form results are displayed as follows:
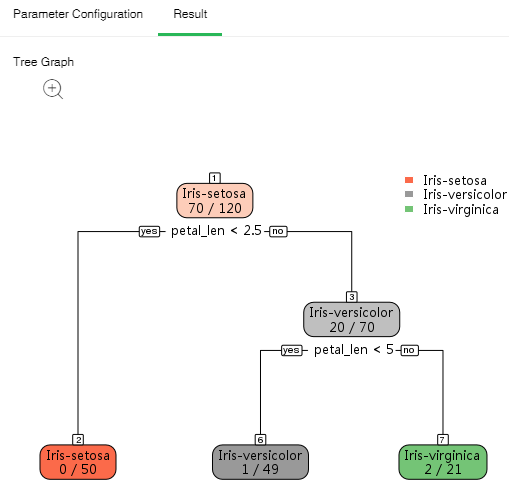
Click the zoom button to enlarge the image so that it can be viewed more clearly.
•Summary of Node Classification
List the information of all leaf nodes.
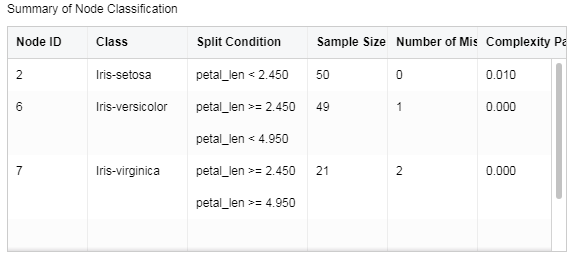
[Node ID] Number of lead node
[Class] Classification of lead node
[Split Condition] Determination condition for root to leaf node
[Sample Size of Node] Sample number of leaf node
[Number of Misclassifications] Sample number of mis-classification
[Complexity Parameter] Complexity parameter of each leaf node.
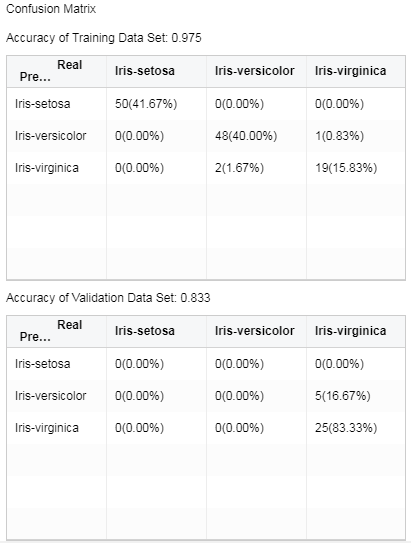
•Confusion Matrix
Situation analysis table of predicted results. In case of data partition, the analysis table of validation set can be checked.
The transverse header is the real value. And the vertical header is the predicted value. The integer value represents the number of samples, and the percent is the ratio of the number of samples to the total number of samples. The accuracy is the same proportion of the true value and the predicted value.
❖Save as a trained model
After the decision tree model runs successfully, we can choose to connect "Save as Trained Model" node and run . Only when the model is saved as a training model, the application of the report module can be visualized. In the directory of the left training model, you can view the decision tree training model .
Take "Case Examples /Telemarketing" as an example. Select the decision tree node. The configuration items for the node are as follows:
Save as a training model, and open the saved training model. The information is displayed as follows:
|
❖Export PMML
When the model node has been trained , the corresponding PMML file will be generated. Users can choose to connect "Save as a PMML File" node then run it, and export the generated PMML file to the local area, and then use it for other platforms.
❖Decision Tree Node Rename
In the right-click menu of the decision tree node, select "Rename" to rename the node.
❖Delete decision tree node
In the right-click menu of the decision tree node, select "delete" or click the delete key on the keyboard to delete. You can delete the input and output connections of nodes and nodes.
❖Refresh the decision tree node
In the right-click menu of the decision tree node, select "Refresh" to update the synchronization data or parameter information.