|
<< Click to Display Table of Contents >> Pth Percentile |
  
|
|
<< Click to Display Table of Contents >> Pth Percentile |
  
|
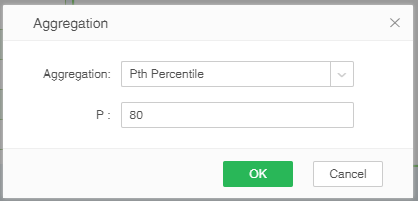
Pth percentile: If a set of data is sorted from small to large and the corresponding cumulative percentile is calculated, the value of the data corresponding to a percentile is called the percentile of this percentile, Group n observations are arranged by numerical value. For example, the value at the p% position is called the p-th percentile. . The user can modify the aggregation mode in the aggregation dialog box to Pth percentile. When the Pth percentile is selected, the P input box is displayed below the aggregation option. This input box only supports input numbers, and the valid value is [0, 100].
➢Example
Bind 2 columns "列名" and "值" to the table component. The aggregation method of "值" is set to Pth percentile and P is "80".

It is known that 9 of the data in the column "值" are 1, 2, 2, 3, 3, 4, 4, 4, 6, respectively, then P% is 9*0.8=7.2, and 7/8 bits are 4, So the result is 4, as shown below.
