|
<< Click to Display Table of Contents >> Prepare Data |
  
|
|
<< Click to Display Table of Contents >> Prepare Data |
  
|
By preparing the data, you can filter out the data from the data source, govern the data, and use the created data set to make a dashboard. Self-service data sets have powerful and easy-to-use data query governance capabilities. Visual drag-and-drop operations make it easy to prepare your own data. This section uses self-service join data as an example to show you how to join data and form a new data set. The effect of the data set join is shown in the following figure:
Order ID |
Shop |
Inventory |
VIP |
236 |
Franchised Outlet |
55 |
Platinum |
416 |
Franchised Outlet |
46 |
Diamond |
Join
Order ID |
Market |
Product |
Profit |
236 |
Eastern Market |
Decaf Coffee |
29 |
416 |
Eastern Market |
Lemon Tea |
39 |
You will get the table
Order ID |
Market |
Product |
Profit |
Shop |
Inventory |
VIP |
236 |
Eastern Market |
Decaf Coffee |
29 |
Franchised Outlet |
55 |
Platinum |
416 |
Eastern Market |
Lemon Tea |
39 |
Franchised Outlet |
46 |
Diamond |
You can use the sample data sets built into the product "Coffee Sales Data of China Market" and "Coffee Orders Data of China Market", and follow the steps below to join the data.
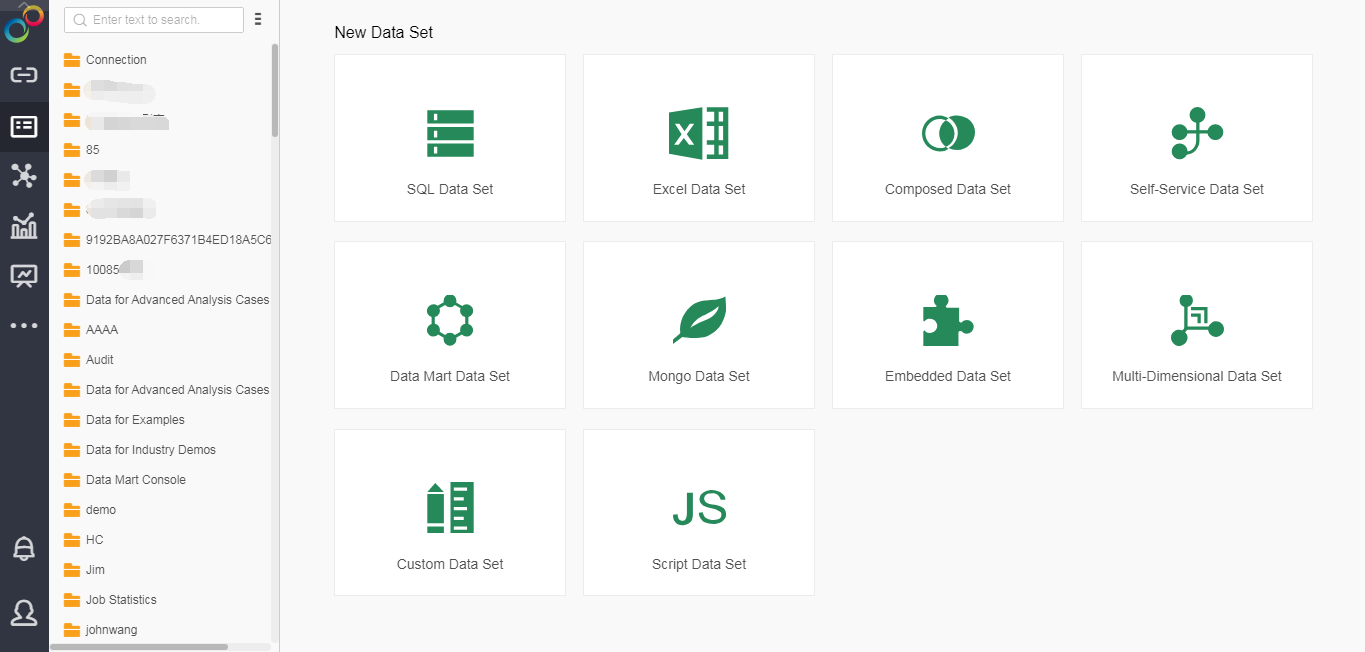
1.Enter Self-Service Data Set
In the home page navigation area after login, select "Self-Service Data Set" to enter the self-service data set interface.
2.Create Data Set
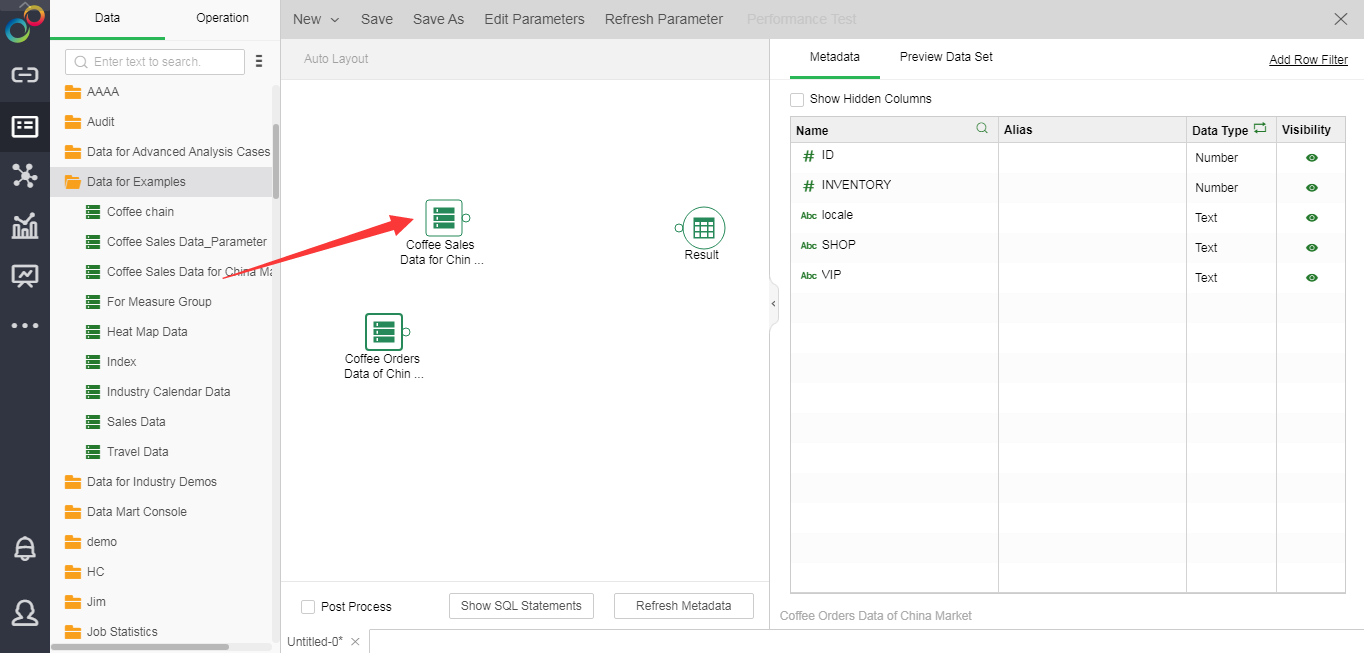
1)In the data set list, drag the data sets "Coffee Sales Data of China Market" and "Coffee Orders Data of China Market" to the editing area.
2)In the operation list, drag and drop the "Join" operation to the vicinity of the data set, the system will automatically connect the data set and the join node. If the system does not automatically connect them, you can drag the node again to complete the automatic connection. If the "Join" node is too far from the data set node, you can manually connect the data set and operation.
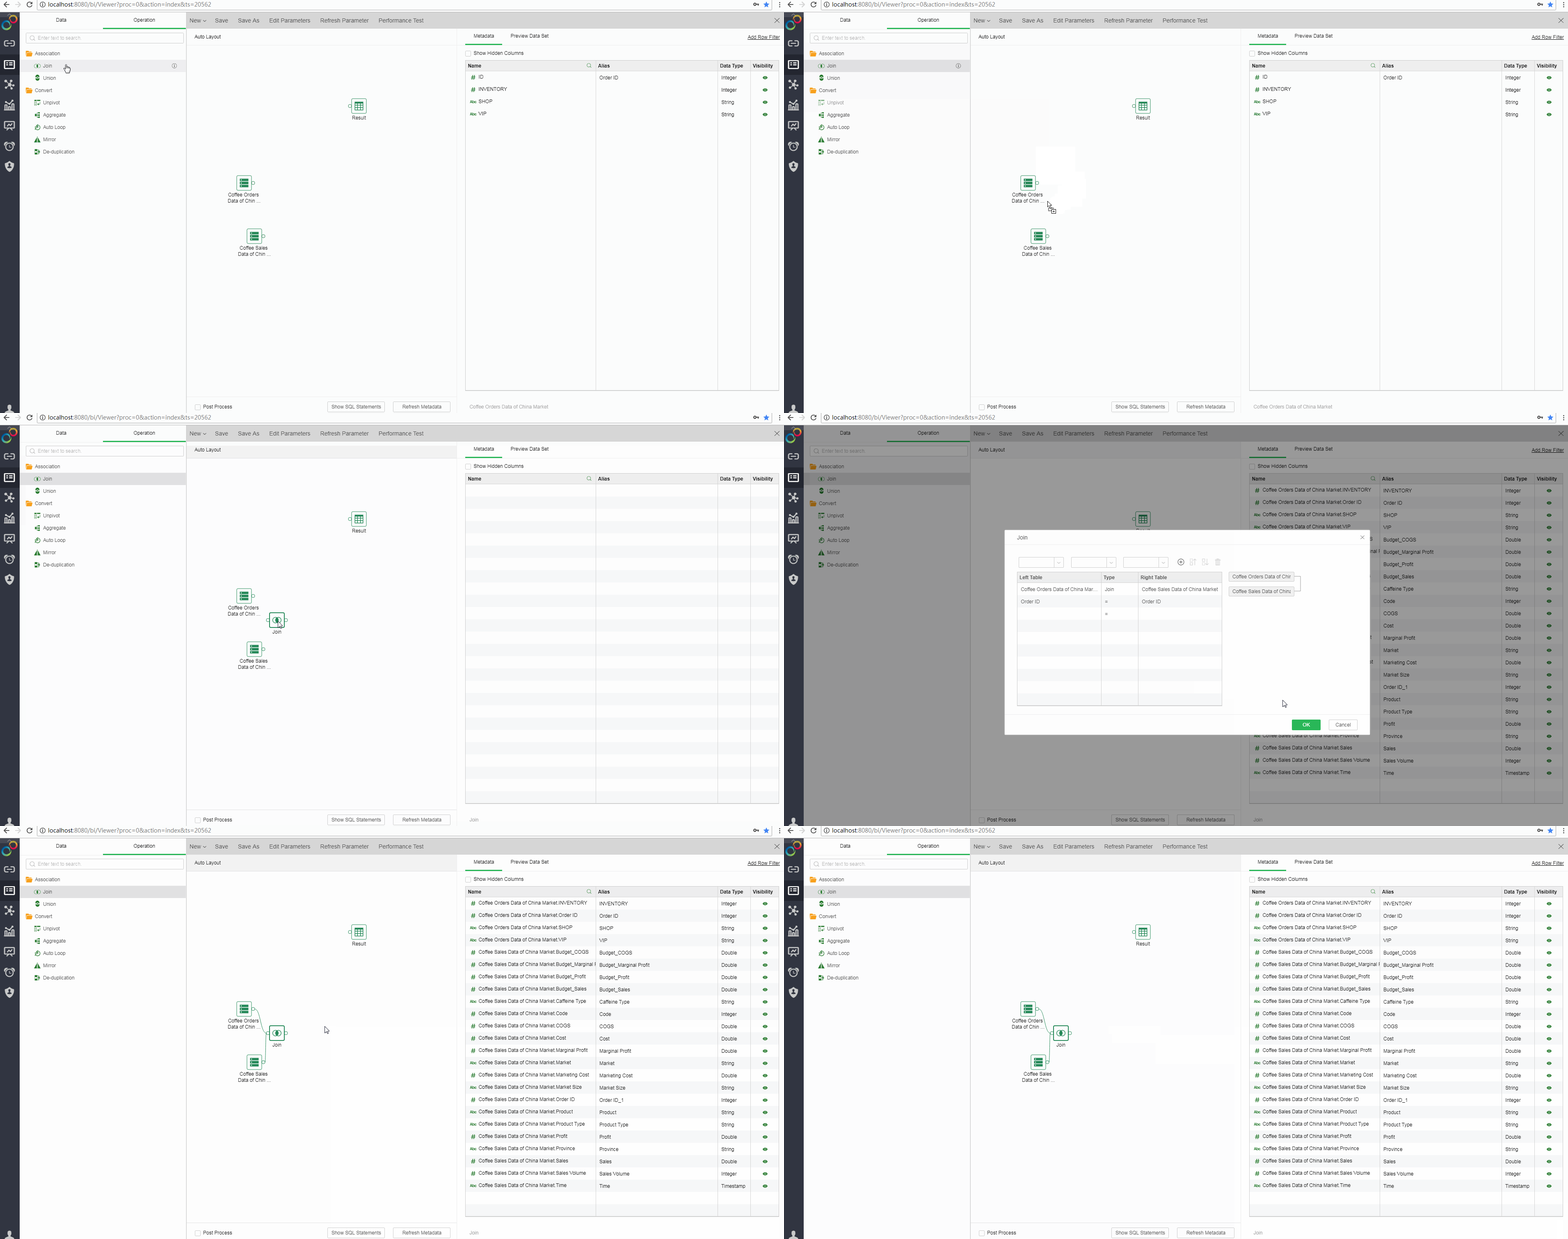
3)When connecting two data sets, the system uses the "Join" connection method and automatically matches the connection columns. In this example, the join method is "join", and the join column is "Order ID", which means that the data with the same order ID of the two tables are combined together, as shown in the following figure. If you need other connection methods, just set the required connection method and connection column in the pop-up connection dialog.

4)Drag the Result near the Join node and the system will automatically connect them.
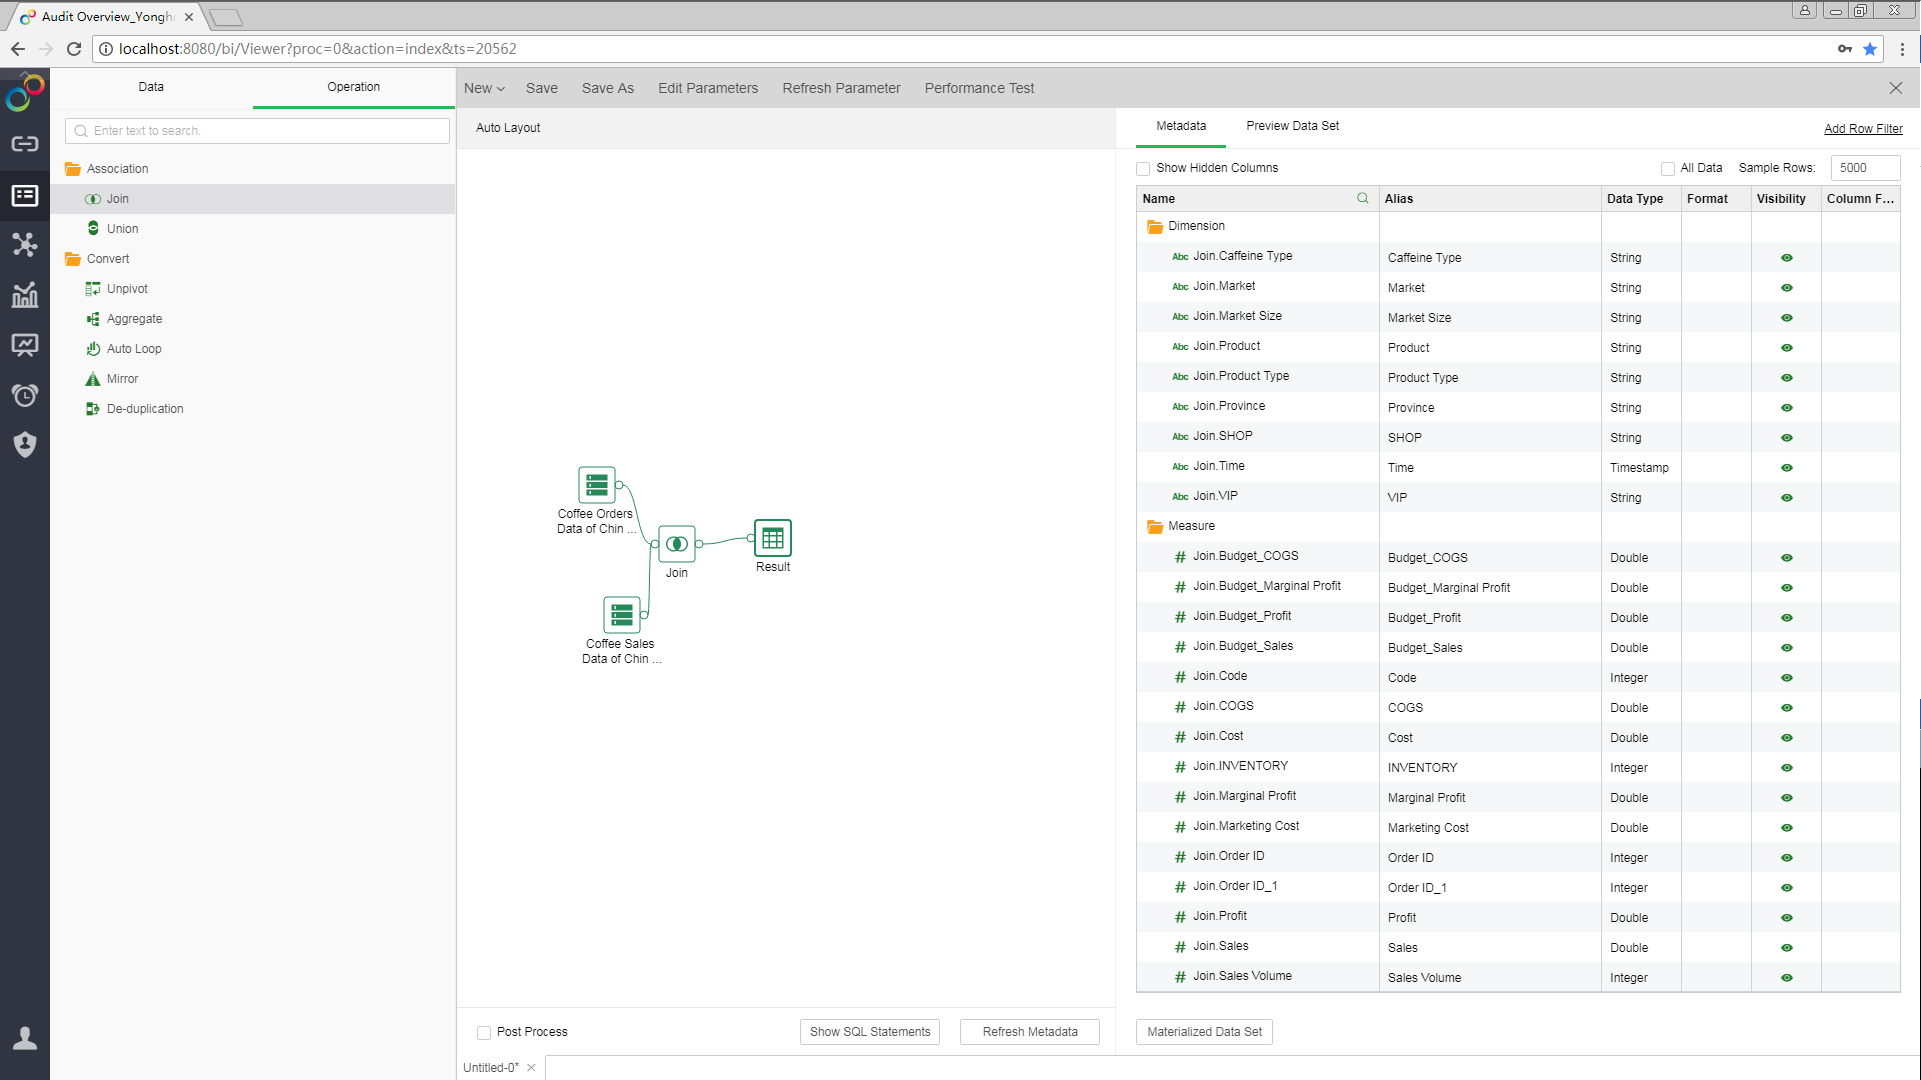
3.New Date Column
In data analysis, time is a common analysis dimension that helps show data information or trend at a specific time. In order to display the data in the time dimension when creating the dashboard, you need to create the required time dimension in the metadata area.
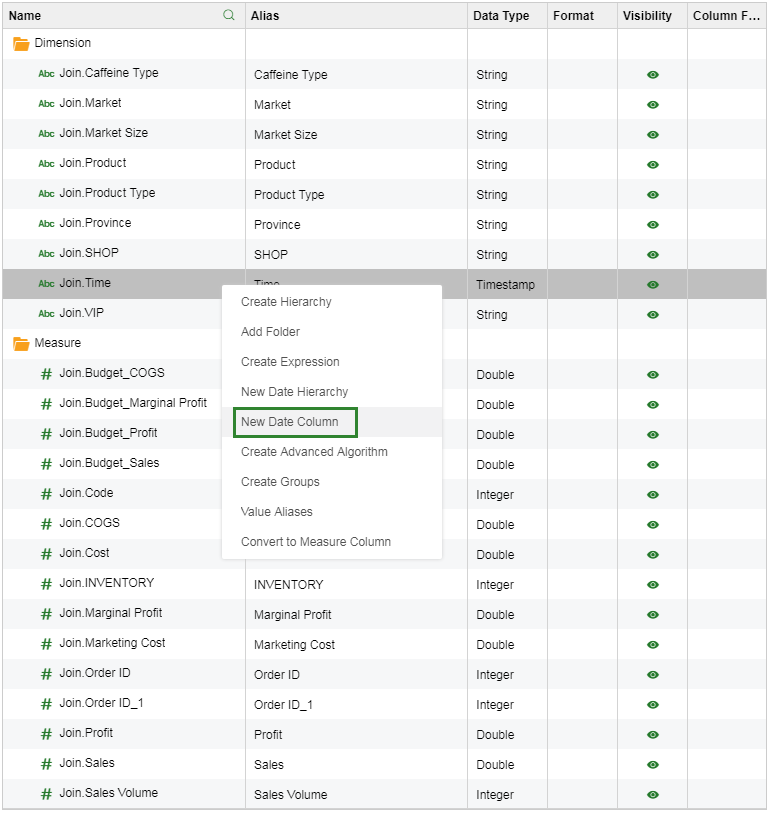
1)In the "Join.Time" data column, select "New Date Column" from the "More" menu.
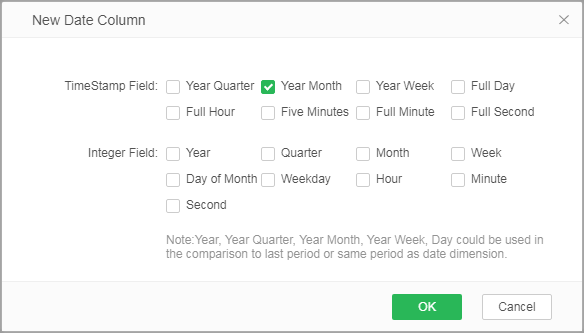
2)The format of the date column is "Year Month".
3)The dimension area appears the time dimension "YearMonth_Time" you have just created, and the system automatically uses "Year Month" as an alias for the time dimension.
4.Save Data Set
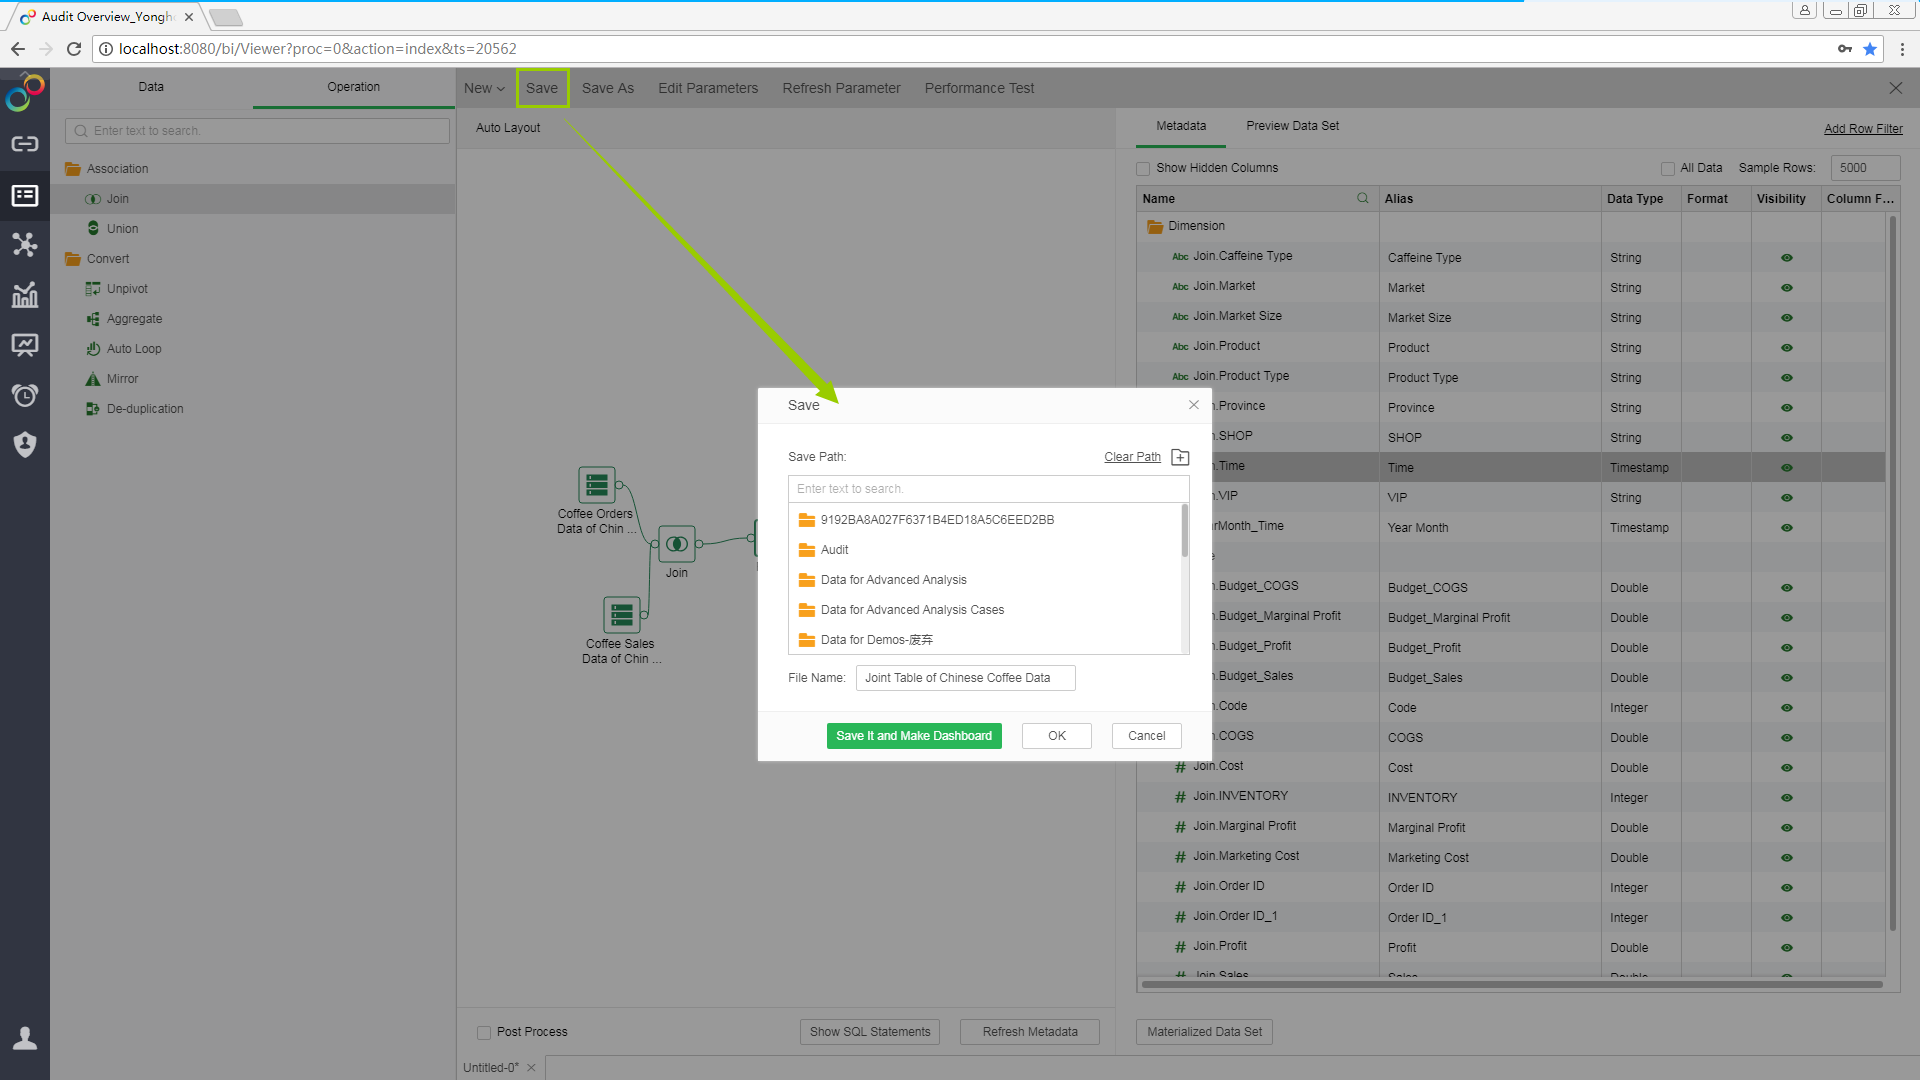
Click the menu bar -> [Save] to save the data set as "Joint Table of Chinese Coffee Data".
5.Enter Create Dashboard
In Save dialog, click [Save It and Make Dashboard] to save the data set as well as jump into the Create Dashboard page.
For detailed steps on using data to make dashboard, see the next section "Create Dashboard."