|
<< Click to Display Table of Contents >> Relation |
  
|
|
<< Click to Display Table of Contents >> Relation |
  
|
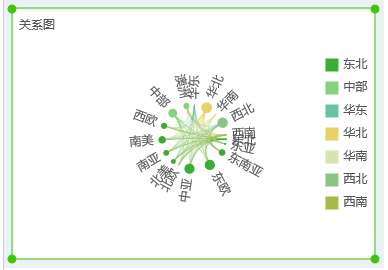
Relation, a diagram used to describe the relationship between nodes, mainly used to represent the relationship between two nodes, the number of lines representing the weight of the relationship between nodes.
❖Create a Relation
To create a relationship diagram, you can drag the diagram component to the report editing area in the component of the right pane, and bind the source node, target node, node value (metric), and node type field to the data binding area response. The location, as shown in the following figure, where the node type acts like a legend color column.

You can customize the color information of the block in the regular-segment of the right pane, refer to the funnel chart.