|
<< Click to Display Table of Contents >> Sunburst |
  
|
|
<< Click to Display Table of Contents >> Sunburst |
  
|
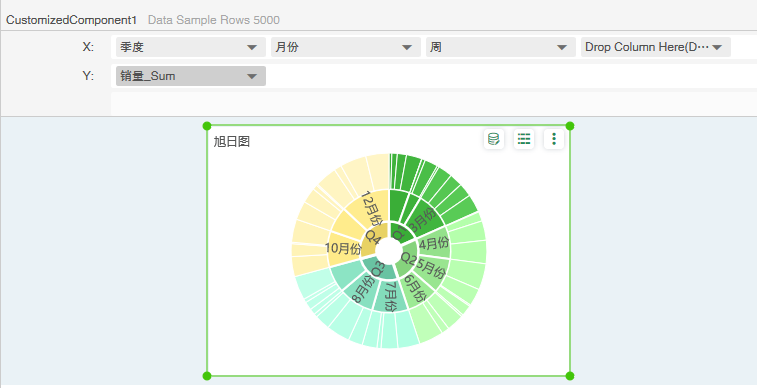
Sunburst is a modern pie chart that transcends traditional pie charts and ring charts, expresses clear levels and attributions, and displays data composition in a parent-child hierarchy. In the sunburst chart, the closer to the far point, the higher the level. In the adjacent two layers, the inner layer contains the outer layer.
❖Create a Sunburst
To create a sunburst chart, you can drag the sunday chart component to the report editing area in the component of the right pane, and bind the different levels of dimension columns you want to display to the Column axis in order from high level to low level. Bind to the Row axis as shown below.

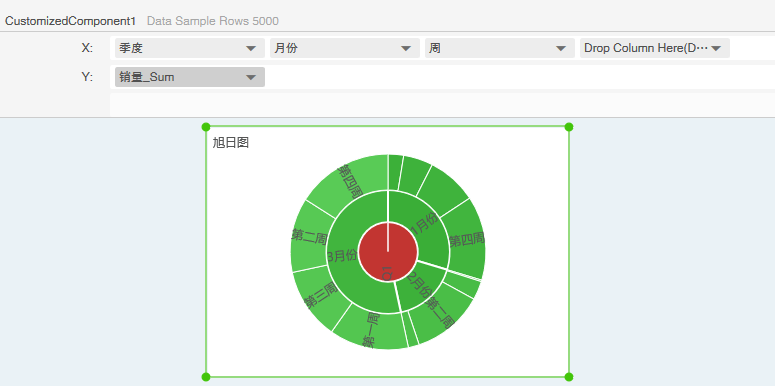
By clicking on the block on the Rising Sun chart, you can achieve the purpose of displaying only this part of the content, as shown in the following figure, which is the display effect after clicking the Q1 block.

You can customize the color information of the block in the regular-segment of the right pane, refer to the funnel chart.