|
<< Click to Display Table of Contents >> How to Do Flow Distribution |
  
|
|
<< Click to Display Table of Contents >> How to Do Flow Distribution |
  
|
Flow distribution usually adopts tree structure chart. This section uses the distribution of coffee orders as an example to show you how to use the tree structure chart to do flow distribution.
1.Add Component
From the right Component pane, drag the tree structure ![]() to the editing area.
to the editing area.
2.Bind Data
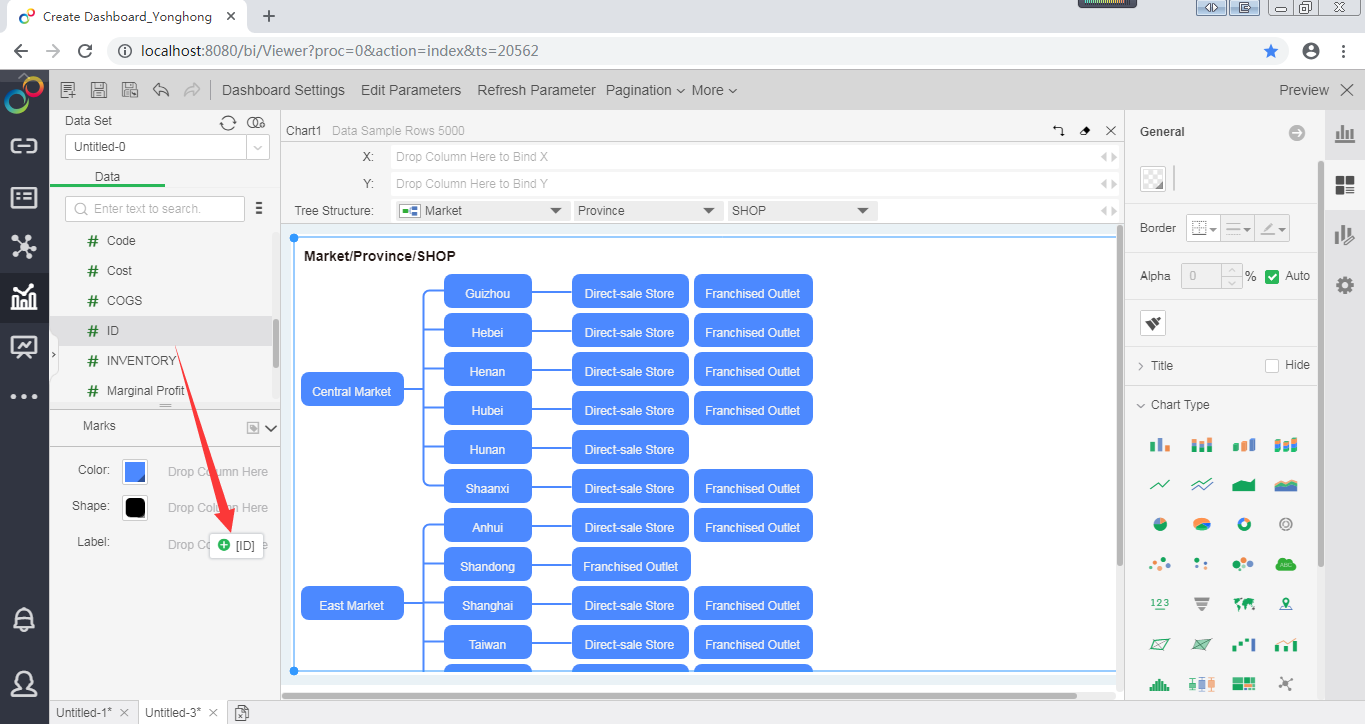
From the left data list, drag the dimensions "Market Size", "Province", "Shop" to the tree structure area.
3.Set Label
1) From the left data list, drag and drop the measure "ID" into the Label in Marks area.

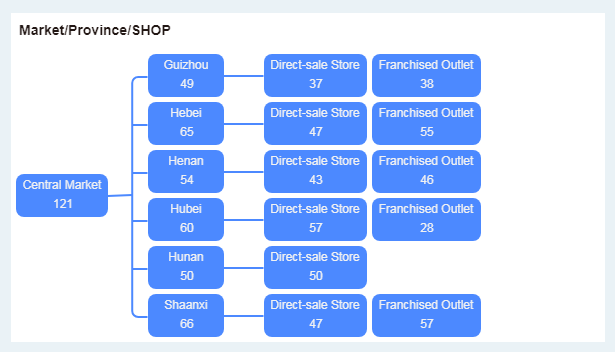
2) In the Label area, open the menu and select [Measure] -> [Accurate Distinct Count]. This will allow you to count and display the order quantity based on the order ID.

The final order distribution flow chart is as follows.
