|
<< Click to Display Table of Contents >> Set Line&Area Curve |
  
|
|
<< Click to Display Table of Contents >> Set Line&Area Curve |
  
|
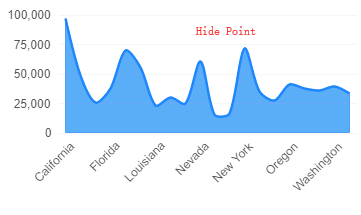
The user can set the line style of the Line and Area chart, including whether to display points on the line and whether to display smooth curves.
❖Curve Line
When the user selects this item, the line chart will be displayed as a smooth curve, as shown in the following figure:

❖Show Point
When the user does not select this item, no dots will appear in the line graph, as shown in the following figure:


❖Style
The user can change the style of the line graph. There are four styles to choose from. The effect after the change is as shown below:
