|
<< Click to Display Table of Contents >> Show The Mark Shape&Reference Line |
  
|
|
<< Click to Display Table of Contents >> Show The Mark Shape&Reference Line |
  
|
❖Set the shape of the marker
The user can set the mark shape of the point chart.
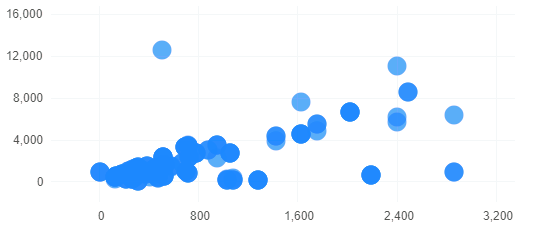
For example, the Point shows the dots by default, as shown in the following figure.

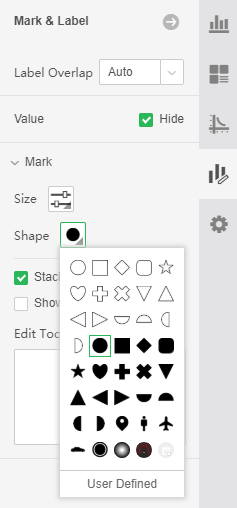
The user can select other Mark shapes,you can also click the user-defined button to upload the local SVG format image as the marker shape.

The effect of changing the shape is shown in the figure below.

❖Set whether to display the Reference Line
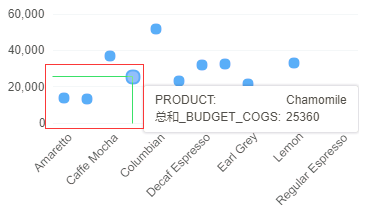
The user can set whether to display the points on the Column axis and Row axis in the figure.
When the user selects this item, the Reference Line is displayed when the mouse is hovered over the Mark of the Point Chart, as shown in the following figure:
