|
<< Click to Display Table of Contents >> How to Do Comprehensive Analysis |
  
|
|
<< Click to Display Table of Contents >> How to Do Comprehensive Analysis |
  
|
Multi-indicator comprehensive analysis usually uses radar charts. Take the coffee market's sales and profits as an example to show you how to use radar charts to do comprehensive analysis of multiple indicators.
1.Add Component
From the right Component pane, drag the radar chart ![]() to the editing area.
to the editing area.
2.Bind Data
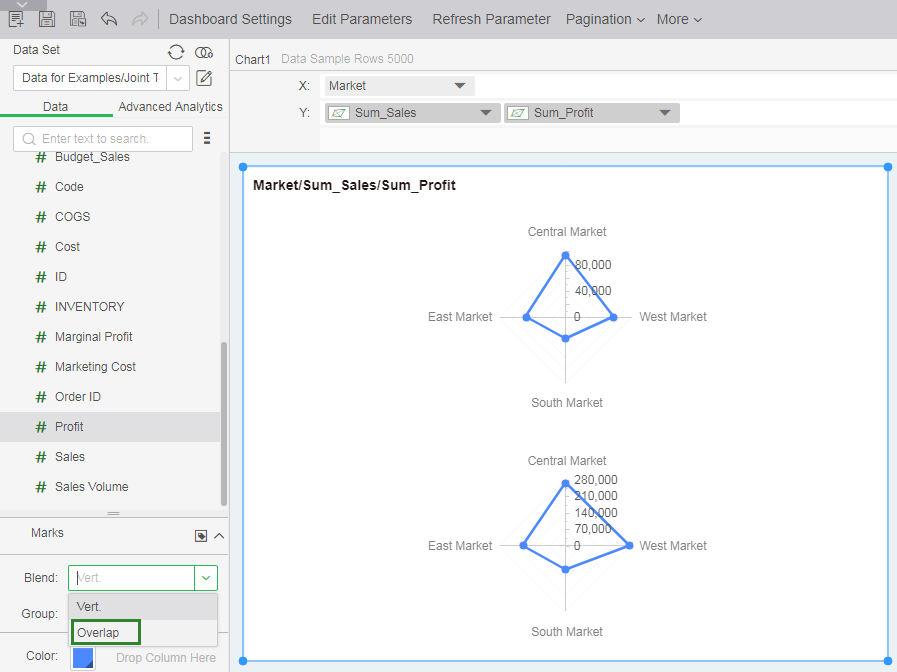
In the left data list, drag the dimension "Market" to the Column axis and the measures "Sales" and "Profit" to the Row axis.

3.Set Label
If you need to display multiple indicators in one radar chart, you must change the radar chart's mixing method. In the Marks group, select "Overlap" as the Blend mode.

The following radar chart was finally obtained.
