|
<< Click to Display Table of Contents >> How to Make a Waterfall Map |
  
|
|
<< Click to Display Table of Contents >> How to Make a Waterfall Map |
  
|
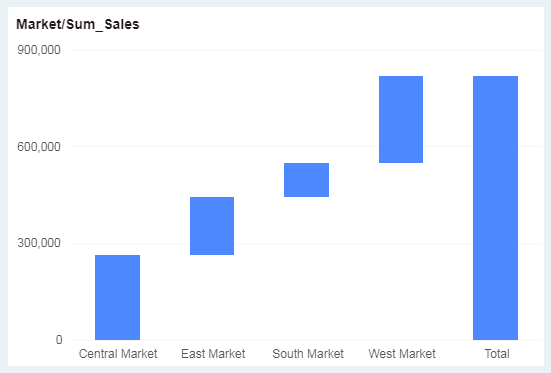
Waterfall charts show the cumulative effect of data and are summarized at the end. Take the sales revenue of the market as an example to show you how to make a waterfall chart.
1.Add Component
From the right Component pane, drag the waterfall chart ![]() to the editing area.
to the editing area.
2.Bind Data
In the left data list, drag the dimension "Market" to the Column axis and drag the measure "Sales" to the Row axis.
Finally get the following waterfall chart.
